. 2016 Apr 25;26(8):1117-25.
doi: 10.1016/j.cub.2016.02.064. Epub 2016 Mar 24.

Local Pheromone Release from Dynamic Polarity Sites Underlies Cell-Cell Pairing during Yeast Mating

Affiliations

Local Pheromone Release from Dynamic Polarity Sites Underlies Cell-Cell Pairing during Yeast Mating

Laura Merlini et al. Curr Biol. .

Abstract

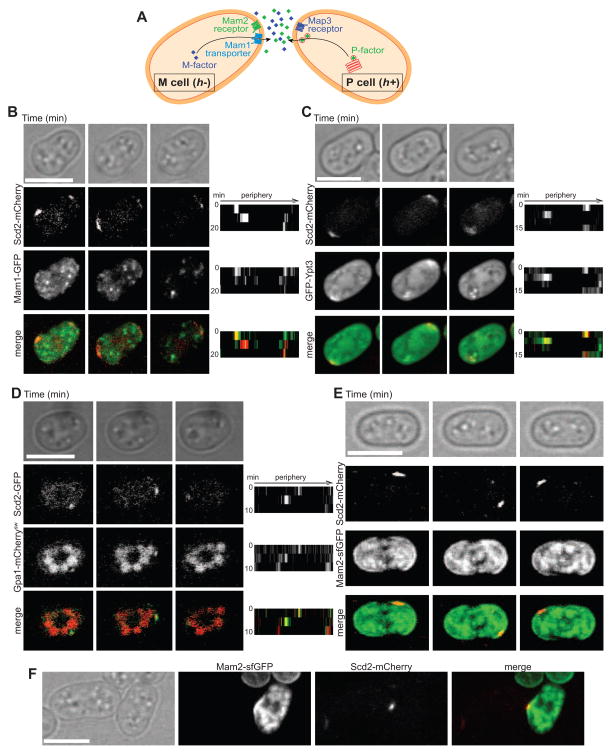
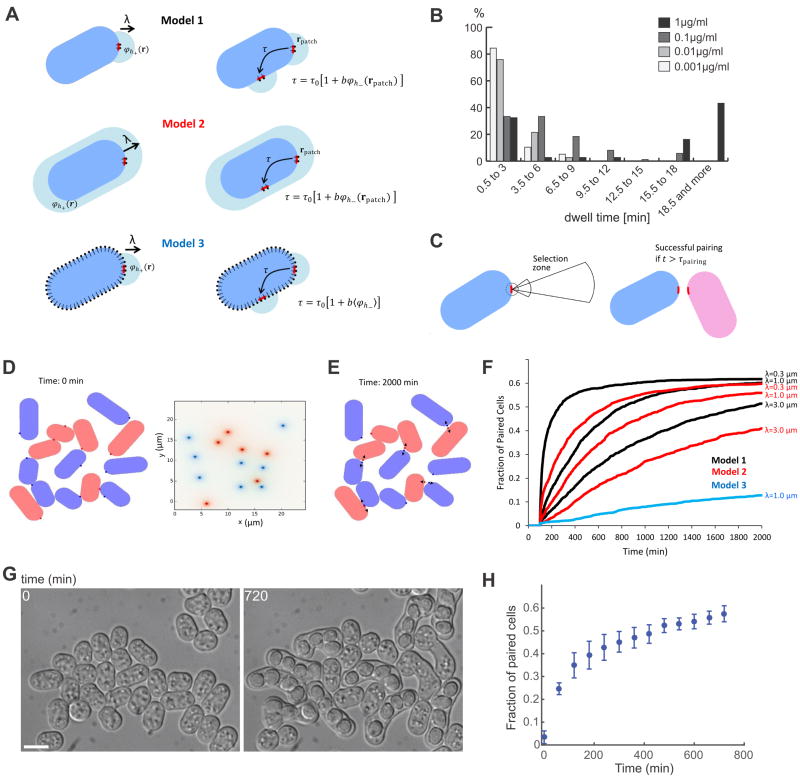
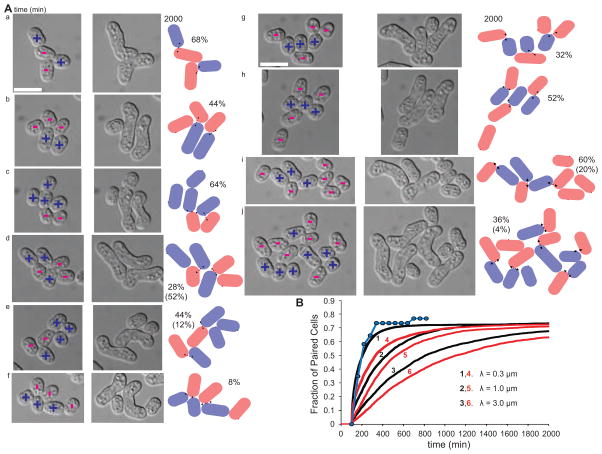
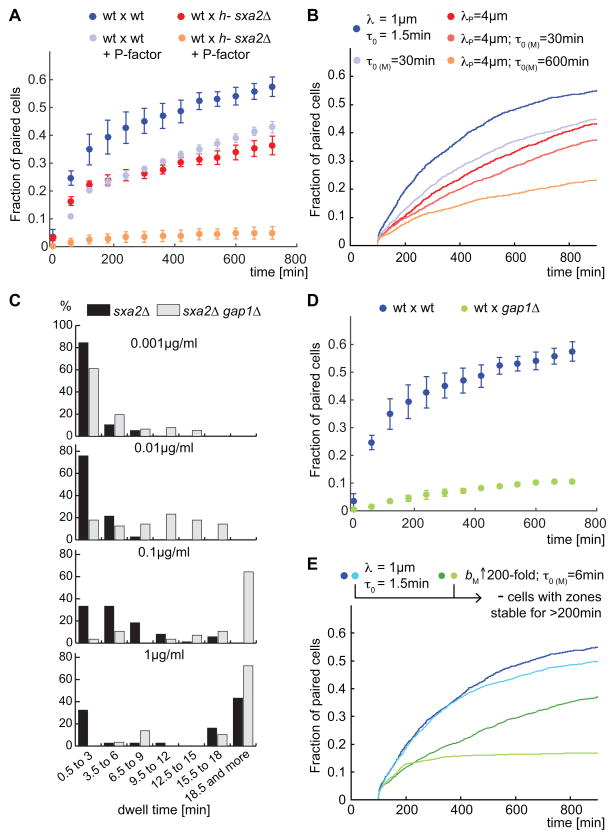
Cell pairing is central for many processes, including immune defense, neuronal connection, hyphal fusion, and sexual reproduction. How does a cell orient toward a partner, especially when faced with multiple choices? Fission yeast Schizosaccharomyces pombe P and M cells, which respectively express P and M factor pheromones [1, 2], pair during the mating process induced by nitrogen starvation. Engagement of pheromone receptors Map3 and Mam2 [3, 4] with their cognate pheromone ligands leads to activation of the Gα protein Gpa1 to signal sexual differentiation [3, 5, 6]. Prior to cell pairing, the Cdc42 GTPase, a central regulator of cell polarization, forms dynamic zones of activity at the cell periphery at distinct locations over time [7]. Here we show that Cdc42-GTP polarization sites contain the M factor transporter Mam1, the general secretion machinery, which underlies P factor secretion, and Gpa1, suggesting that these are sub-cellular zones of pheromone secretion and signaling. Zone lifetimes scale with pheromone concentration. Computational simulations of pair formation through a fluctuating zone show that the combination of local pheromone release and sensing, short pheromone decay length, and pheromone-dependent zone stabilization leads to efficient pair formation. Consistently, pairing efficiency is reduced in the absence of the P factor protease. Similarly, zone stabilization at reduced pheromone levels, which occurs in the absence of the predicted GTPase-activating protein for Ras, leads to reduction in pairing efficiency. We propose that efficient cell pairing relies on fluctuating local signal emission and perception, which become locked into place through stimulation.


Figures

Figure 1
Figure 1. Localization of the pheromone release and sensing machineries at polarized zones
(A) Schematic of the main pheromone secretion and sensing components in the two fission yeast mating types. (B–F) Transmitted light images and spinning disk confocal projections of h90 wild-type strains showing co-localization of Scd2-mCherry and Mam1-GFP (B), Scd2-mCherry and GFP-Ypt3 (C), Scd2-GFP and Gpa1-mCherrysw (D), Scd2-mCherry and Mam2-sfGFP (E, F). Kymographs of the cell periphery are shown on the right (B–D). Arrowheads highlight dynamic zones of co-localization. See Figure S1 for additional co-localization images and kymographs. Scale bars are 5 μm.
Figure 2
Figure 2. Model and experiment of fission yeast mating kinetics
(A) Schematic of three mechanisms for pheromone secretion and sensing. A P (h+) cell is shown in blue, secreted pheromone (P-factor) in light blue, Cdc42-GTP patch in red, and region of sensing indicated by black receptors. Model 1: Local pheromone secretion and local sensing of opposite pheromone; Model 2: Uniform pheromone secretion and local sensing of opposite pheromone; Model 3: Local pheromone secretion and uniform sensing of opposite pheromone. For each model the corresponding equation of Cdc42 patch lifetime τ is shown. For Models 1 and 2, τ depends on the concentration of M-factor at the patch position rpatch, while in model 3 τ depends on the average concentration of M-factor around the cell perimeter. (B) Dependency of patch lifetime on pheromone concentration. h− sxa2Δ scd2-GFP cells were exposed to indicated amounts of P-factor and the lifetime of Scd2 cortical zones was measured in 25 cells for each condition (n = 135; 112; 87; 37 zones for 0.001; 0.01; 0.1 and 1μg/ml P-factor, respectively). (C) Cells in the simulation mate if they become mutually engaged for a time longer than τpairing = 100 min. Cells are considered engaged if an opposite mating type patch is within a selection zone, representing the region over which a shmoo would be able to grow. Blue and pink cells represent P and M cells, respectively. (D) Example of snapshot of simulations at t = 0 and the corresponding pheromone concentration field for λ = 3 μm. (E) Snapshot of the same simulation as panel D after 2000 min. Arrows show final pairing results. See movie S1. (F) Fraction of paired cells vs. time for the three models, for different decay lengths λ. Each line shows the average of 100 runs of 36 cells of random mating type, placed at random locations (for each run). Each curve shows the results obtained with a value b to within 10% of the optimal value that gives the most efficient pairing. (Model 1: λ = 0.3 μm: 0= 55000; λ = 1 μm: 0= 2000; λ = 3 μm: 0= 1500. Model 2: λ = 0.3 μm: 0= 1050; λ = 1 μm: 0= 100; λ = 3 μm: 0= 40. Model 3: λ = 1 μm: 0= 7000.) See Figure S2 and movies S2 and S3 for further analysis of model parameters. (G) DIC images of representative fields of cells at the beginning and end of a two-dimensional mating experiment on agarose pad as in (H). Scale bar is 5μm. (H) Cell-cell pairing kinetics of a population of mating cells (n=3 experiments, >800 cells each). P and M cells were mixed 1:1, shifted to MSL-N for 4h, spotted on MSL-N agarose pad for 1h and imaged for 12h. Time 0 indicates the start of imaging, 5h after starvation. All error bars are SD.
Figure 3
Figure 3. Cell-cell pairing occurs efficiently in fission yeast
(A) DIC images showing examples of small groups of cells pairing (+ = P-cells, − = M-cells) at the beginning and the end of the experiment. P and M cells were mixed 1:1, shifted to MSL-N for 4h, spotted on MSL-N agarose pad for 1h and imaged for 12h. P cells express Scd1-3GFP and M cells express Scd2-mCherry to distinguish the mating type (not shown). Scale bars are 5 μm. The images on the right are examples of simulation results of similar groups of cells. P cells are shown in blue, M cells are shown in pink, arrows indicate the final pairing configuration. The percentages show the probability of observing the displayed mating pattern in 25 runs. The percentages in brackets show the probability of finding the experimental mating pattern in simulations, for those cases where the shown simulation outcome differs from experiment. See Movie S4 for the animation as in panel d, and Figure S3 for experimental timelapse imaging of polarity zones. (B) Cell-cell pairing kinetics of the small groups of cells as in (A) (blue curve) or resulting from in silico simulations (black and red curves, corresponding to Model 1 and 2 of Figure 1, respectively). Note that the time 0 of the experimental curve (i.e. start of imaging) was aligned to the 100min time of the simulation curves. Curves show the average of 100 simulations, each with all the shown small cell groups. Results use the optimal sensitivity parameter for this configuration, calculated as in Figure 1F (Model 1: λ = 0.3 μm: 0= 15000; λ = 1 μm: 0= 3000; λ = 3 μm: 0= 1000. Model 2: λ = 0.3 μm: 0= 1050; λ = 1 μm: 0= 100; λ = 3 μm: 0= 40).
Figure 4
Figure 4. Increased pheromone decay length and sensitivity impair cell-cell pairing
(A) Cell-cell pairing kinetics of wt mated with wt or sxa2Δ mutant cells (n=3 experiments, >800 cells each), treated as in Figure 2H. (B) Fraction of paired cells vs. time in simulations using Model 1, calculated as in Figure 2F. The wild type reference values are λ = 1 μm, τ0 = 1.5 and optimal b for wt x wt simulation. The values of λ corresponding to P-factor and τ0 of h- cells were varied as indicated, adjusting b each time such that bτ0 is unchanged (see Equation (2) of supplemental text). (C) gap1Δ cells exhibit longer zone lifetimes than gap1+ cells. Experiment and data as in Figure 2B, comparing h- sxa2Δ scd2-GFP with h- sxa2Δ gap1Δ scd2-GFP cells (n = 77; 56; 28; 29 zones in gap1Δ cells for 0.001; 0.01; 0.1 and 1μg/ml P-factor, respectively). Data in Figure S4A–C shows the role of Ras1 in zone exploration. (D) Cell-cell pairing kinetics of wt x gap1Δ mutant cells (n=3 experiments, >800 cells each), treated as in Figure 2H. (E) Fraction of simulated paired cells vs. time, with values of τ0 and b for M-cells estimated from the zone residence times and response to pheromone of gap1Δ cells in panel C. Cells with zones stable for more than 200 min were taken out of the simulation for the results of the indicated curves, to account for lysis and unreciprocated shmoos. See Figure S4D for representative images of mating cell fields.

Comment in

Similar articles

Cited by

References

    1. Imai Y, Yamamoto M. The fission yeast mating pheromone P-factor: its molecular structure, gene structure, and ability to induce gene expression and G1 arrest in the mating partner. Genes Dev. 1994;8:328–338. - PubMed
    1. Davey J. Mating pheromones of the fission yeast Schizosaccharomyces pombe: purification and structural characterization of M-factor and isolation and analysis of two genes encoding the pheromone. EMBO J. 1992;11:951–960. - PMC - PubMed
    1. Tanaka K, Davey J, Imai Y, Yamamoto M. Schizosaccharomyces pombe map3+ encodes the putative M-factor receptor. Mol Cell Biol. 1993;13:80–88. - PMC - PubMed
    1. Kitamura K, Shimoda C. The Schizosaccharomyces pombe mam2 gene encodes a putative pheromone receptor which has a significant homology with the Saccharomyces cerevisiae Ste2 protein. Embo J. 1991;10:3743–3751. - PMC - PubMed
    1. Obara T, Nakafuku M, Yamamoto M, Kaziro Y. Isolation and characterization of a gene encoding a G-protein alpha subunit from Schizosaccharomyces pombe: involvement in mating and sporulation pathways. Proc Natl Acad Sci U S A. 1991;88:5877–5881. - PMC - PubMed

MeSH terms

Substances

LinkOut - more resources