

Vasopressin Regulates Extracellular Vesicle Uptake by Kidney Collecting Duct Cells
- PMID: 27020854
- PMCID: PMC5084879
- DOI: 10.1681/ASN.2015050568
Vasopressin Regulates Extracellular Vesicle Uptake by Kidney Collecting Duct Cells
Abstract
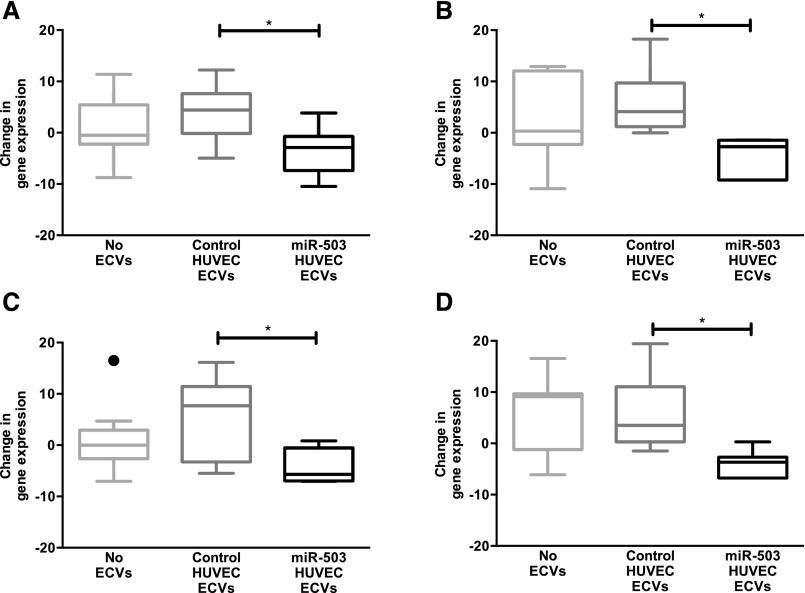
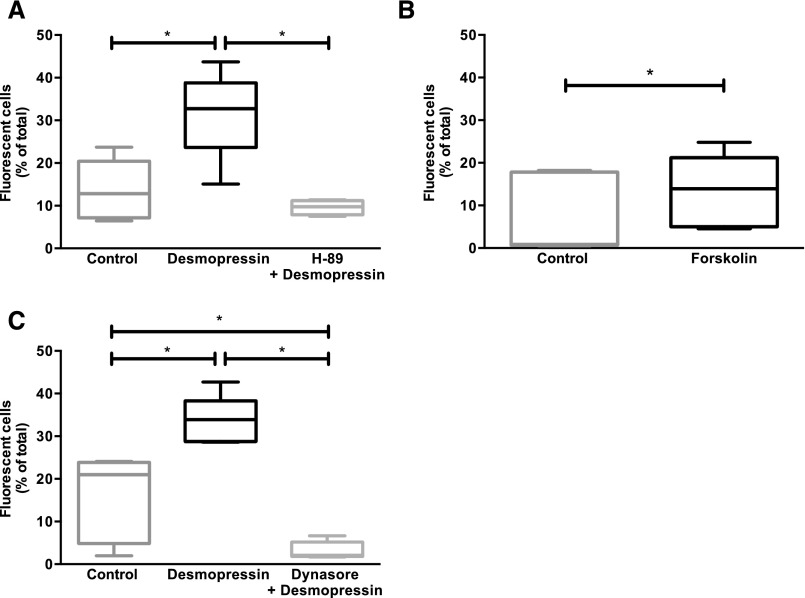
Extracellular vesicles (ECVs) facilitate intercellular communication along the nephron, with the potential to change the function of the recipient cell. However, it is not known whether this is a regulated process analogous to other signaling systems. We investigated the potential hormonal regulation of ECV transfer and report that desmopressin, a vasopressin analogue, stimulated the uptake of fluorescently loaded ECVs into a kidney collecting duct cell line (mCCDC11) and into primary cells. Exposure of mCCDC11 cells to ECVs isolated from cells overexpressing microRNA-503 led to downregulated expression of microRNA-503 target genes, but only in the presence of desmopressin. Mechanistically, ECV entry into mCCDC11 cells required cAMP production, was reduced by inhibiting dynamin, and was selective for ECVs from kidney tubular cells. In vivo, we measured the urinary excretion and tissue uptake of fluorescently loaded ECVs delivered systemically to mice before and after administration of the vasopressin V2 receptor antagonist tolvaptan. In control-treated mice, we recovered 2.5% of administered ECVs in the urine; tolvaptan increased recovery five-fold and reduced ECV deposition in kidney tissue. Furthermore, in a patient with central diabetes insipidus, desmopressin reduced the excretion of ECVs derived from glomerular and proximal tubular cells. These data are consistent with vasopressin-regulated uptake of ECVs in vivo We conclude that ECV uptake is a specific and regulated process. Physiologically, ECVs are a new mechanism of intercellular communication; therapeutically, ECVs may be a vehicle by which RNA therapy could be targeted to specific cells for the treatment of kidney disease.
Keywords: exosomes; vasopressin; vesicles.
Copyright © 2016 by the American Society of Nephrology.
Figures


Comment in
-
Cell biology: Intercellular communication in the kidney.Nat Rev Nephrol. 2016 Jun;12(6):314. doi: 10.1038/nrneph.2016.50. Epub 2016 Apr 12. Nat Rev Nephrol. 2016. PMID: 27067527 No abstract available.
Similar articles
-
Exosomal transmission of functional aquaporin 2 in kidney cortical collecting duct cells.J Physiol. 2011 Dec 15;589(Pt 24):6119-27. doi: 10.1113/jphysiol.2011.220277. Epub 2011 Oct 24. J Physiol. 2011. PMID: 22025668 Free PMC article.
-
Structural and functional changes in epitheliocytes of collecting tubes in renal papilla of Brattleboro rats treated with vasopressin.Bull Exp Biol Med. 2007 Jan;143(1):94-8. doi: 10.1007/s10517-007-0026-x. Bull Exp Biol Med. 2007. PMID: 18019023
-
Escape from vasopressin-induced antidiuresis: role of vasopressin resistance of the collecting duct.Am J Physiol. 1998 Jun;274(6):F1161-6. doi: 10.1152/ajprenal.1998.274.6.F1161. Am J Physiol. 1998. PMID: 9841509
-
Physiological effects of vasopressin and atrial natriuretic peptide in the collecting duct.Cardiovasc Res. 2001 Aug 15;51(3):470-80. doi: 10.1016/s0008-6363(01)00248-6. Cardiovasc Res. 2001. PMID: 11476737 Review.
-
Vasopressin type-2 receptor and aquaporin-2 water channel mutants in nephrogenic diabetes insipidus.Am J Med Sci. 1998 Nov;316(5):300-9. doi: 10.1097/00000441-199811000-00003. Am J Med Sci. 1998. PMID: 9822112 Review.
Cited by
-
Nephron mass determines the excretion rate of urinary extracellular vesicles.J Extracell Vesicles. 2022 Jan;11(1):e12181. doi: 10.1002/jev2.12181. J Extracell Vesicles. 2022. PMID: 35064766 Free PMC article.
-
The role of extracellular vesicles in renal fibrosis.Cell Death Dis. 2019 May 8;10(5):367. doi: 10.1038/s41419-019-1605-2. Cell Death Dis. 2019. PMID: 31068572 Free PMC article. Review.
-
Urinary exosomes as promising biomarkers for early kidney disease detection.Am J Clin Exp Urol. 2025 Feb 15;13(1):1-19. doi: 10.62347/DAKE5842. eCollection 2025. Am J Clin Exp Urol. 2025. PMID: 40124571 Free PMC article. Review.
-
In sickness and in health: The functional role of extracellular vesicles in physiology and pathology in vivo: Part I: Health and Normal Physiology: Part I: Health and Normal Physiology.J Extracell Vesicles. 2022 Jan;11(1):e12151. doi: 10.1002/jev2.12151. J Extracell Vesicles. 2022. PMID: 35041249 Free PMC article. Review.
-
Urinary microvesicles: a window into the kidney.Clin Kidney J. 2025 Jun 17;18(7):sfaf189. doi: 10.1093/ckj/sfaf189. eCollection 2025 Jul. Clin Kidney J. 2025. PMID: 40873806 Free PMC article. Review.
References
-
- Caby M-P, Lankar D, Vincendeau-Scherrer C, Raposo G, Bonnerot C: Exosomal-like vesicles are present in human blood plasma. Int Immunol 17: 879–887, 2005 - PubMed
-
- Vlassov AV, Magdaleno S, Setterquist R, Conrad R: Exosomes: Current knowledge of their composition, biological functions, and diagnostic and therapeutic potentials. Biochim Biophys Acta 1820: 940–948, 2012 - PubMed
-
- Bramham K, Mistry HD, Poston L, Chappell LC, Thompson AJ: The non-invasive biopsy--will urinary proteomics make the renal tissue biopsy redundant? QJM 102: 523–538, 2009 - PubMed
MeSH terms
Substances
Grants and funding
LinkOut - more resources
Full Text Sources
Other Literature Sources
Molecular Biology Databases
