. 2016 May 13;118(10):1540-52.
doi: 10.1161/CIRCRESAHA.116.308648. Epub 2016 Mar 28.

CCR5+T-bet+FoxP3+ Effector CD4 T Cells Drive Atherosclerosis

Affiliations

CCR5+T-bet+FoxP3+ Effector CD4 T Cells Drive Atherosclerosis

Jie Li et al. Circ Res. .

Abstract

Rationale: CD4 T cells are involved in the pathogenesis of atherosclerosis, but atherosclerosis-specific CD4 T cells have not been described. Moreover, the chemokine(s) that regulates T-cell trafficking to the atherosclerotic lesions is also unknown.

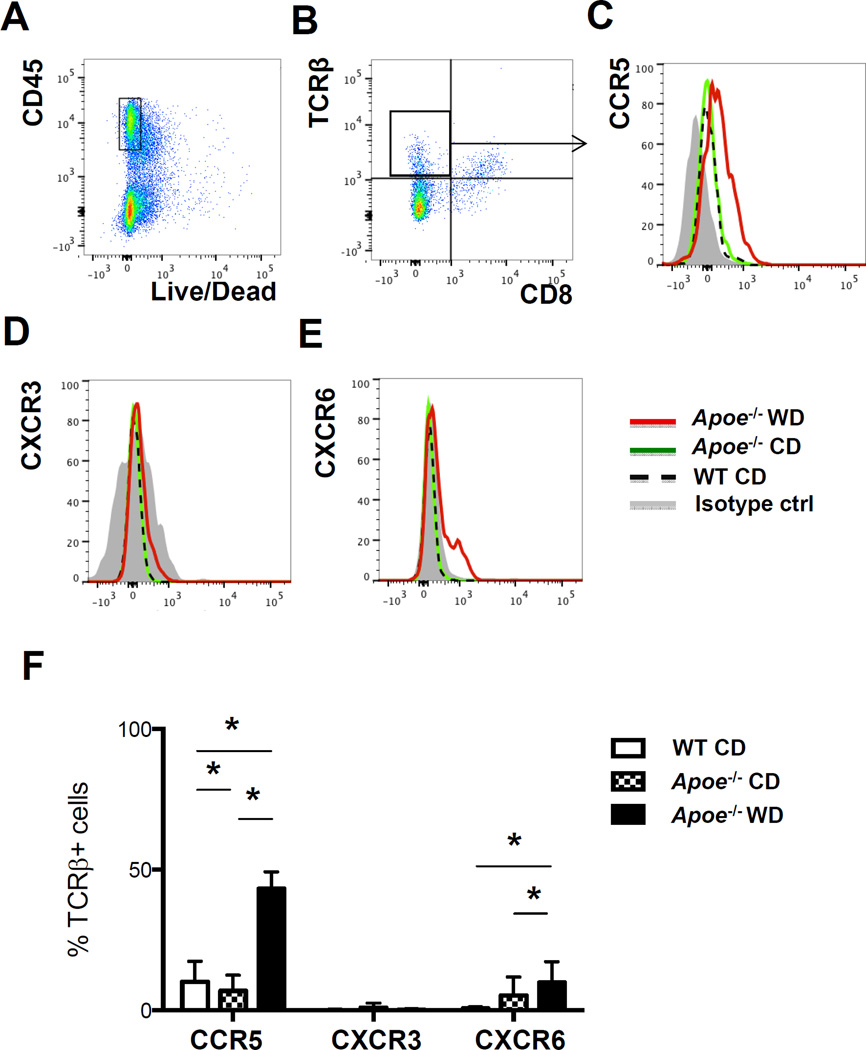
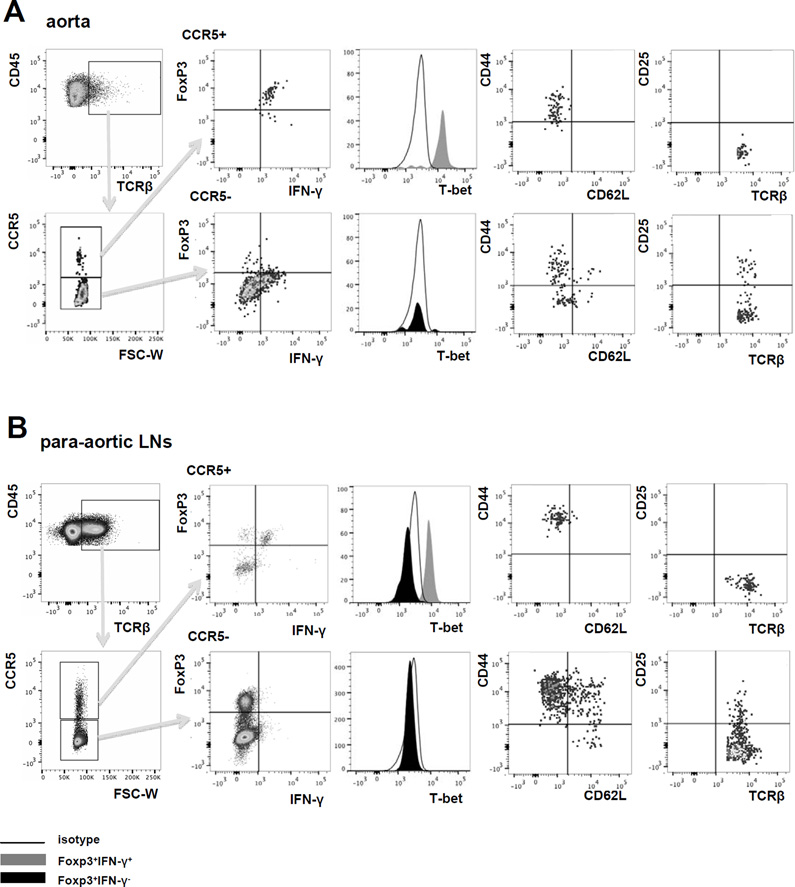
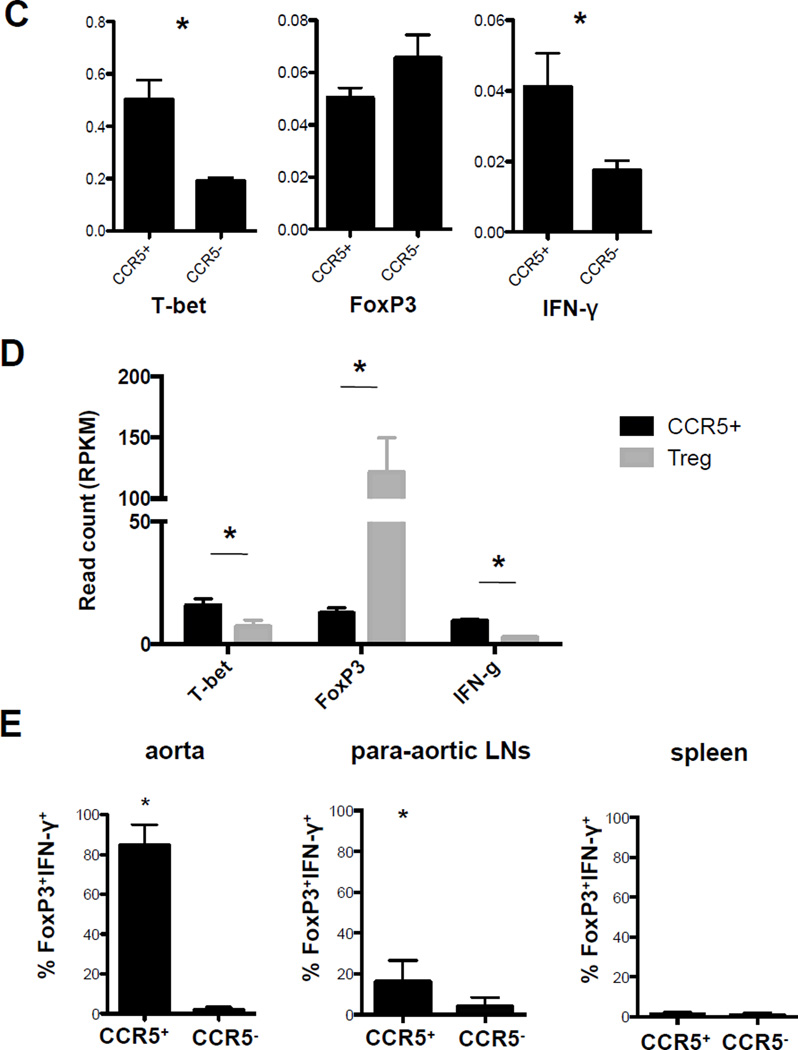
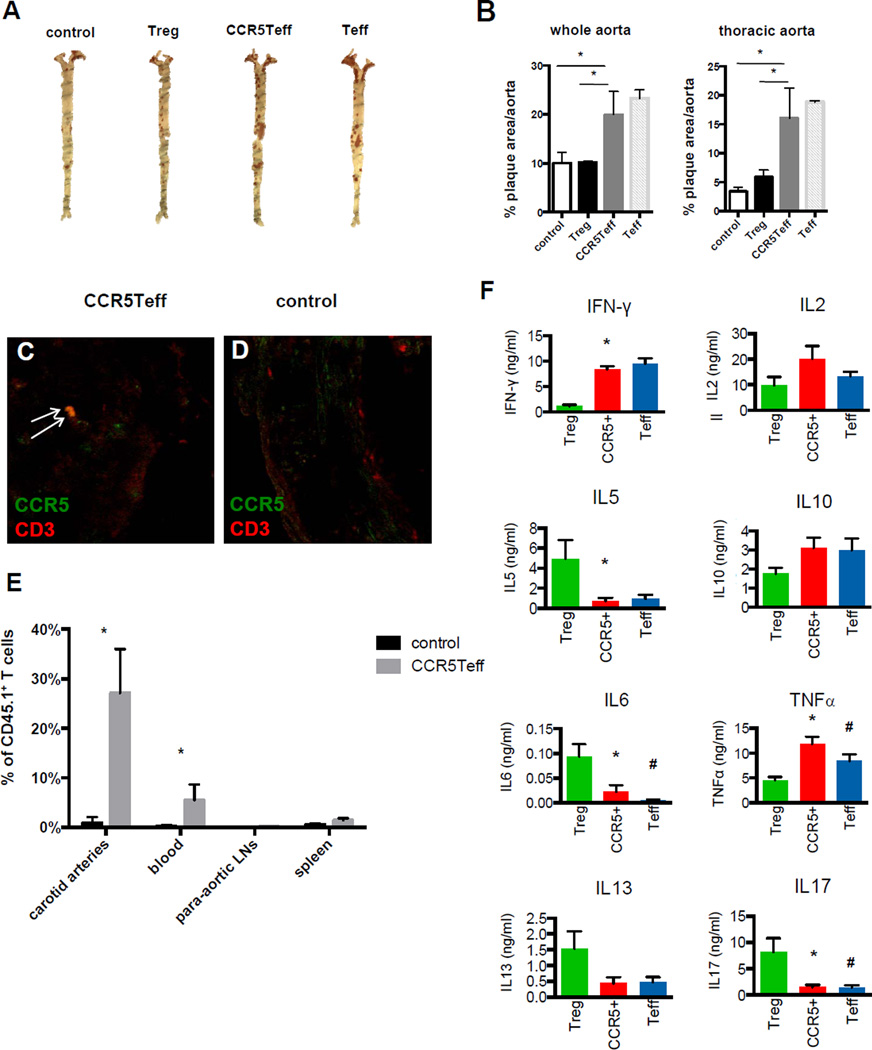
Objective: In Apoe(-/-) mice with mature atherosclerotic lesions (5 months of high fat diet), we find that most aortic T cells express CCR5 and interferon-γ with a unique combination of cell surface markers (CD4(+)CD25(-)CD44(hi)CD62L(lo)) and transcription factors (FoxP3(+)T-bet(+)). We call these cells CCR5Teff. We investigated the role of CCR5 in regulating T-cell homing to the atherosclerotic aorta and the functionality of the CCR5Teff cells.

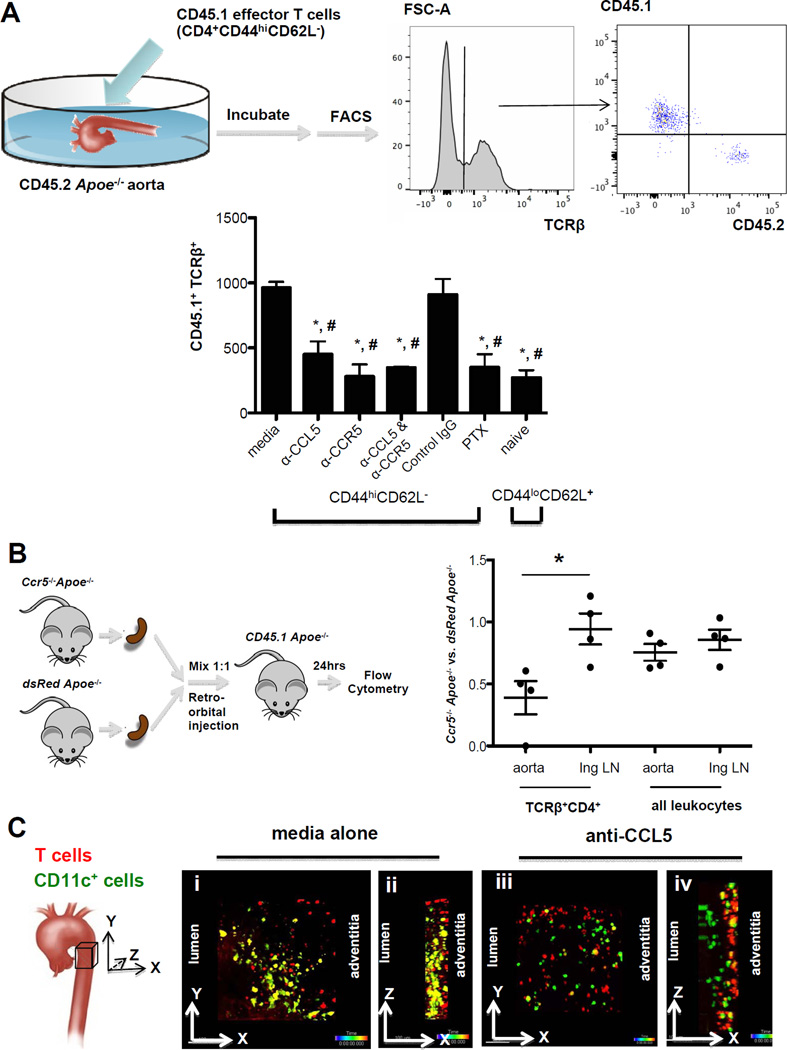
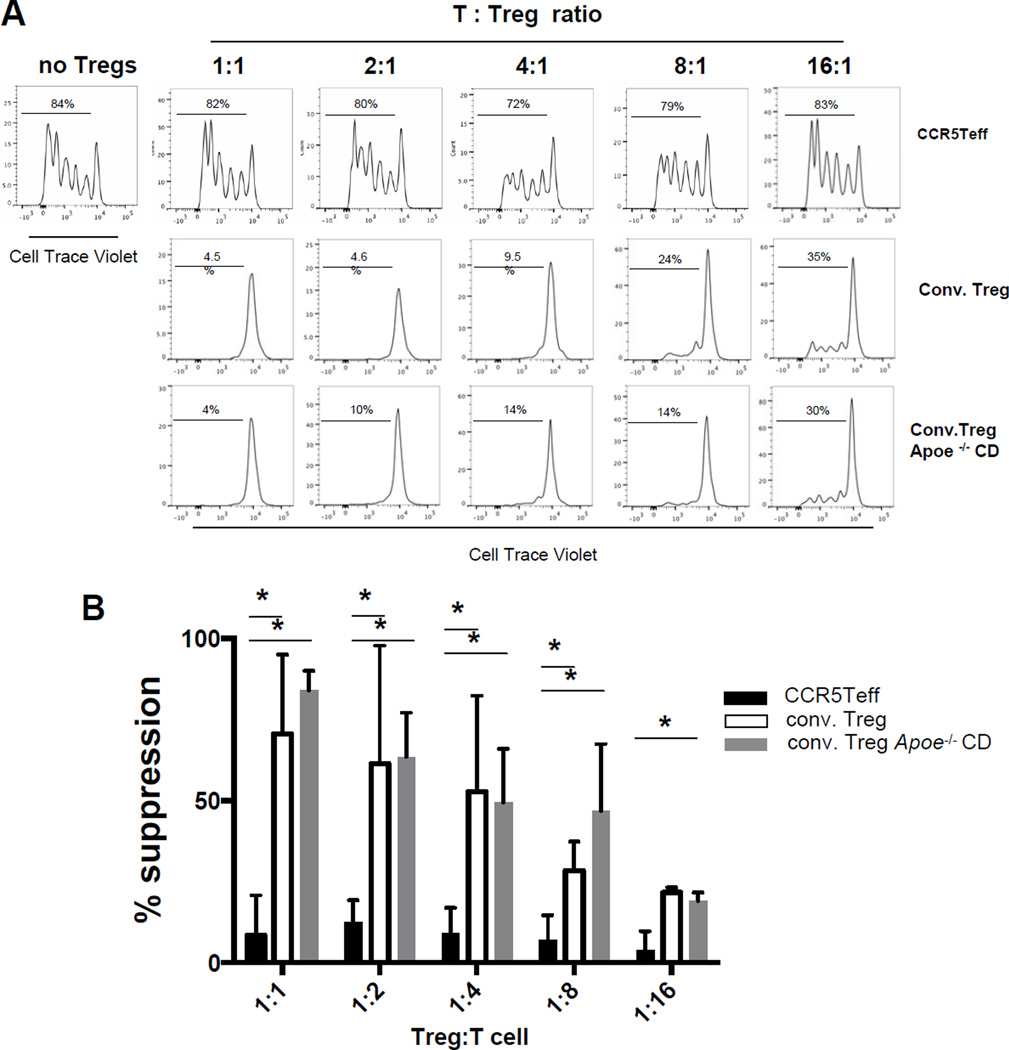
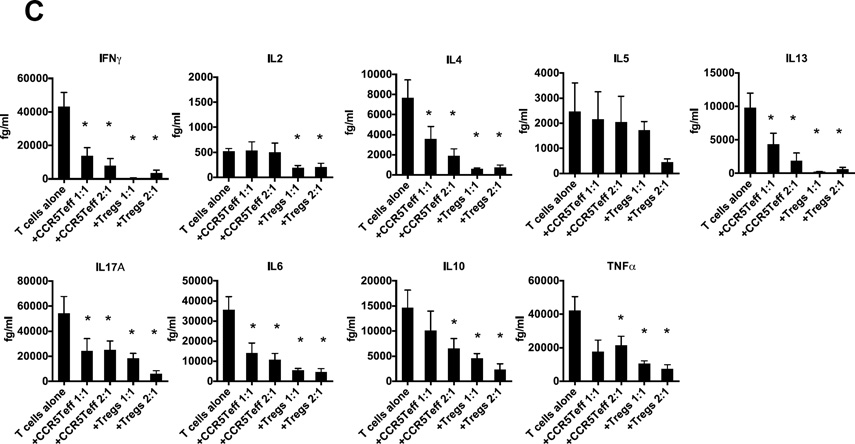
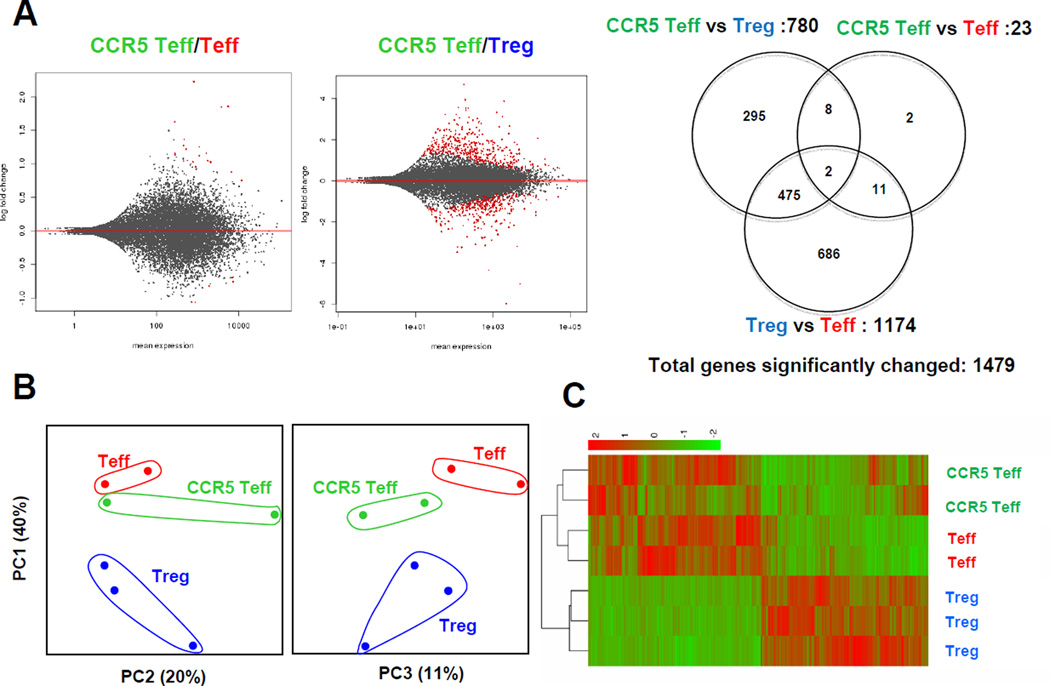
Methods and results: CCR5Teff cells are exclusively found in the aorta and para-aortic lymph nodes of Apoe(-/-) mice. They do not suppress T-cell proliferation in vitro and are less potent than regulatory T cells at inhibiting cytokine secretion. Blocking or knocking out CCR5 or its ligand CCL5 significantly blocks T-cell homing to atherosclerotic aortas. Transcriptomic analysis shows that CCR5Teff cells are more similar to effector T cells than to regulatory T cells. They secrete interferon-γ, interleukin-2, interleukin-10, and tumor necrosis factor. Adoptive transfer of these CCR5Teff cells significantly increases atherosclerosis.

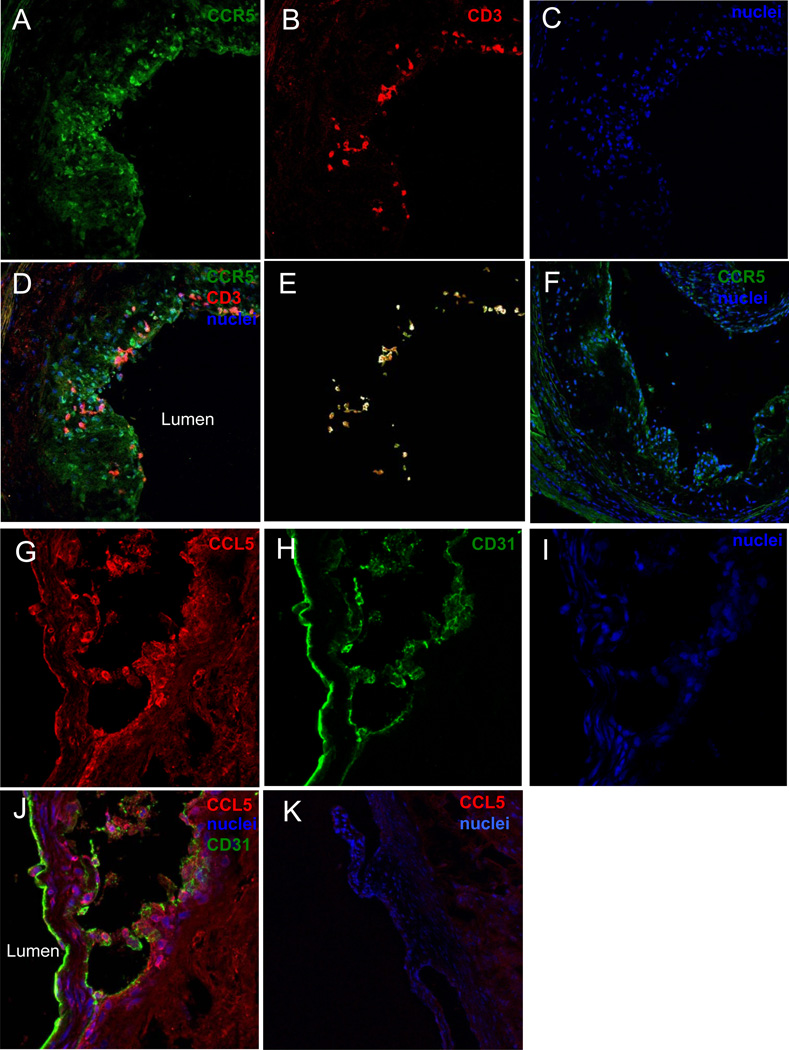
Conclusions: CCR5 is specifically needed for CD4 T-cell homing to the atherosclerotic plaques. CCR5(+)CD4 T cells express an unusual combination of transcription factors, FoxP3 and T-bet. Although CCR5Teff express FoxP3, we showed that they are not regulatory and adoptive transfer of these cells exacerbates atherosclerosis.

Keywords: CCR5 protein, mouse; Ccl5 protein, mouse; Treg cells; atherosclerosis; chemokines; inflammation; vascular diseases.


Conflict of interest statement

DISCLOSURES

The authors have declared that no conflict of interest exists.

Figures

Figure 1
Figure 1. CCR5 and CXCR6 expression on aortic T cells is increased in Apoe−/− mice on WD
Aortas from Apoe−/− on WD (n=8) or CD (n=4) mice and C56BL/6 WT mice (n=4) were digested and analyzed by multi-color flow cytometry. A, Cells gated on live CD45+ and B, on CD4 T cells (TCRβ+CD8). C, CCR5 D, CXCR3 and E, CXCR6 on aortic CD4 T cells of Apoe−/− mice on WD (red) or CD (green) or WT mice (dotted black); isotype controls in grey. F, Mean±SD of CCR5, CXCR3 and CXCR6 expression on CD4 T cells. * p<0.05 by t-test.
Figure 2
Figure 2. Localization of CCR5+ T cells and CCL5 in the aorta root of Apoe−/− mice on WD
Fresh frozen aortic root sections from Apoe−/− WD mice were fixed and stained with fluorescently labeled antibodies to A, CCR5 (green), B, CD3 (red), C, nuclei (blue), D, merge. E, Colocolization between CCR5 and CD3 was analyzed by creating a mask of CD3 and apply it to CCR5 (image J). F, CCR5 and nuclei staining on aorta root sections from CCR5−/−Apoe−/− mice. G, CCL5 (red), H, CD31 (green), I, nuclei (blue) and J, merge. K, CCL5 and nuclei staining on aorta root sections from CCL5−/− mice.
Figure 3
Figure 3. Neutralizing CCL5 or CCR5 inhibits T cell infiltration into the Apoe−/− aorta
A, Effector T cells (CD4+CD25CD44hiCD62L) or naïve CD4 T cells (CD4+CD25CD44lo CD62L+) from spleens of Cd45.1Apoe−/− WD mice were incubated with aortas from Cd45.2Apoe−/− WD mice with media alone, anti-CCL5 (1ug/ml), anti-CCR5 (10ug/ml), IgG control antibody (10ug/ml) or pertussis toxin (PTX, 300ng/ml) over night. CD45.1+ T cells infiltrating into aorta and left in the supernatant were quantified by flow cytometry (right panels). n=5 in each group. Bar graph: mean±SE. *p<0.05 vs media, # p<0.05 vs IgG. t-test. B, Impaired CCR5 deficient T cells homing to the Apoe−/− aorta. 6×10⁷ splenocytes from dsRedApoe−/− mice and Ccr5−/−Apoe−/− mice were transferred at 1:1 ratio to CD45.1Apoe−/− WD mice by retro-orbital injection. 24 hrs later, cells from the aorta and inguinal LNs (Ing) of the recipients were analyzed by flow cytometry. The percentage of transferred TCRβ+CD4+ T cells and all CD45.2 leukocytes was normalized by its percentage in the input. Data shown is the ratio of Ccr5−/−Apoe−/− vs. dsRedApoe−/− cells. * p<0.05, n=5, t-test. C, Two photon imaging of isolated aorta co-cultured with effector T cells. Effector T cells from Apoe−/− WD mice were labeled with SNARF and then incubated with aorta from CD11c-YFP Apoe−/− WD mice without (i and ii) or with (iii and iv) anti-CCL5. Maximum intensity projection along z axis (top view) (i and iii) and axis (side view) (ii and iv) through the image stacks from the adventitia of aorta are shown.
Figure 4
Figure 4. CCR5+ T cells express FoxP3, IFN-γ and T-bet (CCR5Teff). T cells from A, aorta and B, paLNs of Apoe−/− mice on WD for > 5 months were analyzed by multi-color flow cytometry
Cells were gated on live CD45+ singlets TCRβ+. Gates are set based on FMO and isotype controls. One representative experiment is shown. C, CD4+CCR5+CD25 (CCR5+, enriched CCR5Teff) and CD4+CCR5 (CCR5−) T cells were sorted from the paLNs of Apoe−/− mice on WD. mRNA was extracted and gene expression was analyzed for T-bet, FoxP3 and IFN-γ by rear-time PCR. *p<0.05, n=5, T-test. D, CD4+CCR5+CD25 (CCR5+) and CD4+CD25+CCR5 (Treg) were sorted from paLNs of Apoe−/− mice on WD >5months. mRNA were extracted for next-generation sequencing. Normalized read count of T-bet, FoxP3, and IFN-γ were shown. *p<0.05, T-test. E, Percentage of Foxp3+IFN-γ+ cells among CCR5+ and CCR5 T cells, mean ± SEM, *p<0.05 by 2 way ANOVA, n=5 in aorta, n=4 in paLNs and spleen.
Figure 5
Figure 5. CCR5Teff cells do not suppress T cell proliferation but reduce T cell cytokine secretion
A, Splenic CellTrace Violet labeled CD4+CD25 T cells (1×10⁴ per well) isolated from Apoe−/− CD mice were cultured with anti-CD3 mAb in the presence of 5×10⁴ irradiated T-depleted splenic APCs and decreasing numbers of CD4+CCR5+ cells (top row) or CD4+CCR5GFP+ conventional Tregs sorted from paLNs of FoxP3GFPApoe−/− WD>5mth mice (middle row) or from Apoe−/−CD mice (bottom row). After 4 days of culture, proliferation was measured by CellTrace Violet signal using flow cytometry. B, Mean±SD of suppression of proliferation (n=3 experiments).* p<0.05 by t-test. C. Cytokine secretion from CD4+CD25 T cells (1×10⁴ per well) cultured with CCR5Teff or conventional Treg sorted from WD mice were measured by cytometric bead array. n=5. Mean±SD. * p<0.05 vs. T cells alone, t-test.
Figure 6
Figure 6. CCR5Teff cells are similar to effector T cells but not Tregs
CCR5Teff (CD4+CCR5+CD25), Tregs (CD4+CD25+) and Teff (CD4+CD25CCR5CD44hiCD62Llo) were sorted from the paLNs from Apoe−/− mice on WD for >5 months. RNA was extracted from the three populations, amplified, reverse transcribed and subjected to next generation sequencing (Illumina). A, The MA-plot shows the log fold changes as a function of the mean of normalized read counts. Genes with an adjusted p-value below 0.05 are shown in red. Venn diagram represents a summary of differentially expressed genes in the three contrasts as indicated. B, Principal component analysis of normalized read counts (n=14,839) shows the relatedness of samples. The first three principal components accounted for more than 70% of the total variance. C, Unsupervised clustering of the 1,479 differentially expressed genes also separates CCR5 Teff, Teff and Treg from all samples. The colors of the heatmap represent normalized gene counts (red as high).
Figure 7
Figure 7. Adoptive transfer CD4+CCR5+CD25 T cells increases atherosclerosis
A, Sudan IV stained aortas (whole aorta and thoracic aorta) from Ccr5−/−Apoe−/− mice that received 2×10⁵ enriched CCR5Teff, Treg or Teff isolated from paLNs of Cd45.1Apoe−/− mice on WD for 5 month or saline (control) i.v. 12 weeks before analysis. B, Quantification of plaque area as % of aortic surface. n=5, * p<0.05, t-test. C and D, IHC of aorta root sections of the recipients that received CCR5Teff (C) or saline (D) stained with CCR5 (green) and CD3 (green). The CCR5+CD3+ T cells were indicated by arrows. E, Flow cytometry analysis of the carotid arteries, blood, paLNs and spleen of the Ccr5−/−Apoe−/− recipient mice that received 2×10⁵ CCR5Teff or saline. The CD45.1+ TCRβ+ donor T cells were gated from live CD45+ singlets TCRβ+. Percent CD45.1+ among all TCRβ+ cells indicated above gate. n=5, Mean±SE, t-test, *p<0.05. F, CCR5Teff (CCR5+), conventional Tregs (Treg) and effector T cells (Teff) were sorted directly into PMA /ionomycin (8,000 to 25,000 cells/well) and cytokine secretion was measured by cytometric bead array and expressed as ng/ml per million cells. n=4, Mean±SE, t-test, *p<0.05 CCR5+ vs. Treg, # p<0.05 Teff vs. Treg.

References

    1. Lichtman AH, Binder CJ, Tsimikas S, Witztum JL. Adaptive immunity in atherogenesis: New insights and therapeutic approaches. J Clin Invest. 2013;123:27–36. - PMC - PubMed
    1. Libby P, Lichtman AH, Hansson GK. Immune effector mechanisms implicated in atherosclerosis: From mice to humans. Immunity. 2013;38:1092–1104. - PMC - PubMed
    1. Tse K, Tse H, Sidney J, Sette A, Ley K. T cells in atherosclerosis. International immunology. 2013;25:615–622. - PMC - PubMed
    1. Li J, Ley K. Lymphocyte migration into atherosclerotic plaque. Arterioscler Thromb Vasc Biol. 2015;35:40–49. - PMC - PubMed
    1. Hansson GK, Holm J, Jonasson L. Detection of activated t lymphocytes in the human atherosclerotic plaque. Am J Pathol. 1989;135:169–175. - PMC - PubMed

Publication types

MeSH terms