. 2016 May 23;60(6):3563-78.
doi: 10.1128/AAC.02929-15. Print 2016 Jun.

Hepatitis C Virus Genotype 1 to 6 Protease Inhibitor Escape Variants: In Vitro Selection, Fitness, and Resistance Patterns in the Context of the Infectious Viral Life Cycle

Affiliations

Hepatitis C Virus Genotype 1 to 6 Protease Inhibitor Escape Variants: In Vitro Selection, Fitness, and Resistance Patterns in the Context of the Infectious Viral Life Cycle

Stéphanie B N Serre et al. Antimicrob Agents Chemother. .

Abstract

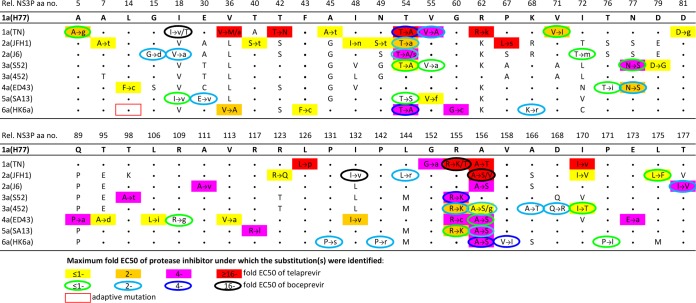
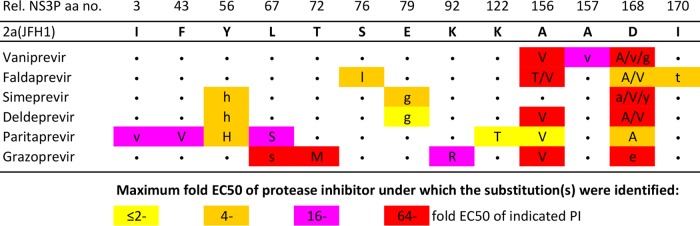
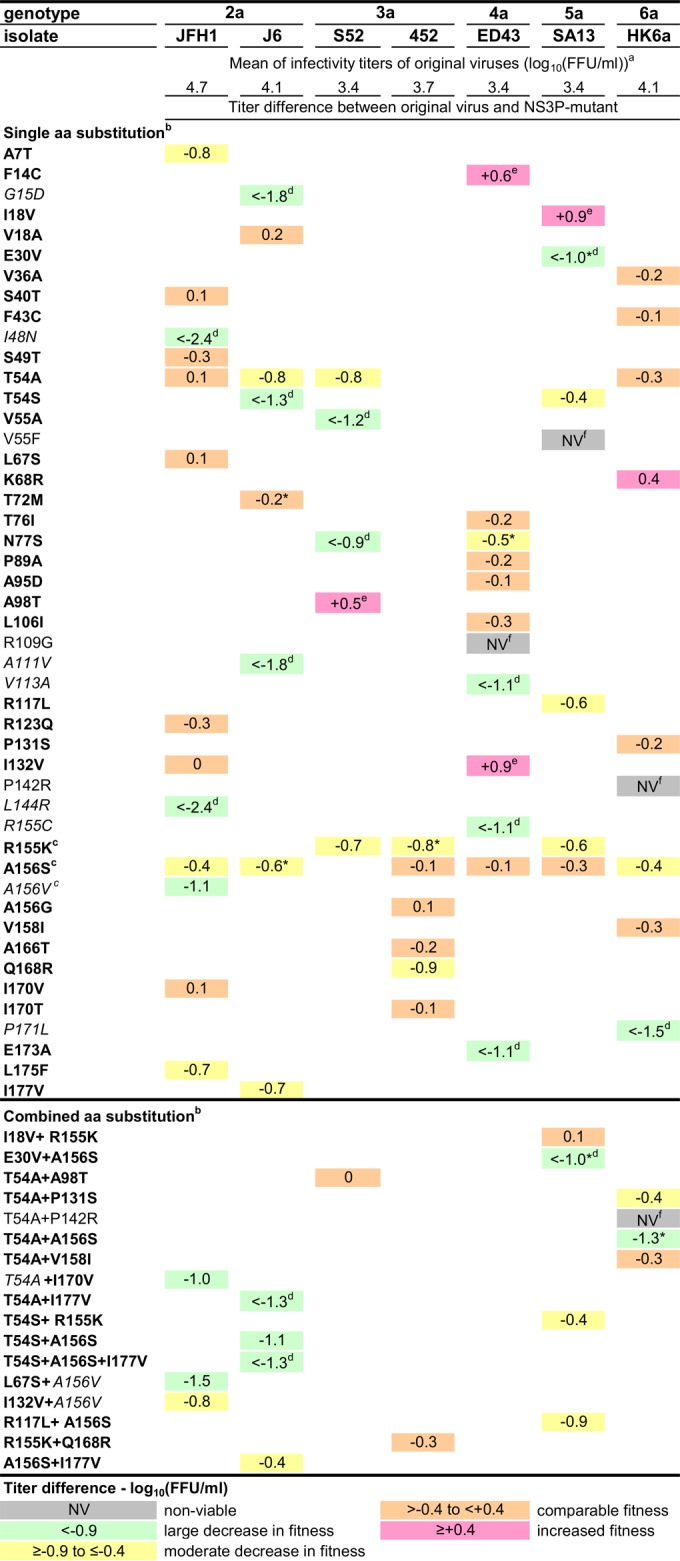
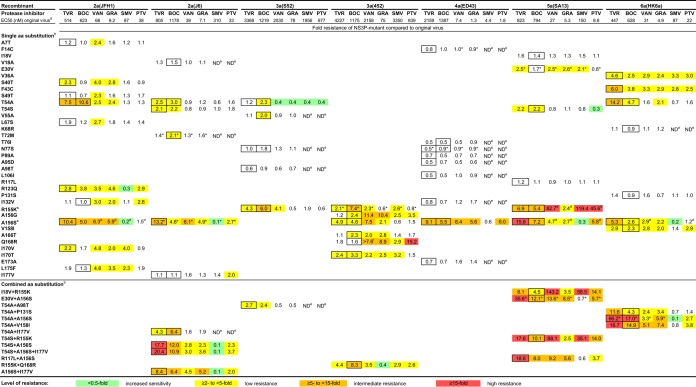
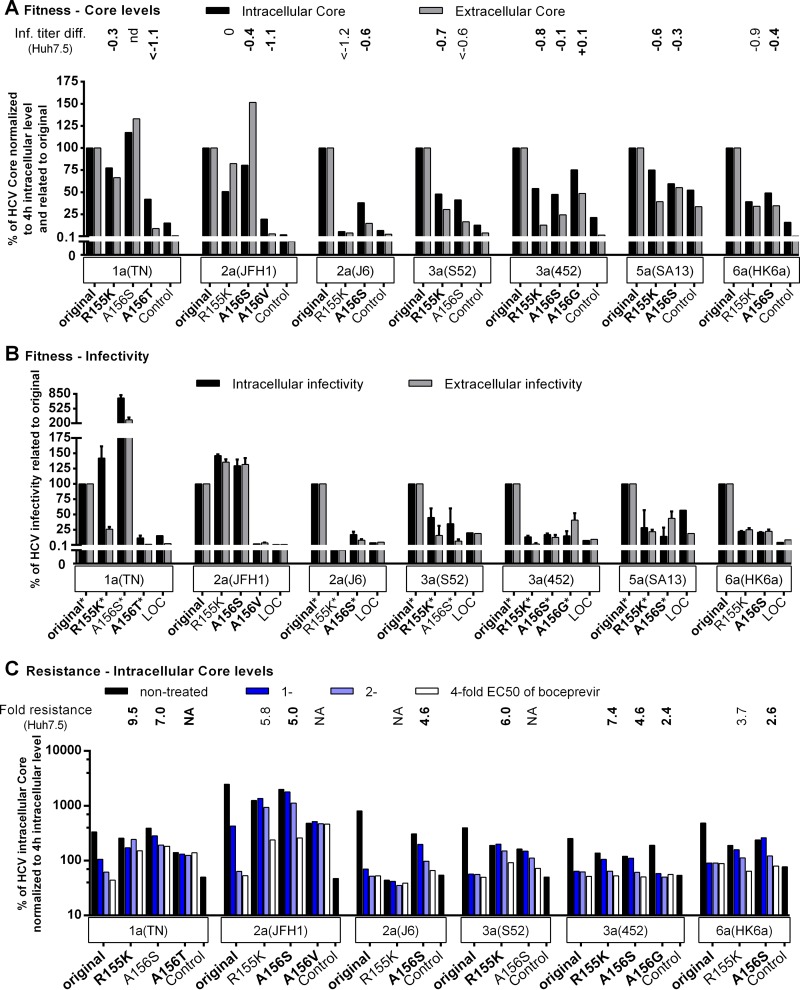
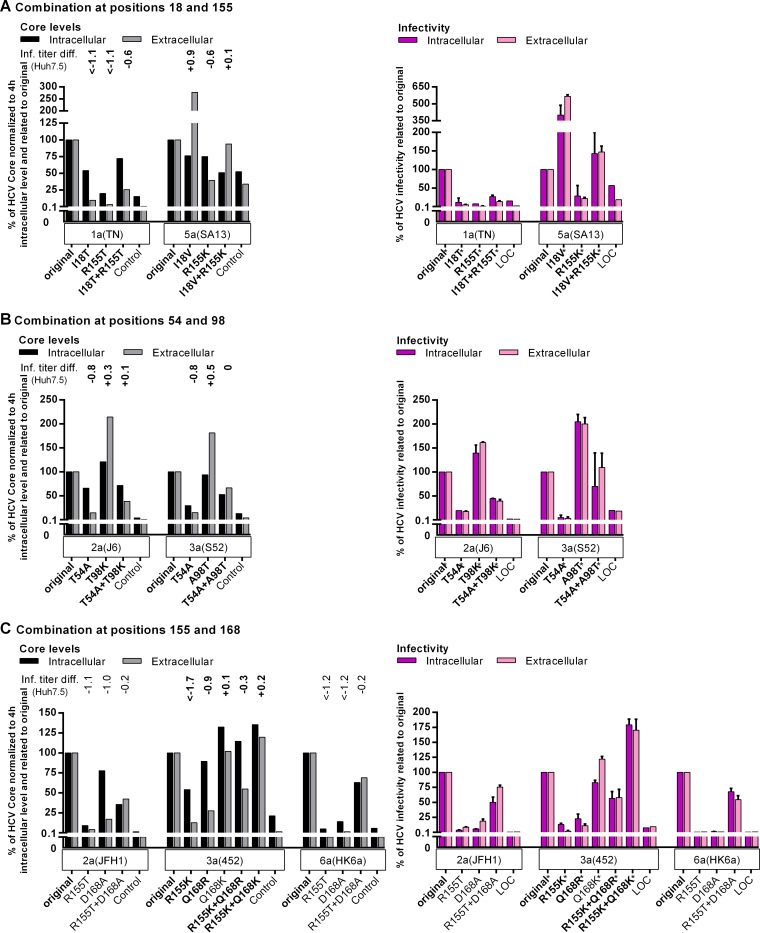
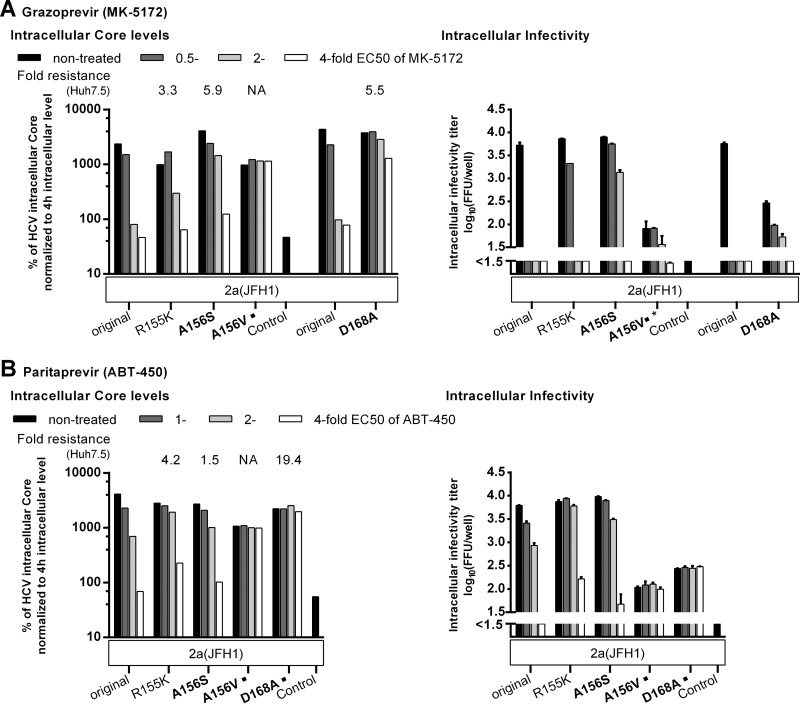
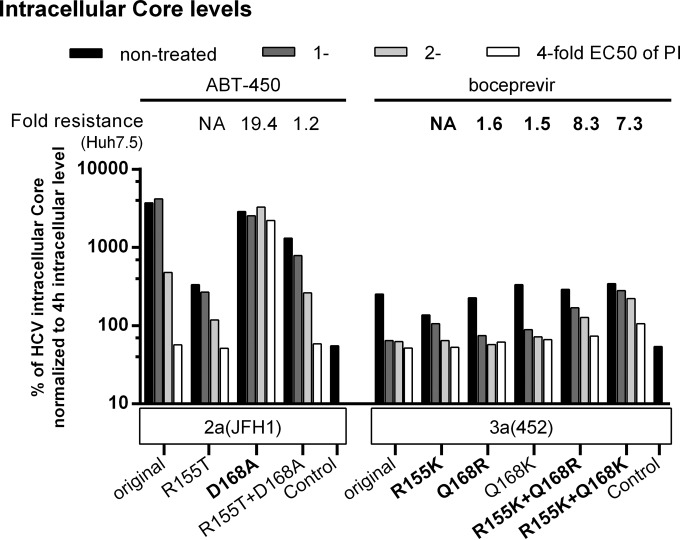
Hepatitis C virus (HCV) NS3 protease inhibitors (PIs) are important components of novel HCV therapy regimens. Studies of PI resistance initially focused on genotype 1. Therefore, knowledge about the determinants of PI resistance for the highly prevalent genotypes 2 to 6 remains limited. Using Huh7.5 cell culture-infectious HCV recombinants with genotype 1 to 6 NS3 protease, we identified protease positions 54, 155, and 156 as hot spots for the selection of resistance substitutions under treatment with the first licensed PIs, telaprevir and boceprevir. Treatment of a genotype 2 isolate with the newer PIs vaniprevir, faldaprevir, simeprevir, grazoprevir, paritaprevir, and deldeprevir identified positions 156 and 168 as hot spots for resistance; the Y56H substitution emerged for three newer PIs. Substitution selection also depended on the specific recombinant. The substitutions identified conferred cross-resistance to several PIs; however, most substitutions selected under telaprevir or boceprevir treatment conferred less resistance to certain newer PIs. In a single-cycle production assay, across genotypes, PI treatment primarily decreased viral replication, which was rescued by PI resistance substitutions. The substitutions identified resulted in differential effects on viral fitness, depending on the original recombinant and the substitution. Across genotypes, fitness impairment induced by resistance substitutions was due primarily to decreased replication. Most combinations of substitutions that were identified increased resistance or fitness. Combinations of resistance substitutions with fitness-compensating substitutions either rescued replication or compensated for decreased replication by increasing assembly. This comprehensive study provides insight into the selection patterns and effects of PI resistance substitutions for HCV genotypes 1 to 6 in the context of the infectious viral life cycle, which is of interest for clinical and virological HCV research.


Figures

FIG 1
FIG 1
Substitutions identified in the NS3Ps of HCV genotype 1 to 6 escape viruses during treatment with telaprevir or boceprevir. Huh7.5 cells were infected with viruses with the NS3P/NS4A of genotype (isolate) 1a (TN), 2a (JFH1 or J6), 3a (S52 or 452), 4a (ED43), 5a (SA13), or 6a (HK6a) (see Fig. S1 in the supplemental material), treated with telaprevir or boceprevir, and followed as described in Materials and Methods and in Fig. S2 in the supplemental material. At the time of viral escape, the NS3Ps of viruses recovered at two different time points were amplified using reverse transcription-PCR and were directly sequenced. NS3P positions at which a substitution for at least one of the viruses treated with telaprevir or boceprevir was identified are shown. Rel. NS3P aa no., NS3 protease amino acid number relative to that in the genotype 1a reference strain H77 (GenBank accession no. AF009606); the H77 amino acid residues are indicated. For each of the viruses studied, a dot indicates that the amino acid residue at the respective position is identical to that in strain H77, and a single letter neither shaded nor circled indicates the amino acid identity at a nonidentical residue. Substitutions occurring at one or more time points under PI treatment are indicated by colored filled rectangles for telaprevir and by colored circle outlines for boceprevir. The color of the rectangle or the circle outline indicates the highest multiple of the EC50 of the PI at which the substitution was identified. The letter to the left of each arrow represents the original amino acid, while the letter(s) to the right indicates the substitution(s) identified in escape variants. Different substitutions identified at the same position are separated by a slash. The substitutions estimated to be present in at least 50% of viral genomes are indicated by capital letters, while substitutions estimated to be present in a minor percentage are indicated by lowercase letters. Substitutions that were also identified in nontreated cultures are not shown. The genotype 6a (isolate HK6a) recombinant contains the cell culture-adaptive substitution V14L (boxed in red). For further details, see Tables S2 to S17 in the supplemental material.
FIG 2
FIG 2
Substitutions identified in the NS3Ps of HCV genotype 2a escape viruses during treatment with newer PIs. Huh7.5 cells were infected with the genotype 2a (isolate JFH1) virus, treated with vaniprevir, faldaprevir, simeprevir, deldeprevir, paritaprevir, or grazoprevir, and followed as described in Materials and Methods and in Fig. S3 in the supplemental material. At the time of viral escape, the NS3Ps of viruses were amplified using reverse transcription-PCR and were directly sequenced. Only NS3P positions at which a substitution was identified for at least one of the PIs are shown. Rel. NS3P aa no., NS3 protease amino acid number relative to that in the genotype 1a reference strain H77 (GenBank accession no. AF009606). The original genotype 2a (isolate JFH1) virus amino acid residues are used as references in this alignment. For each of the PIs studied, a dot indicates that the amino acid residue at the respective position did not change. Substitutions occurring under PI treatment are indicated by colored rectangles. The color of the rectangle indicates the highest multiple of the EC50 of the PI at which the substitution was identified. The letter(s) in each colored rectangle indicates the substitution(s) identified in escape variants, and different substitutions identified at the same position are separated by a slash. The substitutions estimated to be present in at least 50% of viral genomes are indicated by capital letters, while those estimated to be present in a minor percentage of viral genomes are indicated by lowercase letters. Substitutions that were also identified in nontreated cultures are not shown. For further details, see Tables S18 to S23 in the supplemental material.
FIG 3
FIG 3
Fitness and genetic stability of HCV genotype 2 to 6 recombinants with engineered NS3P substitutions identified in escape variants. Huh7.5 cells were transfected with HCV RNA transcripts of the original and variant recombinants. For each variant, the difference in the infectivity titer (expressed as log10 FFU per milliliter) was calculated as described in Materials and Methods. Titer differences are color-coded. First-passage experiments were carried out by infecting naïve Huh7.5 cells with supernatants derived from the peak of infection in transfection experiments. The genetic stability of the engineered recombinants was investigated by direct sequencing of the NS3Ps of viruses in supernatants obtained from the peak of infection of first-passage cultures. Substitutions shown in boldface were maintained, while substitutions shown in italics reverted. a, the means of peak infectivity titers obtained for the original viruses in transfection experiments are given in log10 FFU per milliliter; the standard error of the mean ranged from 0.03 to 0.15. b, the numbering for engineered amino acid substitutions is relative to that for the reference strain H77 (GenBank accession no. AF009606). c, except for genotype 3a (isolate 452) R155K, the fitness and genetic stability of variants with single R155K, A156S, and A156V substitutions have also been reported previously (28). d, the infectivity titer of the variant was <2.3 log10 FFU/ml, the lower cutoff of the assay. e, the NS3P variant reached its peak infectivity titer before the original recombinant. f, recombinants for which no HCV-specific immunostaining was observed for at least 2 weeks posttransfection were considered nonviable in vitro. *, the following additional amino acid substitutions, estimated to be present in at least 50% of viral genomes, were identified in the NS3P sequences of the indicated viruses derived at the peak of infection in first-passage experiments: I177V in genotype 2a (isolate J6) T72M, P86L in genotype 2a (isolate J6) A156S, Q168K in genotype 3a (isolate 452) R155K, N29K and L127M in genotype 4a (isolate ED43) N77S, I17M in genotype 5a (isolate SA13) E30V and in genotype 5a (isolate SA13) E30V plus A156S, and A116P in genotype 6a (isolate HK6a) T54A plus A156S.
FIG 4
FIG 4
Levels of resistance of HCV genotype 2 to 6 recombinants with engineered NS3P substitutions to telaprevir (TVR), boceprevir (BOC), vaniprevir (VAN), grazoprevir (GRA), simeprevir (SMV), and paritaprevir (PTV). The level of resistance is expressed as the fold change in the EC50, which was calculated by comparing the EC50 of a variant to the EC50 of the original virus of the same genotype and isolate, as described in Materials and Methods. Fold resistance values are color-coded. The substitutions tested were selected under treatment with TVR and/or BOC; a boxed value indicates under which of these two PIs a particular amino acid substitution was selected. a, the indicated mean EC50 values (expressed as nanomolar concentrations) were determined previously for each original recombinant (28), and similar EC50 values were obtained for the original viruses in the current study. b, the numbering for engineered amino acid substitutions is relative to that for the reference strain H77 (GenBank accession no. AF009606). c, except for genotype 3a (isolate 452) R155K, the fold resistance of R155K and A156S variants has been determined previously (28) and is in agreement with the values obtained in the current study. d, the fold resistance was obtained from reference . e, ND, not determined. Resistance to simeprevir and paritaprevir was determined only for substitutions that either (i) conferred ≥2-fold resistance to vaniprevir and/or grazoprevir as single substitutions, (ii) conferred ≥2-fold resistance to vaniprevir and/or grazoprevir in combination with other NS3P substitutions, or (iii) were identified at position 54, 155, or 156. f, the indicated variant was <50% inhibited by the highest concentration of vaniprevir applied (15,000 nM). Asterisks indicate the following additional substitutions in NS3P acquired by the indicated first-passage stocks: I177V in genotype 2a (isolate J6) T72M, P86L in genotype 2a (isolate J6) A156S, Q168K in genotype 3a (isolate 452) R155K, N29K and L127M in genotype 4a (isolate ED43) N77S, I17M in genotype 5a (isolate SA13) E30V and in genotype 5a (isolate SA13) E30V plus A156S, and A116P in genotype 6a (isolate HK6a) T54A plus A156S. Similarly, the genotype 4a (isolate ED43) F14C second-passage stock acquired G90A.
FIG 5
FIG 5
Fitness impairment and PI resistance associated with key resistance substitutions at NS3P positions 155 and 156 affected viral replication across genotypes. RNA transcripts from the indicated genotype 1a (isolate TN), 2a (isolates JFH1 and J6), 3a (isolates S52 and 452), 5a (isolate SA13), and 6a (isolate HK6a) HCV recombinants were transfected into S29 cells. (A and B) For nontreated replicates, IC and EC core concentrations (A) and infectivity titers (B) were determined as described in Materials and Methods. (C) For the replicates treated 4 h posttransfection with boceprevir at the indicated multiple of the EC50, only the IC core concentration is shown. The corresponding IC and EC infectivity titers and the EC core concentration obtained under treatment are shown in Fig. S4 in the supplemental material. The low levels of replication of genotype 4a (isolate ED43) and genotype 5a (isolate SA13) recombinants in S29 cells have prevented or limited their use in this assay. To account for possible differences in transfection efficiency, IC and EC core concentrations at 48 h were normalized to IC core concentrations at 4 h (A and C). To determine the effects of the indicated NS3P substitutions on viral fitness, the normalized core values (A) and infectivity titers (B) of variant recombinants were related to the values for the respective original recombinants (original). In panels A and C, “Control” indicates the replication-deficient genotype 2a (isolate JFH1) negative-control virus with the mutation of the NS5B RNA polymerase active site (GlyAspAsp to GlyAsnAsp [GND]) (20), which was included in each transfection experiment. For this control, IC core concentrations at 48 h ranged from 9.4 × 10³ to 25.0 × 10³ fmol/liter, and EC core concentrations at 48 h ranged from 17.5 to 131.8 fmol/liter. The values shown for the control were normalized to the IC core concentrations at 4 h. In panel A, the values were also related to those obtained for the respective original recombinants (original) as was described for the NS3P variants. Transfections of recombinants of the same genotype (isolate) shown in the same graph were carried out in the same experiment; each of these experiments included the genotype 2a (isolate JFH1) GND negative-control virus. In panel B, LOC indicates the lower cutoff of the infectivity titration assay. For automated counting of FFU, the LOCs for IC and EC infectivity titers were 1.5 log10 FFU/well and 2.3 log10 FFU/ml, respectively. In instances where low replication efficiency in S29 cells precluded automated counting, FFU were counted manually, and the resulting titers are indicated by asterisks. The LOC for infectivity titers derived from manually counted FFUs was 0.9 log10 FFU/well for IC titers and 1.6 log10 FFU/ml for EC titers. LOC values were related to the values obtained for the respective original recombinants (original) as described for NS3P variants. The NS3P substitutions in boldface were specifically selected in the indicated virus under PI treatment in this study (Fig. 1 and 2). For comparison, the difference in the infectivity titer (Inf. titer diff.) observed following transfection of Huh7.5 cells (A) or the fold resistance to boceprevir (C) is indicated above each variant. Differences in infectivity titers and fold resistance were calculated as described in Materials and Methods. Values determined in this study (Fig. 3 and 4) are indicated in boldface; other values either were reported previously (28) or were calculated on the basis of infectivity titers determined in reference . The infectivity titer of genotype 1a (isolate TN) A156S was not determined, preventing calculation of the titer difference in Huh7.5 cells (nd, not determined). Instances in which fold resistance values could not be determined because the specified recombinant could not be grown in Huh7.5 cells (Fig. 3) (28) are indicated by NA (not applicable).
FIG 6
FIG 6
Substitutions compensating for fitness impairment acted at different steps of the viral life cycle. The effects of combinations of substitutions at positions 18 and 155 (A), positions 54 and 98 (B), and positions 155 and 168 (C) on the HCV life cycle were studied by transfection of RNA transcripts from the indicated recombinants into S29 cells, followed by the determination of IC and EC core concentrations and infectivity titers as described in Materials and Methods. To account for possible differences in transfection efficiency, IC and EC core concentrations at 48 h were normalized to IC core concentrations at 4 h. To determine the effects of the indicated NS3P substitutions on viral fitness, normalized core values and infectivity titers of variant recombinants were related to the values of the respective original recombinants (original). Transfections of recombinants of the same genotype (isolate) were carried out in the same experiment. “Control” indicates the replication-deficient genotype 2a (isolate JFH1) GND negative-control virus. For this control, IC core concentrations at 48 h ranged from 9.4 × 10³ to 25.0 × 10³ fmol/liter, and EC core concentrations at 48 h ranged from 17.5 to 131.8 fmol/liter. The values shown for the control were normalized to the IC core concentrations at 4 h and were related to the values obtained for the respective original recombinants (original) as described for the NS3P variants. LOC indicates the lower cutoff of the infectivity titration assay. For automated counting of FFU, the LOCs for IC and EC infectivity titers were 1.5 log10 FFU/well and 2.3 log10 FFU/ml, respectively. In instances where low replication efficiency in S29 cells precluded automated counting, FFU were counted manually, and the resulting titers are indicated by asterisks. The LOCs for infectivity titers derived from manually counted FFU were 0.9 log10 FFU/well for IC titers and 1.6 log10 FFU/ml for EC titers. LOC values were related to the values obtained for the respective original recombinants (original) as described for NS3P variants. The NS3P substitutions in boldface were specifically selected in the indicated virus under PI treatment in the current study (Fig. 1; see also Tables S4, S5, S12, S14, and S16 in the supplemental material). For comparison, titer differences (Inf. titer diff.) observed following transfection of Huh7.5 cells are indicated above each variant. Titer differences were calculated as described in Materials and Methods. With some exceptions, titer differences were calculated using the titers determined in this study (Fig. 3) and are indicated in boldface. Titer differences for the genotype 2a (isolate JFH1) and genotype 6a (isolate HK6a) recombinants in panel C were calculated from infectivity titers determined in reference . For the genotype 3a (isolate 452) R155K recombinant, the titer difference was calculated on the basis of infectivity titers obtained from a transfection other than that for Fig. 3. The higher titer difference observed in this transfection might be due to slower acquisition of a compensatory NS3P substitution by the genotype 3a (isolate 452) R155K recombinant in this transfection or to reversion of the R155K substitution, as observed previously (28). The results obtained for genotype 1a (isolate TN) with V36M and R155K, previously suggested as a combination with compensatory effects, are shown in Fig. S5 in the supplemental material.
FIG 7
FIG 7
Key resistance substitutions at NS3P positions 155, 156 and 168 rescued the replication of genotype 2a (isolate JFH1) under treatment with newer PIs. RNA transcripts from the indicated genotype 2a (isolate JFH1) recombinants were transfected into S29 cells, and 4 h later, cultures were treated with the indicated concentrations of grazoprevir (MK-5172) (A) or paritaprevir (ABT-450) (B). IC core concentrations and infectivity titers were determined as described in Materials and Methods. To account for possible differences in transfection efficiency, IC core concentrations at 48 h were normalized to IC core concentrations at 4 h. The EC core concentrations and infectivity titers determined in these experiments are shown in Fig. S6 in the supplemental material. Transfections of recombinants treated with paritaprevir were carried out in the same experiment. Transfections of recombinants treated with grazoprevir were carried out in two different experiments. For each experiment, the original genotype 2a (isolate JFH1) recombinant was included. “Control” indicates the replication-deficient genotype 2a (isolate JFH1) GND negative-control virus. For this control, IC core concentrations at 48 h ranged from 9.4 × 10³ to 25.0 × 10³ fmol/liter. The values shown were normalized to 4-h IC core values as described for the NS3P variants. The break in the y axis indicates the lower cutoff (LOC) of the infectivity titration assay. For automated counting of FFU, the LOC for IC infectivity titers was 1.5 log10 FFU/well. For genotype 2a (isolate JFH1) A156V treated with grazoprevir, low replication efficiency in S29 cells precluded automated counting. FFU were counted manually, and the resulting titers are indicated by an asterisk. The LOC for IC infectivity titers derived from manually counted FFU was 0.9 log10 FFU/well. NS3P substitutions in boldface were specifically selected in the indicated virus under PI treatment in the current study. ■, the substitution was identified in escape variants emerging under treatment with the newer PIs (Fig. 2). For comparison, the fold resistance to grazoprevir (A) or paritaprevir (B) as determined in Huh7.5 cells (28) is indicated above each variant. Instances in which the fold resistance values could not be determined because the specified recombinant could not be grown in Huh7.5 cells (Fig. 3) (28) are indicated by NA (not applicable).
FIG 8
FIG 8
Combinations of substitutions at positions 155 and 168 increased viral fitness but not PI resistance. RNA transcripts from the indicated genotype 2a (isolate JFH1) and genotype 3a (isolate 452) recombinants were transfected into S29 cells. Four hours later, cultures were treated with the indicated concentrations of paritaprevir (ABT-450) or boceprevir. IC core concentrations were determined as described in Materials and Methods. To account for possible differences in transfection efficiency, IC core concentrations at 48 h were normalized to IC core concentrations at 4 h. The IC and EC infectivity titers and EC core levels determined in these experiments are shown in Fig. S7 in the supplemental material. Transfections of recombinants of the same genotype (isolate) were carried out in the same experiment. “Control” indicates the replication-deficient genotype 2a (isolate JFH1) GND negative-control virus. For this control, IC core concentrations at 48 h ranged from 9.4 × 10³ to 25.0 × 10³ fmol/liter. The values shown were normalized to 4-h IC core values as described for NS3P variants. The NS3P substitutions in boldface were specifically selected in the indicated virus under treatment with the indicated PI. For comparison, the fold resistance to paritaprevir or boceprevir, as determined in Huh7.5 cells, is indicated above each variant. The fold resistance values were calculated as described in Materials and Methods. Values for boceprevir determined in this study (Fig. 4) are indicated in boldface; values for paritaprevir were reported previously (28). NA (not applicable) indicates that for single R155T and R155K variants, fold resistance values in Huh7.5 cells could not be determined, because introduction of these single substitutions led to the acquisition of additional substitutions at position 168 in first-passage virus stocks used for treatment experiments (Fig. 3) (28).

Similar articles

Cited by

References

    1. Hajarizadeh B, Grebely J, Dore GJ. 2013. Epidemiology and natural history of HCV infection. Nat Rev Gastroenterol Hepatol 10:553–562. doi: 10.1038/nrgastro.2013.107. - DOI - PubMed
    1. Gower E, Estes C, Blach S, Razavi-Shearer K, Razavi H. 2014. Global epidemiology and genotype distribution of the hepatitis C virus infection. J Hepatol 61:S45–S57. doi: 10.1016/j.jhep.2014.07.027. - DOI - PubMed
    1. Smith DB, Bukh J, Kuiken C, Muerhoff AS, Rice CM, Stapleton JT, Simmonds P. 2014. Expanded classification of hepatitis C virus into 7 genotypes and 67 subtypes: updated criteria and genotype assignment web resource. Hepatology 59:318–327. doi: 10.1002/hep.26744. - DOI - PMC - PubMed
    1. Sarrazin C. 2016. The importance of resistance to direct antiviral drugs in HCV infection in clinical practice. J Hepatol 64:486–504. doi: 10.1016/j.jhep.2015.09.011. - DOI - PubMed
    1. Pawlotsky JM. 2015. Hepatitis C treatment: the data flood goes on—an update from the liver meeting 2014. Gastroenterology 148:468–479. doi: 10.1053/j.gastro.2015.01.002. - DOI - PubMed

Publication types

MeSH terms