. 2016 Mar 29:7:11150.
doi: 10.1038/ncomms11150.

Exosomal transfer of stroma-derived miR21 confers paclitaxel resistance in ovarian cancer cells through targeting APAF1

Affiliations

Exosomal transfer of stroma-derived miR21 confers paclitaxel resistance in ovarian cancer cells through targeting APAF1

Chi Lam Au Yeung et al. Nat Commun. .

Abstract

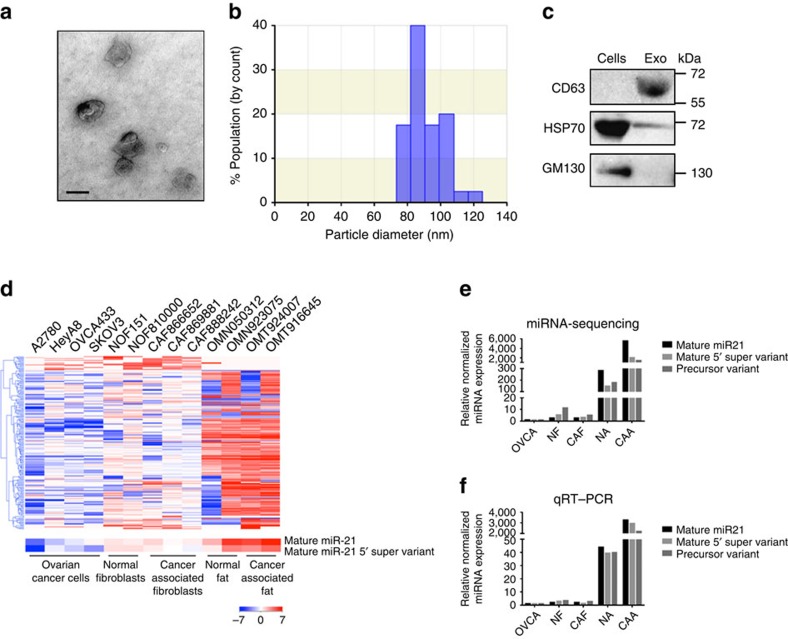
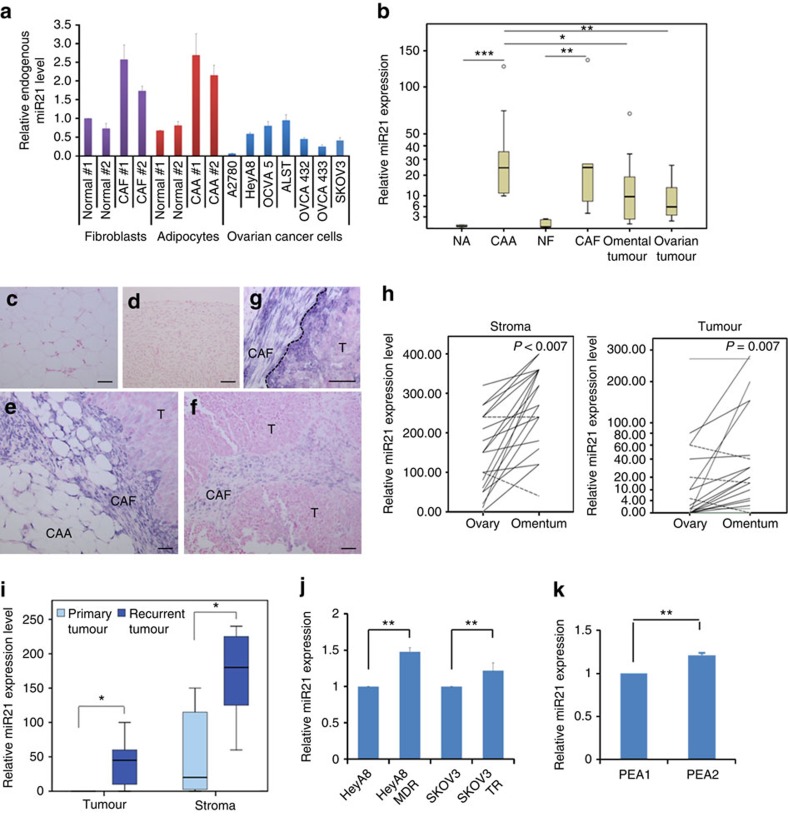
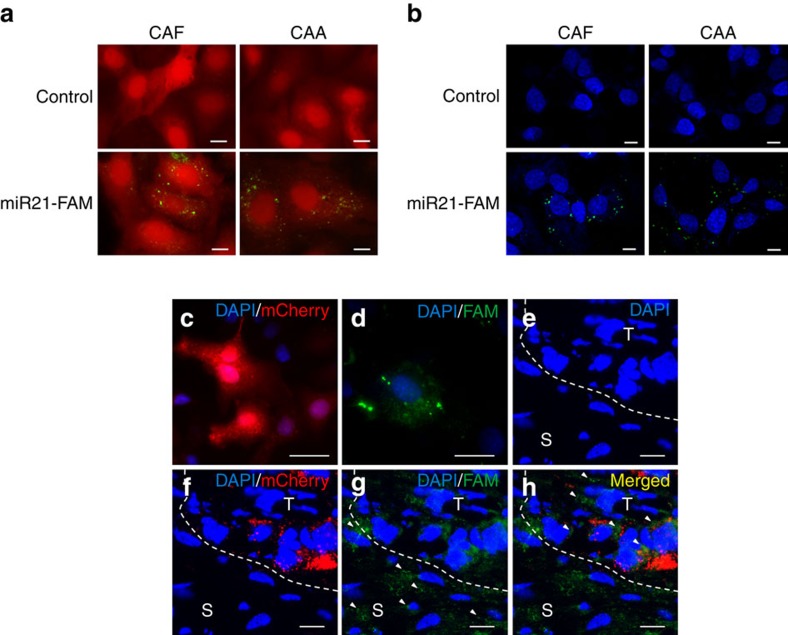
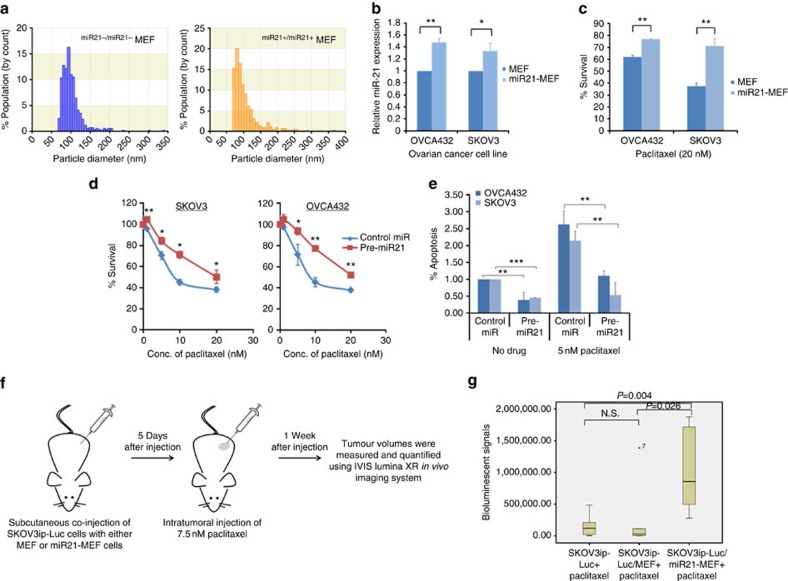
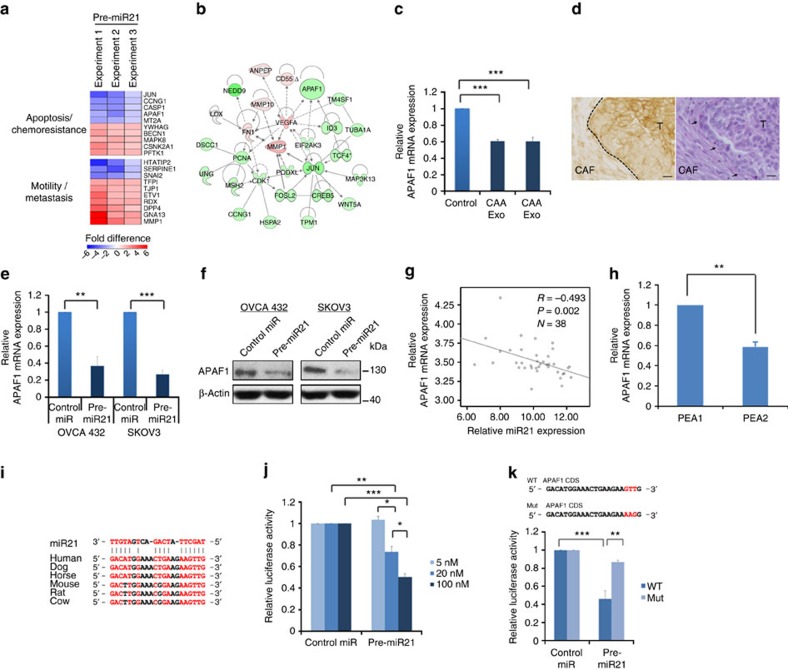
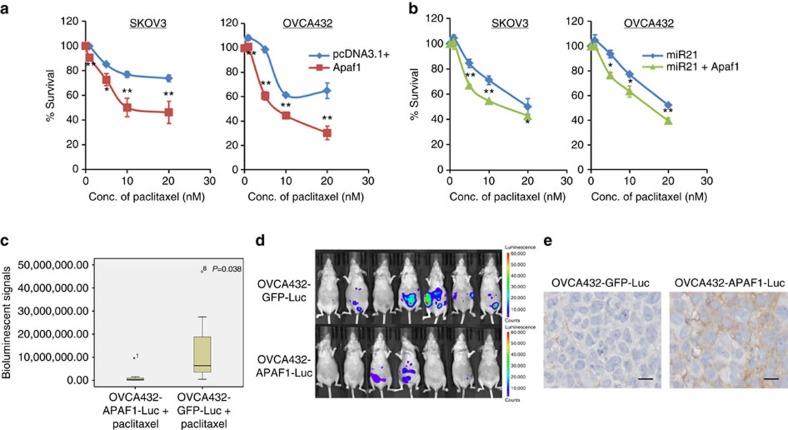
Advanced ovarian cancer usually spreads to the visceral adipose tissue of the omentum. However, the omental stromal cell-derived molecular determinants that modulate ovarian cancer growth have not been characterized. Here, using next-generation sequencing technology, we identify significantly higher levels of microRNA-21 (miR21) isomiRNAs in exosomes and tissue lysates isolated from cancer-associated adipocytes (CAAs) and fibroblasts (CAFs) than in those from ovarian cancer cells. Functional studies reveal that miR21 is transferred from CAAs or CAFs to the cancer cells, where it suppresses ovarian cancer apoptosis and confers chemoresistance by binding to its direct novel target, APAF1. These data suggest that the malignant phenotype of metastatic ovarian cancer cells can be altered by miR21 delivered by exosomes derived from neighbouring stromal cells in the omental tumour microenvironment, and that inhibiting the transfer of stromal-derived miR21 is an alternative modality in the treatment of metastatic and recurrent ovarian cancer.


Figures

Figure 1
Figure 1. Increased miR21 expression in exosomes isolated from CAAs.
(a) Electron micrograph showing whole-mount exosomes isolated from CAA-conditioned medium. Scale bar, 100 nm. (b) Histogram showing the particle diameter (nm) of the population of small vesicles collected from CAA-conditioned medium using the standard exosome isolation method of ultracentrifugation and quantified using qNano. The amount of exosomes secreted into the conditioned media was normalized with the number of cells in the culture for conditioned media collection. The amount of miR-21 in the exosomes was then normalized with the input amount of RNA for reverse transcription and the subsequent qRT–PCR analysis, to determine the relative miR-21 expression level in exosomes. (c) Western blot analysis showing exosome marker CD63 in the exosome-enriched conditioned medium but not in the cell lysate. In contrast, cis-Golgi matrix protein (GM130) was only observed in the cell lysate and not in the exosome fraction. Another exosome marker, 70-kDa heat shock protein (HSP70), was also observed in the exosomes. (d) The heat map showing the relative expression of small RNAs in exosomes isolated from ovarian cancer cell lines (n=4), normal ovarian fibroblasts (n=2), CAFs (n=3), normal adipocytes (n=2) and CAAs (n=2). (e,f) Relative normalized expression of mature 5′, mature 5′ super variant and precursor variant of miR21 in exosomes isolated from ovarian cancer cell lines (n=4), normal ovarian fibroblasts (n=2), CAFs (n=3), normal adipocytes (n=2) and CAAs (n=2) examined using miRNA-sequencing (e) and qRT–PCR (f) analyses.
Figure 2
Figure 2. Differential miR21 expression in ovarian tumour tissue and cancer cell lines.
(a) qRT–PCR analysis of miR21 expression in cultured normal ovarian fibroblasts, CAFs, normal adipocytes, CAAs and ovarian cancer cell lines. (b) qRT–PCR analysis of miR21 expression in microdissected normal adipocytes (n=5), CAAs (n=9), normal fibroblasts (n=5), CAFs (n=5) and ovarian cancer cells from omental (n=10) and primary ovarian sites (n=10). ***P<0.001, **P<0.01 and *P<0.05; Mann–Whitney U-test. (cg) In situ hybridization of miR21 in (c) normal omental adipocytes, (d) normal ovarian tissue and (e) omental and (f) primary ovarian sites of ovarian carcinoma. Strong miR21 staining in omental cancer cells was observed at the tumour–stroma interface (g; dashed line). Digoxigenin-labelled miR21 probes were detected using anti-digoxigenin-alkaline phosphatase and visualized as dark blue nitro-blue tetrazolium and 5-bromo-4-chloro-3′-indolyphosphate precipitate. Sections were counterstained with Nuclear Fast Red. CAAs, cancer-associated adipocytes; CAFs, cancer-associated fibroblasts; T, tumour. Scale bar, 50 μm. (h) Pair-wise comparisons of miR21 expression in omental and primary ovarian tumour sites from stromal (n=20; P<0.000; Wilcoxon signed-rank test) and epithelial (n=19; P=0.007; Wilcoxon signed-rank test) components of advanced-stage ovarian cancer cells. Relative miR21 expression was measured by in situ hybridization; each line represents the expression level in the same patient. The solid lines indicate higher miR21 expression in the omental site than in the primary ovarian site; the dashed lines represent lower expression in the omental site. (i) Box plot showing miR21 expression in stromal (n=14) and epithelial (n=14) components of primary and recurrent omental ovarian tumour tissue, as quantified by in situ hybridization analyses. **P<0.01; Mann–Whitney U-test. (j) qRT–PCR of miR21 expression in ovarian cancer HeyA8 and SKOV3 cells and their paclitaxel-resistant sublines HeyA8-MDR and SKOV3-TR. The results were the average from at least three separate experiments. Mean±s.d.; **P<0.01; two-tailed Student's t-test. (k) qRT–PCR of miR21 expression in the primary PEA1 tumour cells and the cell line established after cisplatin treatment (PEA2). The results were the average from at least three separate experiments. Mean±s.d.; **P<0.01; two-tailed Student's t-test.
Figure 3
Figure 3. Exosomal transfer of miR21 from adipocytes and fibroblasts to ovarian cancer cells.
(a) CAAs and CAFs transiently transfected with FAM-tagged miR21 (miR21-FAM) or without transfection (Control) were co-cultured with mCherry-labelled ovarian cancer SKOV3ip cells for 24 h. Fluorescence microscopy was used to detect the green and red fluorescent signals in SKOV3ip cells. Scale bar, 2 μm. (b) Exosomes were isolated from conditioned media prepared from CAAs and CAFs transfected with FAM-labelled miR21 (miR21-FAM) or without transfection (Control) and added to ovarian cancer SKOV3ip cell cultures. SKOV3ip cells were fixed and the nuclei were stained with 4,6-diamidino-2-phenylindole (DAPI) blue. An SP5 confocal microscope was used to detect the green signals in SKOV3ip cells. Scale bar, 2 μm. (ch) Red mCherry-labelled ovarian cancer SKOV3ip cells (c) were injected subcutaneously into nude mice, to establish tumours. After 1 week, miR21−/miR21−MEFs transfected with FAM-tagged miR21 (d) were injected intratumorally. After 24 h, tumours were harvested and frozen sections were prepared. A confocal microscopy analysis showed the blue DAPI signals for the nuclei of the two cell types (e), the red mCherry signals for the SKOV3ip cells (f) and the green FAM signals for miR21 (g). Arrowheads indicate the FAM-miR21 signals in the peripheral stromal cells (S) and in some of the red cancer cells (T) (g,h). Scale bar, 5 μm.
Figure 4
Figure 4. MiR21 enhances ovarian cancer cell chemoresistance and decreases apoptosis in ovarian cancer cells.
(a) qNano analyses of exosomes isolated from miR21−/miR21−MEFs and miR21+/miR21+MEFs. A majority of the purified exosomes were <100 nm in diameter. (b) qRT–PCR analysis showing a significant increase in miR21 in SKOV3 and OVCA432 cells treated with miR21+/miR21+MEF exosomes compared with those treated with miR21−/miR21−MEF exosomes. The results were the average from at least three independent experiments. Mean±s.d.; **P<0.01 and *P<0.05; two-tailed Student's t-test. (c) Bar charts showing a significant decrease in cell number in SKOV3 and OVCA432 cells treated with miR21−/miR21−MEF exosomes compared with those treated with miR21+/miR21+MEF exosomes in the presence of 20 nM paclitaxel. The results were the average from at least three independent experiments. Mean±s.d.; **P<0.01; two-tailed Student's t-test. Effect of miR21 overexpression on (d) paclitaxel sensitivity and (e) paclitaxel-induced apoptosis in OVCA432 and SKOV3 ovarian cancer cells. After being transfected with miR21 precursor (pre-miR21) or negative control (control miR), the cells were incubated with paclitaxel for 3 days. Cell survival and apoptosis were measured by MTT assay and Cell Death Detection ELISA, respectively. The results were the average from at least three independent experiments. Mean±s.d.; ***P<0.001, **P<0.01 and *P<0.05; two-tailed Student's t-test. (f) A schematic diagram showing the use of the in vivo model to evaluate the effects of CAFs on the paclitaxel sensitivity of cancer cells. (g) Luciferase-labelled SKOV3ip ovarian cancer cells and miR21+/miR21+MEF (miR21-MEF) or miR21−/miR21−MEF (MEF) cells, or SKOV3ip cells alone were subcutaneously injected into female BALB/c athymic nude mice, to establish tumours. The tumour volumes were measured and quantified using the IVIS-Lumina XR in vivo imaging system after a 7-day intratumoral paclitaxel treatment. A box plot showing a significant decrease in luciferase activity in the miR21-MEF group (n=6) compared with the MEF group (n=6) after paclitaxel treatment (P=0.026; Mann–Whitney U-test) or the cancer cells alone group (n=6) after paclitaxel treatment (P=0.004; Mann–Whitney U-test). NS, not significant (P>0.05; Mann–Whitney U-test).
Figure 5
Figure 5. APAF1 is a miR21 direct target in ovarian cancer cells.
(a) Transcriptome profiling of SKOV3 cells transfected with miR21 precursor or control miR. A heatmap shows the top 10 miR21 regulated genes related to chemoresistance and metastasis. (b) Pathway analysis showing chemoresistance-related genes that were upregulated (red) or downregulated (green) in miR21-transfected SKOV3 cells. (c) SKOV3 cells incubated with CAA- and CAF-derived exosomes showed lower APAF1 expression than did controls. The results were the average from at least three independent experiments. Mean±s.d.; ***P<0.001; two-tailed Student's t-test. (d) Immunolocalization of APAF1 on ovarian tumour tissue sections (n=5) demonstrated lower APAF1 level in the stromal–epithelial interface compared with that in the centre of the tumour tissues. A representative serial section of the tumour tissue was stained with haematoxylin and eosin (right panel). Dotted line and arrowheads indicate the stromal–epithelial interface between CAF and tumour (T). Scale bar, 10 μm. (e,f) Ovarian cancer cells transfected with miR21 precursor had lower APAF1 mRNA and protein levels than did controls. The results were the average from at least three independent experiments. Mean±s.d.; ***P<0.001 and **P<0.01; two-tailed Student's t-test. (g) The correlation between miR21 and APAF1 mRNA levels in microdissected ovarian cancer tissues was determined using a Spearman's correlation analysis. (h) Recurrent ovarian cancer PEA2 cells expressed lower APAF1 expression than did primary PEA1 cells. The results were the average from at least three independent experiments. Mean±s.d.; **P<0.01; two-tailed Student's t-test. (i) A consensus miR21-binding site was identified within the coding sequence of APAF1. (j) Co-transfection of pre-miR21 and luciferase vector with APAF1 coding sequence decreased the luciferase expression in SKOV3 cells in a dose-dependent manner. The results were the average from at least three independent experiments. Mean±s.d.; ***P<0.001, **P<0.01 and *P<0.05; two-tailed Student's t-test. (k) The luciferase activity was measured following co-transfection with either wild-type (WT) or mutated (Mut) APAF1 coding sequence vectors (mutated sequence shown in red in upper panel). The results were the average from at least three independent experiments. Mean±s.d.; ***P<0.001 and **P<0.01; two-tailed Student's t-test.
Figure 6
Figure 6. APAF1 mediates miR21-induced paclitaxel resistance.
(a) Overexpression of APAF1 by full-length transfection increased paclitaxel sensitivity in ovarian cancer SKOV3 and OVCA432 cells. The results were the average from at least three independent experiments. Mean±s.d.; **P<0.01 and *P<0.05; two-tailed Student's t-test. (b) Co-transfection of miR21 precursor and full-length APAF1 decreased paclitaxel resistance compared with the co-transfection of pre-miR21 and the control vector in both SKOV3 and OVCA432 cells. The results were the average from at least three independent experiments. Mean±s.d.; **P<0.01 and *P<0.05; two-tailed Student's t-test. (ce) APAF1 overexpression enhanced the paclitaxel sensitivity of ovarian cancer cells in vivo. APAF1 stably overexpressing ovarian cancer OVCA432 cells were generated using the lentiviral transduction method and were intraperitoneally injected into female BALB/c athymic nude mice, followed by paclitaxel treatment. The tumour volumes were measured and quantified using the IVIS-Lumina XR in vivo imaging system after a 2-week 5 mg kg−1 paclitaxel treatment. (c) Box plot showing a significant decrease in luciferase activity in the APAF1 overexpression group (n=7) compared with the control group (n=7) after paclitaxel treatment (P=0.038; Mann–Whitney U-test). (d) Representative images show a decrease in luminescence in the APAF1 overexpression group compared with the control group after paclitaxel treatment. (e) Immunolocalization of APAF1 on paraffinized sections of tumour tissues collected from mice demonstrated a higher APAF1 level in the APAF1 overexpression group (n=7) compared with the control group (n=7). Representative microscopic images were illustrated. Scale bar, 10 μm.

References

    1. Siegel R., Miller K. & Jemal A. Cancer statistics, 2015. CA Cancer J. Clin. 65, 5–29 (2015). - PubMed
    1. Tlsty T. D. & Coussens L. M. Tumor stroma and regulation of cancer development. Annu. Rev. Pathol. 1, 119–150 (2006). - PubMed
    1. Simons M. & Raposo G. Exosomes--vesicular carriers for intercellular communication. Curr. Opin. Cell Biol. 21, 575–581 (2009). - PubMed
    1. Cocucci E., Racchetti G. & Meldolesi J. Shedding microvesicles: artefacts no more. Trends Cell Biol. 19, 43–51 (2009). - PubMed
    1. Hong B. S. et al. Colorectal cancer cell-derived microvesicles are enriched in cell cycle-related mRNAs that promote proliferation of endothelial cells. BMC Genomics 10, 556 (2009). - PMC - PubMed

Publication types

MeSH terms