. 2016 Mar 29:6:23373.
doi: 10.1038/srep23373.

Transcriptome profile of the early stages of breast cancer tumoral spheroids

Affiliations

Transcriptome profile of the early stages of breast cancer tumoral spheroids

Rosario Pacheco-Marín et al. Sci Rep. .

Abstract

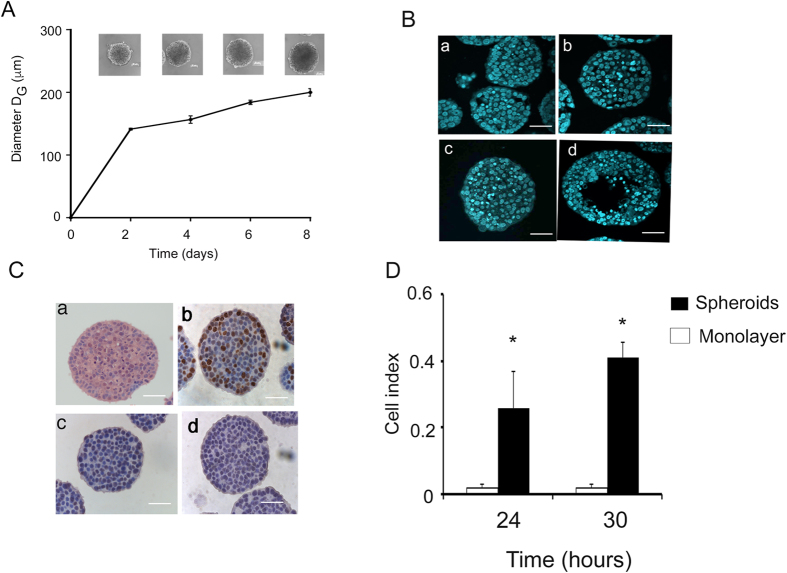
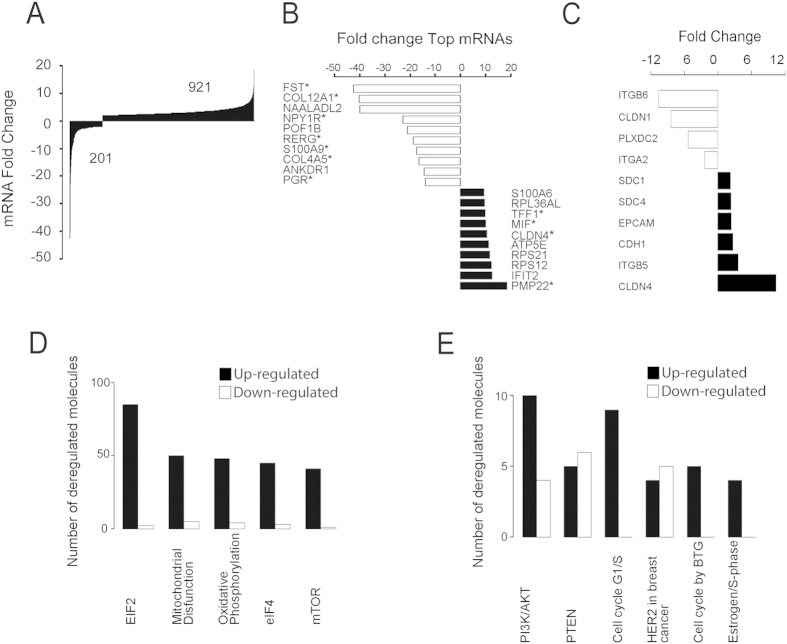
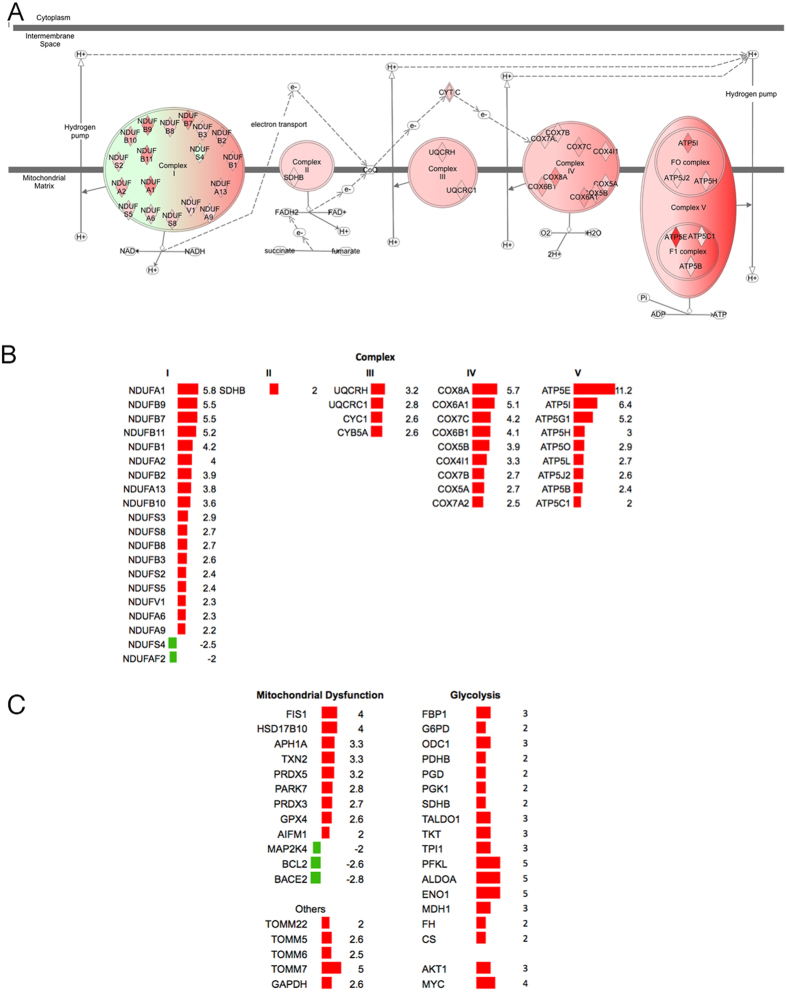
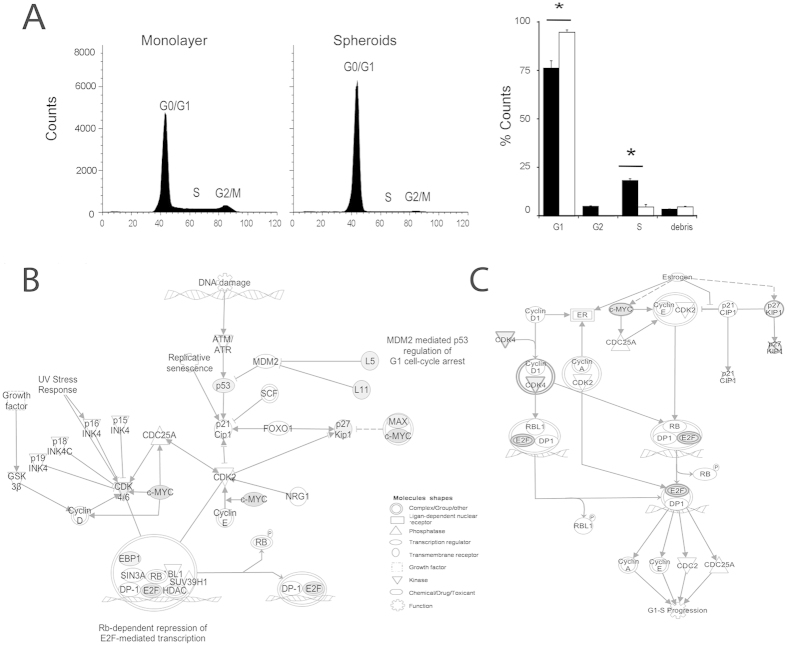
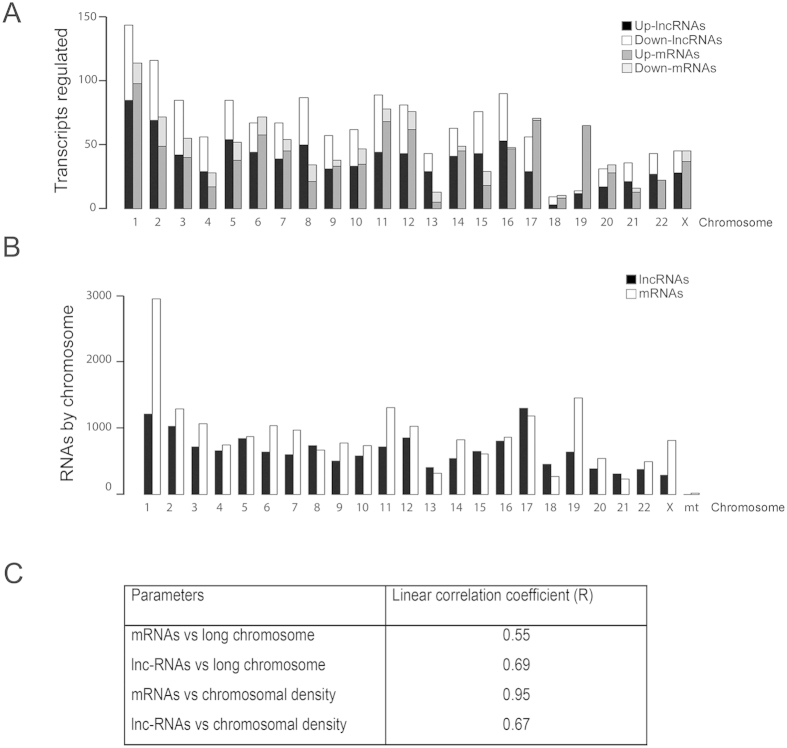
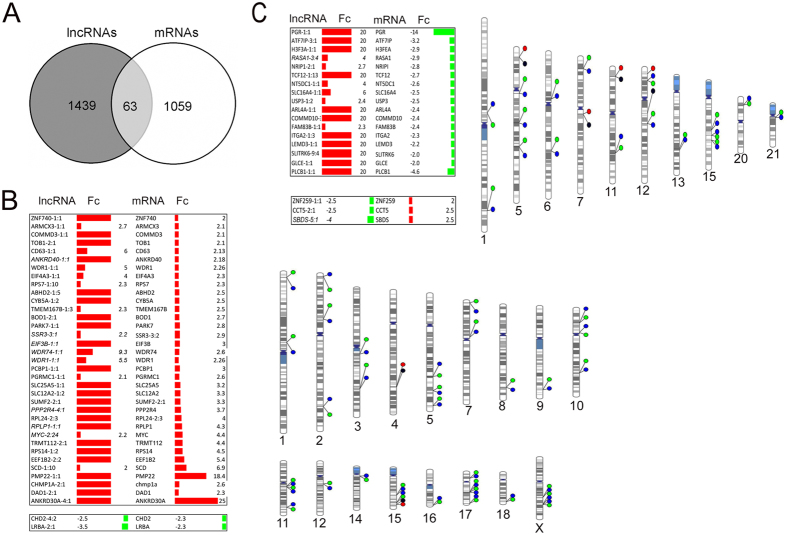
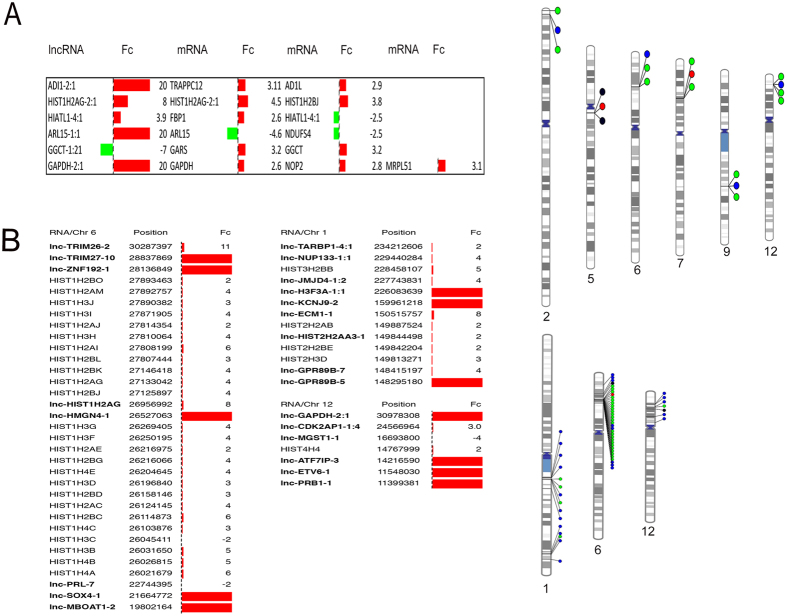
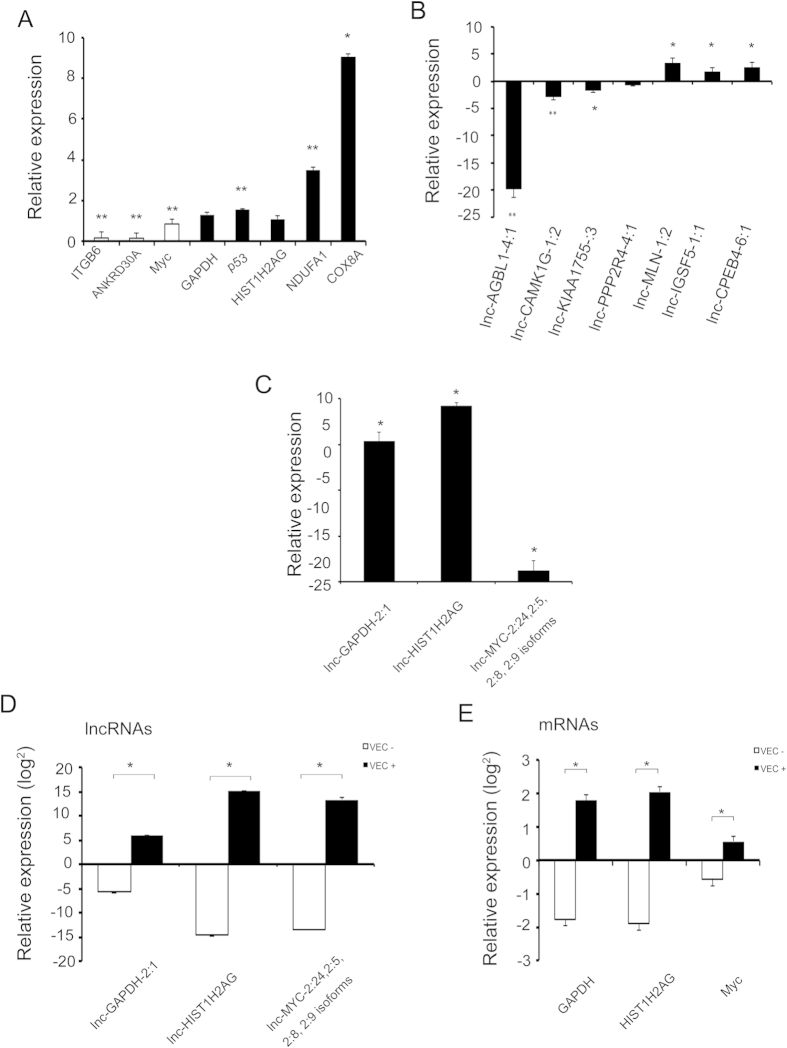
Oxygen or nutrient deprivation of early stage tumoral spheroids can be used to reliably mimic the initial growth of primary and metastatic cancer cells. However, cancer cell growth during the initial stages has not been fully explored using a genome-wide approach. Thus, in the present study, we investigated the transcriptome of breast cancer cells during the initial stages of tumoral growth using RNAseq in a model of Multicellular Tumor Spheroids (MTS). Network analyses showed that a metastatic signature was enriched as several adhesion molecules were deregulated, including EPCAM, E-cadherin, integrins and syndecans, which were further supported by an increase in cell migration. Interestingly, we also found that the cancer cells at this stage of growth exhibited a paradoxical hyperactivation of oxidative mitochondrial metabolism. In addition, we found a large number of regulated (long non coding RNA) lncRNAs, several of which were co-regulated with neighboring genes. The regulatory role of some of these lncRNAs on mRNA expression was demonstrated with gain of function assays. This is the first report of an early-stage MTS transcriptome, which not only reveals a complex expression landscape, but points toward an important contribution of long non-coding RNAs in the final phenotype of three-dimensional cellular models.


Figures

Figure 1
Figure 1. Growth and characterization of MTS.
(A) Growth kinetics of MTS at 2, 4, 6 and 8 days of culture. ±SD n = 3, (B) Nuclei of cells of MTS at 2, 4, 6 and 8 days stained with DAPI (panel a, b, c and d respectively). (C) Six-day spheroids stained with H&E (a); and immunostaining with Ki67 (b); p27Kip1 (c); HIF1α (d). (D) Migration data monolayers vsspheroids disaggregated. The mean geometric diameter DG. Scale bar = 50 μm.
Figure 2
Figure 2. Analysis of the differentially expressed mRNAs in MTS using RNA sequencing.
(A) Fold change of all mRNAs dysregulated. (B) Top ten of dysregulated mRNAs analyzed with IPA, * Genes related to breast cancer metastasis. (C) Fold change of mRNAs associated with cell adhesion. (D) Top five canonical pathways and (E) pathways associated with cell cycle using the IPA software.
Figure 3
Figure 3. Hyperactivation of oxidative mitochondrial metabolism in MTS.
(A) mitochondrial mRNAs dysregulated in five oxidative phosphorylation complexes. (B) Fold change of mRNAs dysregulated in the five oxidative phosphorylation complexes. (C) Fold change of mRNAs mitochondrial dysfunction proteins and other proteins and glycolysis genes. Red color = up-regulation and green color = down-regulation.
Figure 4
Figure 4. Cell-cycle measured in MTS using flow cytometry.
(A) Analysis of the cell-cycle. *p < 0.05 n = 3 t-test. (B,C) Canonical pathways; G1/S checkpoint regulation and estrogen-mediated S phase. Entry (IPA). Interaction formula image Direct, formula image Indirect, formula image Modulation, formula image Inhibiting or/and ubiquitination, formula image Inhibits and acts on, formula image Reaction Gray colors up-regulation and intensity indicates the magnitude of change.
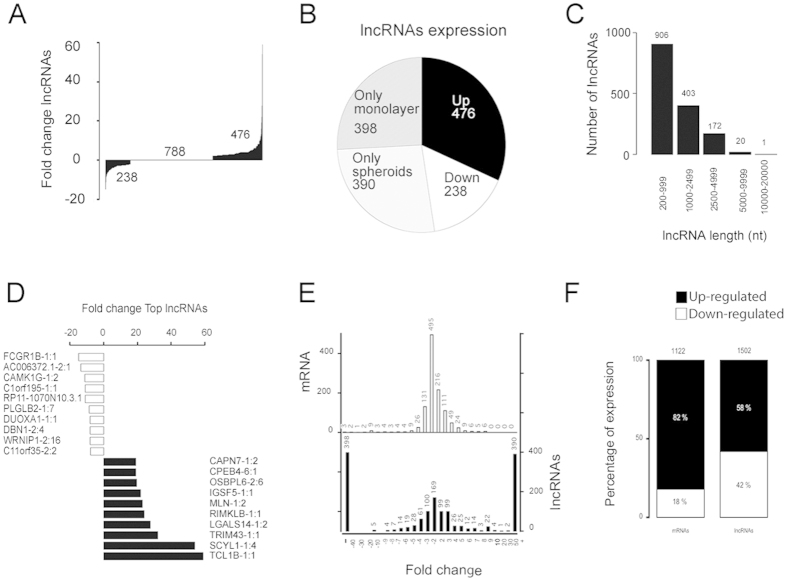
Figure 5
Figure 5. Analysis of the lncRNAs in MTS using RNAseq.
(A) Fold change of all lncRNAs dysregulated. (B) A pie diagram of lncRNAs dysregulated included lncRNAs expressed in only one culture condition. (C) Length distribution of lncRNAs dysregulated. (D) Top ten dysregulated lncRNAs. (E) Histogram of the fold change distribution between dysregulated RNAs (F) Comparison of the lncRNAs and mRNAs dysregulated.
Figure 6
Figure 6. Distribution of lncRNAs and mRNAs differentially expressed by chromosome.
(A) Up- and down- regulated mRNAs and lncRNAs dysregulated in MTS by chromosome. (B) Total lncRNAs and mRNAs by chromosome: Ensembl (http://www.emsembl.org/index.html). (C) Linear correlation coefficient (R) of mRNAs and lncRNAs according to length or chromosomal density.
Figure 7
Figure 7. Relationship between dysregulated lncRNAs and neighbor mRNAs in MTS.
(A) Venn diagram of 63 matching transcripts between mRNAs and lncRNAs according to their name in the LNCipedia database (isoforms of lncRNAs not included) (B) lncRNAs and neighboring mRNAs regulated in the same direction and phenogram. (C) lncRNAs and neighboring mRNAs genes regulated in opposite direction and phenogram. Fc = Fold change.
Figure 8
Figure 8. Relationship between dysregulated lncRNAs and neighbors mRNAs in MTS as assessed using the Integrative Genomics Viewer (IGV, Broad Institute).
(A) lncRNAs with more than one neighbor mRNA regulated and the corresponding phenogram. (B) lncRNAs neighboring to histone cluster regulated in spheroid and the phenogram. Fc = Fold change.
Figure 9
Figure 9. qPCR validation of lncRNAs and mRNAs of sequencing data and effect on mRNAs after of the lncRNAs overexpression.
(A,B) qPCR validation of mRNAs and lncRNAs respectively. (C) qPCR validation of lncRNAs for cloning assays. (D,E) Level of lncRNAs and mRNAs following transfection with lncRNAs (VEC+) or empty vector (VEC−) for qPCR. *p < 0.05 and **p < 0.001.

References

    1. Dufau I. et al. Multicellular tumor spheroid model to evaluate spatio-temporal dynamics effect of chemotherapeutics: application to the gemcitabine/CHK1 inhibitor combination in pancreatic cancer. BMC Cancer 12, 15 (2012). - PMC - PubMed
    1. Imamura Y. et al. Comparison of 2D- and 3D-culture models as drug-testing platforms in breast cancer. Oncol Rep 33, 1837–1843 (2015). - PubMed
    1. Francia G., Man S., Teicher B., Grasso L. & Kerbel R. S. Gene expression analysis of tumor spheroids reveals a role for suppressed DNA mismatch repair in multicellular resistance to alkylating agents. Mol Cell Biol 24, 6837–6849 (2004). - PMC - PubMed
    1. Zhou Y. et al. Multiparameter analyses of three-dimensionally cultured tumor spheroids based on respiratory activity and comprehensive gene expression profiles. Anal Biochem 439, 187–193 (2013). - PubMed
    1. Mellor L. F., Baker T. L., Brown R. J., Catlin L. W. & Oxford J. T. Optimal 3D culture of primary articular chondrocytes for use in the rotating wall vessel bioreactor. Aviat Space Environ Med 85, 798–804 (2014). - PMC - PubMed

Publication types

MeSH terms

LinkOut - more resources