. 2017 May;22(5):689-702.
doi: 10.1038/mp.2016.30. Epub 2016 Mar 29.

Pharmacological enhancement of mGlu5 receptors rescues behavioral deficits in SHANK3 knock-out mice

Affiliations

Pharmacological enhancement of mGlu5 receptors rescues behavioral deficits in SHANK3 knock-out mice

C Vicidomini et al. Mol Psychiatry. 2017 May.

Erratum in

Abstract

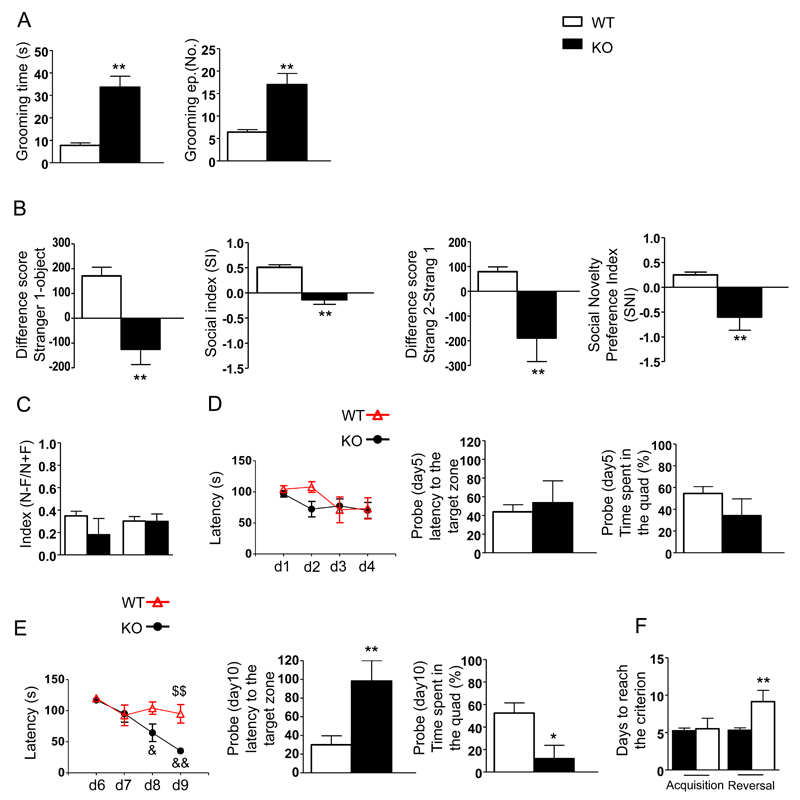
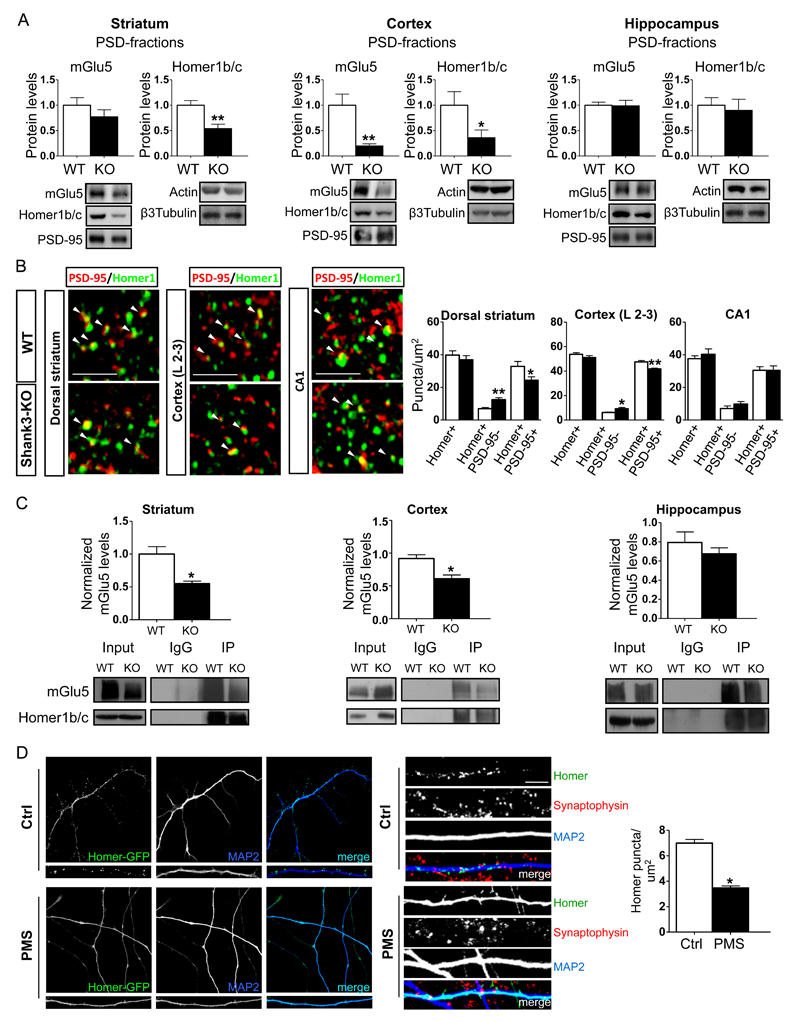
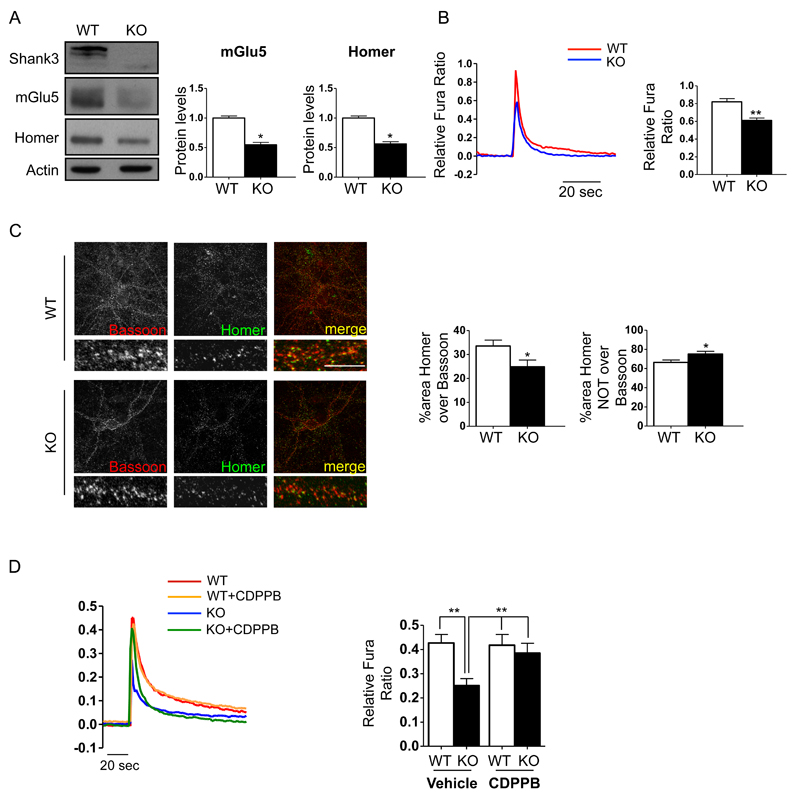
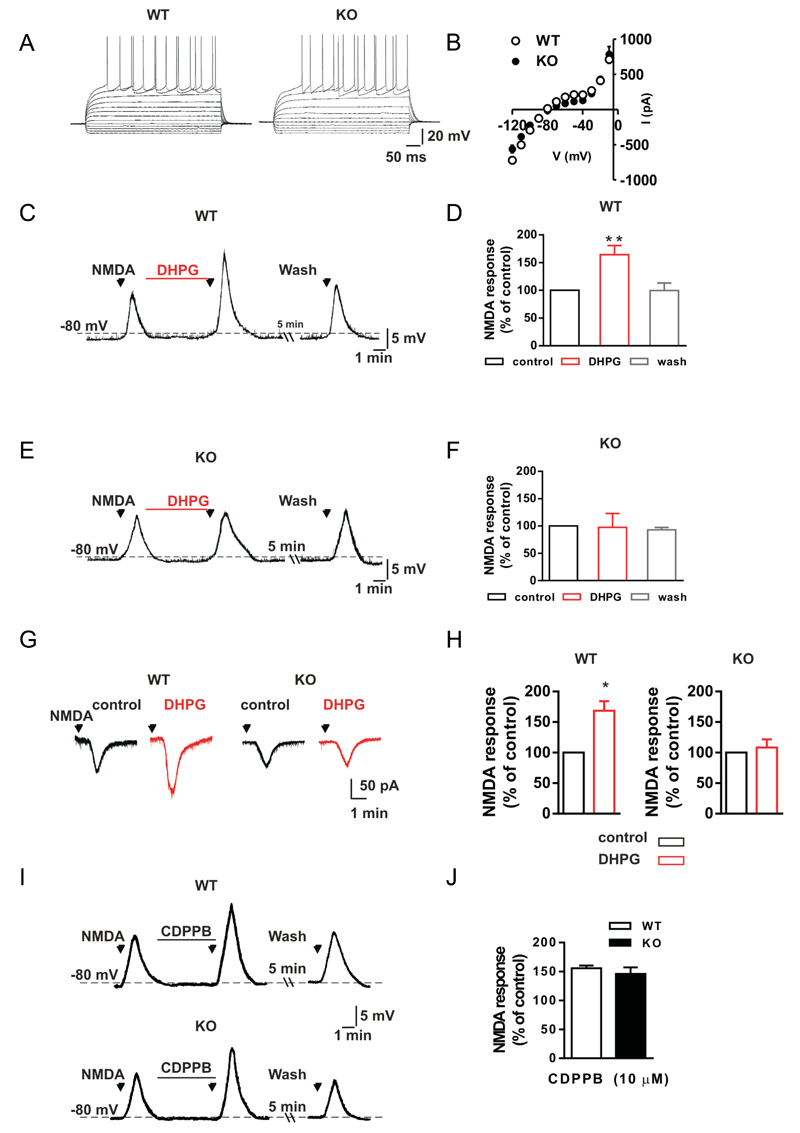
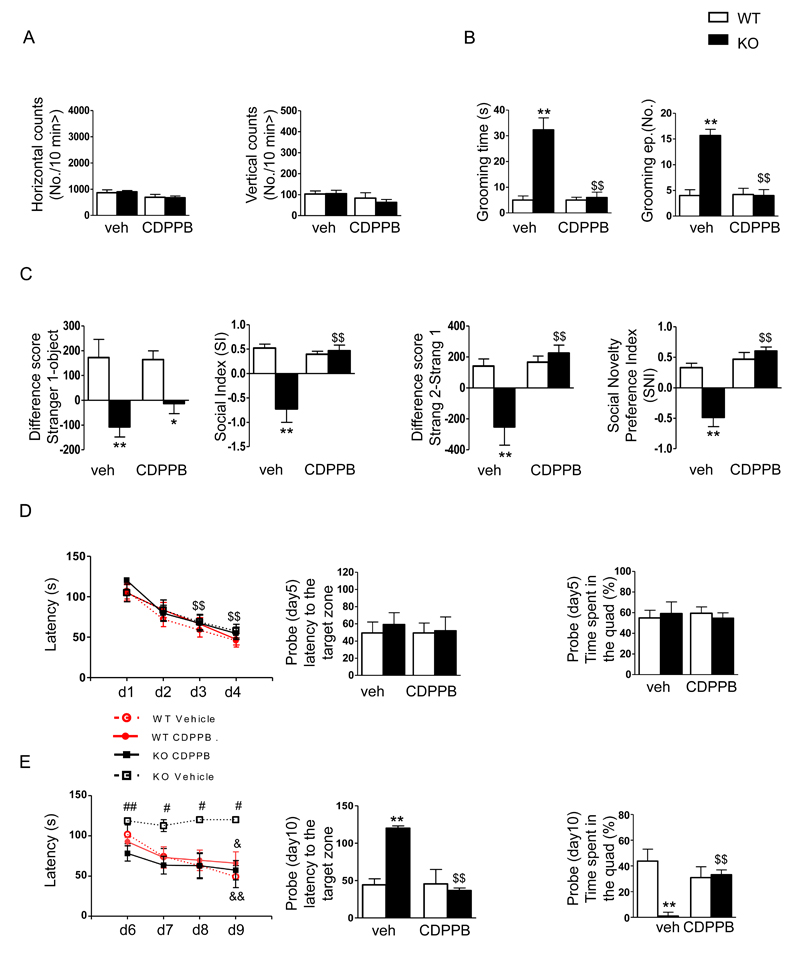
SHANK3 (also called PROSAP2) genetic haploinsufficiency is thought to be the major cause of neuropsychiatric symptoms in Phelan-McDermid syndrome (PMS). PMS is a rare genetic disorder that causes a severe form of intellectual disability (ID), expressive language delays and other autistic features. Furthermore, a significant number of SHANK3 mutations have been identified in patients with autism spectrum disorders (ASD), and SHANK3 truncating mutations are associated with moderate to profound ID. The Shank3 protein is a scaffold protein that is located in the postsynaptic density (PSD) of excitatory synapses and is crucial for synapse development and plasticity. In this study, we investigated the molecular mechanisms associated with the ASD-like behaviors observed in Shank3Δ11-/- mice, in which exon 11 has been deleted. Our results indicate that Shank3 is essential to mediating metabotropic glutamate receptor 5 (mGlu5)-receptor signaling by recruiting Homer1b/c to the PSD, specifically in the striatum and cortex. Moreover, augmenting mGlu5-receptor activity by administering 3-Cyano-N-(1,3-diphenyl-1H-pyrazol-5-yl)benzamide ameliorated the functional and behavioral defects that were observed in Shank3Δ11-/- mice, suggesting that pharmaceutical treatments that increase mGlu5 activity may represent a new approach for treating patients that are affected by PMS and SHANK3 mutations.


Conflict of interest statement

Conflict of Interest

The authors declare they have no conflicts of interest.

Figures

Figure 1
Figure 1
Deletion of Shank3 in mice results in ASD-like behaviors. A) Self-grooming behavior was evaluated as the time spent grooming (left) and the total number of grooming episodes (right). B) Differences in scores obtained for time spent in the chamber associated with the never seen before mouse and the empty cage (left) or the familiar mouse (preference for social novelty test) (right). C) Spatial memory was evaluated by determining a discrimination index in the spatial object recognition test. D-E) Acquisition and reversal in the Morris water maze was analyzed to determine learning patterns (left), escape latency to the target zone (center) and the time spent in the quadrant (right). F) Performance in the T maze test was analyzed as the number of days required to reach the criterion during the acquisition and reversal phases. Data are shown as the mean ± SEM of 10 animals for each group. *, p<0.05, **, p<0.01; compared to the corresponding WT mice; $$, p<0.01 compared to the corresponding WT mice on the same day; &&, p<0.01 compared to the same genotype on day 1. Student’s t-tests or two-way Anova followed by Bonferroni tests were used for statistical analysis.
Figure 2
Figure 2
Shank3 absence alters Homer and mGlu5 receptor synaptic localization. A) Protein levels of metabotropic glutamate receptor 5 (mGlu5) and Homer1b/c were analyzed using Western Blot analysis in postsynaptic density (PSD) fractions obtained from tissues in the striatum cortex and hippocampus of wild-type (WT) and Shank3Δ11-/- mice. Protein levels were each normalized against the respective PSD-95 and ratios were compared between genotypes. The results are shown as bar diagrams, and representative blots are shown below. All data are presented as the mean ± SEM; all P-values were derived using unpaired, two-tailed Student’s t-tests; *, p<0.05; **, p<0.01. Analyses are based on a sample size of n=6 animals for each group (WT and KO). B) Representative confocal micrographs showing PSD-95 (red) and Homer1 (green). Co-labeled puncta (arrowheads) are visible in high magnification images. The images show immunofluorescence puncta in the neuropil of the dorsal striatum, layer 2-3 of the primary somatosensory cortex and in the CA1 of the hippocampus in Shank3Δ11-/- and KO mice. The results are shown as bar diagrams. Data are presented as mean ± SEM. * p<0.05; ** p<0.01. Analyses are based on a sample size of n=6 animals for each group (WT and KO). Scale bars: 3 μm. C) PSD-enriched preparations of the striatum cortex and hippocampus were obtained from three P60 WT and KO mice and subjected to an in vitro immunoprecipitation assay using rabbit Homer1b/c antibodies. The immunoprecipitated proteins were revealed after immunoblotting using rabbit mGlu5 and Homer1 antibodies. A rabbit IgG antibody was used as the negative control. The data are expressed as the mean ± SEM of three independent experiments and we used n=2 animals for each group (WT and KO) and experiment. *, p<0.05. D) The panels show representative images of hNP-derived neurons and dendrites from control and PMS patients, which, after infection with a lentivirus expressing Homer-GFP, were differentiated in neuronal differentiation medium for 80 days. The staining (right panel) shows that GFP-Homer1b clusters in iPSC-derived neurons colocalize with the presynaptic marker Synaptophysin. Scale bar 10μm The results are shown as bar diagrams. The data are presented as the mean ± SEM of three independent experiments and we used n=2 independent hNP for each individuals. *, p<0.05.
Figure 3
Figure 3
Shank3 absence impairs mGlu5-mediated intracellular calcium release in cortical neurons. Cortical neuronal cultures were prepared from WT and Shank3Δ11-/- E17-E18 mouse embryos. A) Western blot analysis of PSD-enriched fractions of cortical primary neurons obtained from WT and Shank3Δ11-/- mice at DIV15. Protein levels were each normalized against the respective actin control. Data are expressed as the mean ± SEM of n=3 independent cultures by genotype. *, p < 0.05. B) At DIV14-15 neurons were loaded with Fura-2 AM (5 µM, 30 min). After 20 min of de-esterification, the neurons were challenged with 200 µM DHPG. The results are shown as bar diagrams. Representative traces of Ca2+ transients are shown at the left, and the data are expressed as the mean ± SEM of n=127 WT neurons and n=151 KO neurons that were registered from 18 coverslips (for each genotype) in three independent cultures. *, p<0.05; **, p<0.01. C) Representative images of WT and Shank3Δ11-/- mouse primary cortical neurons at DIV15. Confocal images were obtained using a Confocal Microscope with a 63x objective and with sequential-acquisition set at a resolution of 1024 x 1024 pixels. A total of 16 WT and Shank3Δ11-/- primary cortical neurons at DIV15 were randomly chosen for quantification from 4 to 10 coverslips from three independent experiments. Colocalization measurements were performed using MetaMorph image analysis software. Scale bar 5μm . The histogram shows the mean ± SEM for the area of Homer clusters over the area of Bassoon clusters and the area of Homer clusters NOT over Bassoon clusters. *, p < 0.05. D) At DIV12-14 cortical neurons were loaded with Fura-2 and challenged with 200 μM DHPG either in presence (5 min preincubation) or in absence of of 3 μM CDPPB. Results are shown as bar diagrams. Representative traces of Ca2+ transients are shown left; data are expressed as mean ± SEM of n=86 WT neurons and n=77 KO neurons with vehicle and of n=96 WT neurons and n=95 KO neurons with CDPPB registered from 18 coverslips (for each conditions) in three independent cultures for genotype. * p < 0.05; ** p < 0.01.
Figure 4
Figure 4
The mGluR5-mediated enhancement of NMDA-induced neuronal responses is impaired in striatal medium spiny neurons of Shank3Δ11-/- mice A) Representative voltage traces show neuronal responses to hyperpolarizing and depolarizing current steps that were delivered to a striatal medium spiny neuron (MSN) in either a wild-type (WT) or a Shank3Δ11-/- (KO) mouse. B) The current-voltage plot for the MSNs that were recorded from WT and KO mice show that there was no difference between the two groups of mice (p>0.05), analyses are based on a sample size of n=5 animals for each group (WT and KO). C, E) Voltage traces for MSNs that were recorded from WT (C) and a KO (E) mice show that the voltage responses when a 30 µM NMDA bath was applied to a striatal slice for 30 seconds under control conditions or in the presence of 50 µM of the mGluRI agonist DHPG for 5 minutes and after DHPG washout. D, F) Histograms show the NMDA-induced membrane depolarizations of MSNs recorded from WT (D) and KO (F) mice that were produced under control conditions, after 5 minutes of DHPG application, and following DHPG washout. ** p<0.01, analyses are based on a sample size of n=5 animals for each group (WT and KO). G) Current traces for two MSNs that were recorded from a WT (left) and a KO mouse (right) show the inward current that was produced when 30 µM NMDA was applied for 30 seconds under control conditions or in the presence of 50 µM DHPG. H) A histogram showing the NMDA-mediated inward current of MSNs from WT (left) and KO mice (right) in the presence of DHPG as a percentage of the response measured in the presence of NMDA alone. * p<0.05, analyses are based on a sample size of n=5 animals for each group (WT and KO). I) Voltage traces of two MSNs recorded from a WT (top) and a KO mouse (bottom) showing the voltage response produced by NMDA application in control condition and in the presence of 10 µM of the mGluR5 selective allosteric agonist CDPPB. J) Histogram showing the NMDA-mediated voltage response of MSNs from WT and KO mice in the presence of CDPPB as a percentage of the response measured in the presence of NMDA alone. Plot shows that there was no difference between the two groups of mice (p>0.05), analyses are based on a sample size of n=5 animals for each group (WT and KO)
Figure 5
Figure 5
The mGlu5 receptor positive agonist CDPPB rescues ASD-like behavior in Shank3Δ11-/- mice. The behavioral profiles of Shank3Δ11-/- mice were evaluated after treatment with CDPPB (3 mg/kg i.p.) or vehicle (veh), which were administered acutely or chronically at 70 min before each test. A) Mean horizontal (left) and vertical (right) movements were recorded for 10 min in an automated activity cage immediately after grooming recording. B) Self-grooming behaviors were evaluated as the time spent grooming (left) and the total number of grooming episodes (right) after acute treatment with CDPPB or vehicle. C) Differences in the scores corresponding to the time spent in the chamber associated with the never-seen-before mouse and the empty cage (left) or the familiar mouse (preference for social novelty test) (right). D-E) Acquisition and reversal tasks in the Morris water maze were performed after daily treatments for the duration of the task during both acquisition and reversal in mice administered CDPPB or vehicle to analyze learning patterns (left), escape latency to the target zone (center) and the time spent in the quadrant (right) during the probe test. The data are shown as the mean ± SEM of n=13 animals for each group. *, p< 0.05; **, p<0.01 compared to the corresponding WT mice; $$, p<0.01 compared to the corresponding Shank3Δ11-/- mice that were treated with vehicle; #, p<0.05 and ##, p<0.01 compared to the Shank3Δ11-/- mice that were treated with CDPPB. &, p<0.05 and &&, p<0.01 compared to the same genotype on day 1 (two-way Anova followed by Bonferroni test).

References

    1. Phelan K, McDermid HE. The 22q13.3 Deletion Syndrome (Phelan-McDermid Syndrome) Mol Syndromol. 2012;2(3-5):186–201. - PMC - PubMed
    1. Durand CM, Betancur C, Boeckers TM, Bockmann J, Chaste P, Fauchereau F, et al. Mutations in the gene encoding the synaptic scaffolding protein SHANK3 are associated with autism spectrum disorders. Nat Genet. 2007;39(1):25–27. - PMC - PubMed
    1. Bozdagi O, Sakurai T, Papapetrou D, Wang X, Dickstein DL, Takahashi N, et al. Haploinsufficiency of the autism-associated Shank3 gene leads to deficits in synaptic function, social interaction, and social communication. Mol Autism. 2010;1(1):15. - PMC - PubMed
    1. Peça J, Feliciano C, Ting JT, Wang W, Wells MF, Venkatraman TN, et al. Shank3 mutant mice display autistic-like behaviours and striatal dysfunction. Nature. 2011;472(7344):437–442. - PMC - PubMed
    1. Wang X, McCoy PA, Rodriguiz RM, Pan Y, Je HS, Roberts AC, et al. Synaptic dysfunction and abnormal behaviors in mice lacking major isoforms of Shank3. Hum Mol Genet. 2011;20(15):3093–3108. - PMC - PubMed

MeSH terms

Supplementary concepts