. 2016 May 13;291(20):10635-45.
doi: 10.1074/jbc.M115.706200. Epub 2016 Mar 28.

The Methionine Transamination Pathway Controls Hepatic Glucose Metabolism through Regulation of the GCN5 Acetyltransferase and the PGC-1α Transcriptional Coactivator

Affiliations

The Methionine Transamination Pathway Controls Hepatic Glucose Metabolism through Regulation of the GCN5 Acetyltransferase and the PGC-1α Transcriptional Coactivator

Clint D J Tavares et al. J Biol Chem. .

Abstract

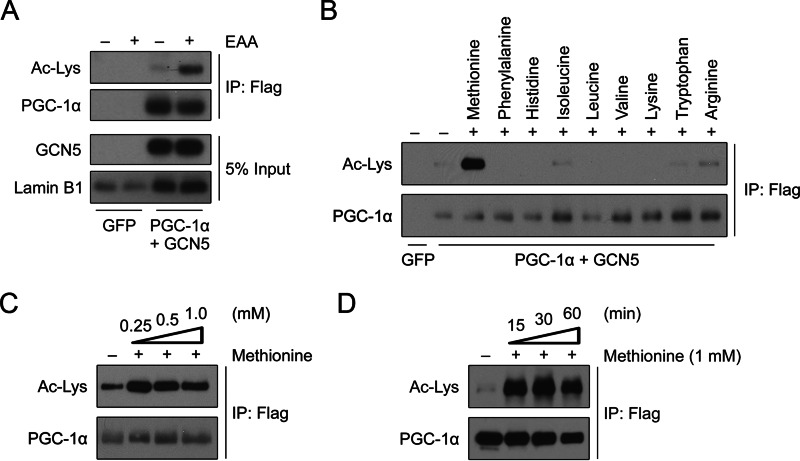
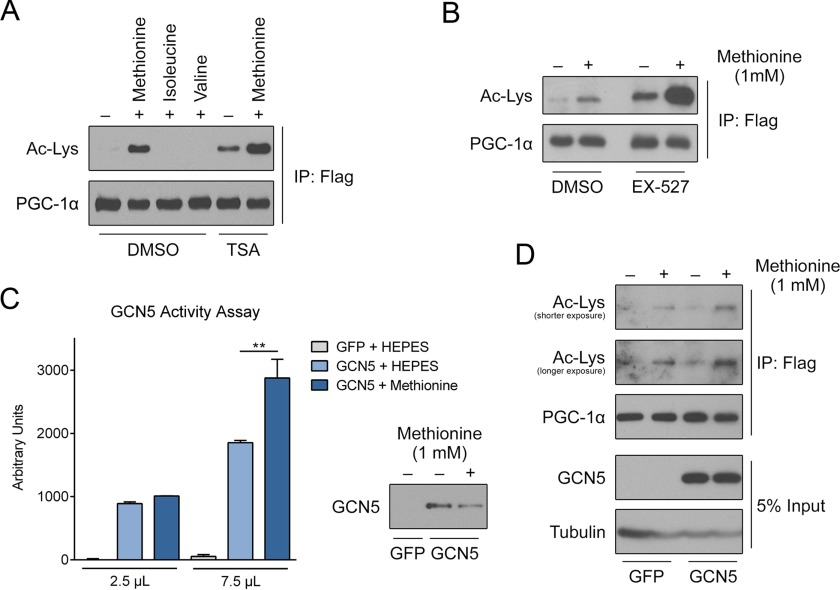
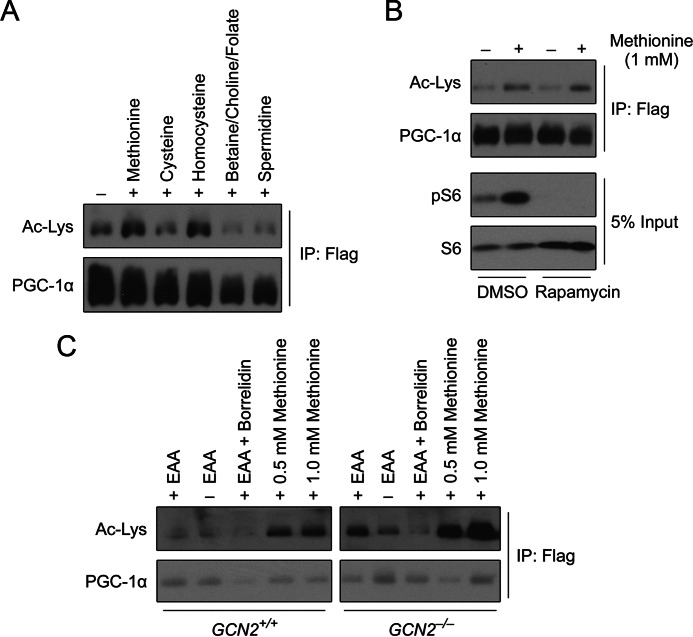
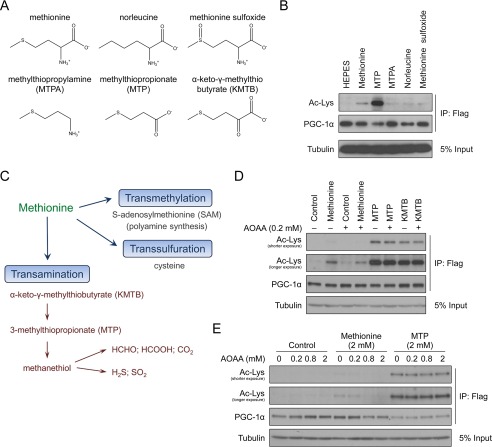
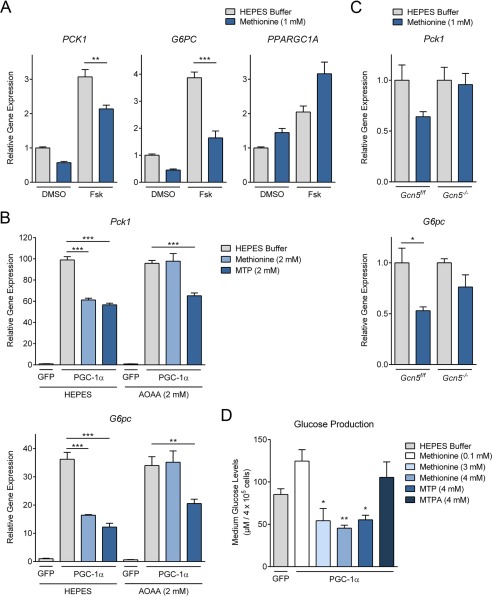
Methionine is an essential sulfur amino acid that is engaged in key cellular functions such as protein synthesis and is a precursor for critical metabolites involved in maintaining cellular homeostasis. In mammals, in response to nutrient conditions, the liver plays a significant role in regulating methionine concentrations by altering its flux through the transmethylation, transsulfuration, and transamination metabolic pathways. A comprehensive understanding of how hepatic methionine metabolism intersects with other regulatory nutrient signaling and transcriptional events is, however, lacking. Here, we show that methionine and derived-sulfur metabolites in the transamination pathway activate the GCN5 acetyltransferase promoting acetylation of the transcriptional coactivator PGC-1α to control hepatic gluconeogenesis. Methionine was the only essential amino acid that rapidly induced PGC-1α acetylation through activating the GCN5 acetyltransferase. Experiments employing metabolic pathway intermediates revealed that methionine transamination, and not the transmethylation or transsulfuration pathways, contributed to methionine-induced PGC-1α acetylation. Moreover, aminooxyacetic acid, a transaminase inhibitor, was able to potently suppress PGC-1α acetylation stimulated by methionine, which was accompanied by predicted alterations in PGC-1α-mediated gluconeogenic gene expression and glucose production in primary murine hepatocytes. Methionine administration in mice likewise induced hepatic PGC-1α acetylation, suppressed the gluconeogenic gene program, and lowered glycemia, indicating that a similar phenomenon occurs in vivo These results highlight a communication between methionine metabolism and PGC-1α-mediated hepatic gluconeogenesis, suggesting that influencing methionine metabolic flux has the potential to be therapeutically exploited for diabetes treatment.

Keywords: acetylation; acetyltransferase; gluconeogenesis; glucose-6-phosphatase (G6pc); methionine; methionine transamination; methylthiopropionic acid (MTP); peroxisome proliferator-activated receptor γ coactivator 1-α (PGC-1α) (PPARGC1α); phosphoenolpyruvate carboxykinase (Pck1); transcription coactivator.


Figures

FIGURE 1.
FIGURE 1.
Methionine increased the acetylation of PGC-1α in primary hepatocytes. A, Western blot analysis of PGC-1α acetylation status upon EAA treatment. Primary hepatocytes were infected with FLAG-PGC-1α and GCN5 adenoviruses. The day after infection cells were treated overnight with Earle's balanced salt solution to deplete all amino acids in the medium. EAAs were added 4 h before harvesting. All cells were harvested within 48 h post-infection. FLAG-PGC-1α was immunoprecipitated (IP) with FLAG-antibody conjugated beads to analyze the acetylation status. B, Western blot analysis of PGC-1α acetylation status upon the addition of individual amino acids. The experiment follows the same procedure described in A, except the cells were treated with individual amino acids (1 mm) for 4 h before harvesting. C, Western blot analysis of PGC-1α acetylation status upon the addition of various concentrations of methionine for 4 h. The experiment follows the same procedure as described in A. D, Western blot analysis of PGC-1α acetylation status upon the addition of 1 mm methionine for various durations. The experiment follows the same procedure as described in A.
FIGURE 2.
FIGURE 2.
Methionine induced the acetylation of PGC-1α via modulating GCN5 activity. A, Western blot analysis of PGC-1α acetylation status upon methionine treatment with a Class I/II HDAC inhibitor, TSA. The experiment follows the same procedure as described in Fig. 1A except the cells were treated with TSA (1 μm) for 6 h before harvesting. Amino acids (1 mm) were added 2 h before harvesting. IP, immunoprecipitation. B, Western blot analysis of PGC-1α acetylation status upon methionine treatment with a SIRT1 inhibitor. The experiment follows the same procedure as described in A, except cells were treated with EX-527 (1 μm) for 6 h before harvesting. C, GCN5 in vitro acetyltransferase activity assay (n = 2). Primary hepatocytes were infected with either GFP or FLAG-GCN5 adenovirus. The cells were treated overnight with Earle's balanced salt solution medium, and methionine (1 mm) was added 2 h before harvesting. All cells were harvested within 48 h post-infection. FLAG-GCN5 was immunoprecipitated from nuclear extracts of cells that were treated with HEPES buffer or methionine. The activity assay was carried out according to the manufacturer's protocol. The corresponding amounts of GCN5 protein in the assay were analyzed via Western blot. D, Western blot analysis of PGC-1α acetylation status upon methionine treatment in Gcn5−/− primary hepatocytes. Primary hepatocytes were isolated from liver-specific Gcn5−/− mice. Primary hepatocytes were infected with FLAG-PGC-1α and either GFP or GCN5 adenovirus. Two days post-infection, cells were incubated in DMEM maintenance medium lacking methionine for 5 h before harvesting. Methionine (1 mm) was added 2 h before harvesting. For all multiple comparisons, one-way analysis of variance with post-hoc Tukey's test was used. **, p < 0.01.
FIGURE 3.
FIGURE 3.
Methionine did not induce the acetylation of PGC-1α via classical amino acid signaling pathways. A, Western blot analysis of PGC-1α acetylation status upon methionine metabolite treatment. The experiment follows the same procedure as described in Fig. 1A except the cells were treated with various metabolites of methionine (1 mm each) for 2 h before harvesting. IP, immunoprecipitation. B, Western blot analysis of PGC-1α acetylation status upon methionine treatment with rapamycin. The experiment follows the same procedure as described in Fig. 1A. Rapamycin (20 nm) and methionine (1 mm) were added 6 h and 2 h before harvesting, respectively. Western blot of phospho-S6 was analyzed to ensure the efficiency of rapamycin treatment. C, Western blot analysis of PGC-1α acetylation status upon methionine treatment in GCN2+/+ and GCN2−/− primary hepatocytes. Primary hepatocytes were isolated from GCN2+/+ and GCN2−/− mice. The experiment follows the same procedure as described in Fig. 1A. EAAs or methionine were added 2 h and borrelidin (1 μm) 30 min before harvesting.
FIGURE 4.
FIGURE 4.
Methionine increased the acetylation of PGC-1α via the methionine transamination pathway. A, structures of methionine analogs used in this study. B, Western blot analysis of PGC-1α acetylation status upon treatment with methionine and its analogs. Primary hepatocytes were infected with FLAG-PGC-1α adenovirus. The day after infection cells were incubated overnight in DMEM maintenance medium lacking methionine and cysteine. Methionine and its analogs (2 mm) were added 2 h before harvesting. IP, immunoprecipitation. C, summary of the methionine transamination pathway. D, Western blot analysis of PGC-1α acetylation status upon treatment with AOAA, a transaminase inhibitor. The experiment follows a similar procedure as described in B, except the day after infection cells were incubated in DMEM maintenance medium lacking methionine for 6 h before harvesting. AOAA (0.2 mm) and methionine and its analogs (2 mm) were added 2.5 h and 2 h before harvesting, respectively. E, Western blot analysis of PGC-1α acetylation status upon the addition of methionine transamination pathway metabolites with various concentrations of AOAA. The experiment follows the same procedure as described in D except for treatment with various concentrations of AOAA.
FIGURE 5.
FIGURE 5.
Methionine repressed gluconeogenesis in primary hepatocytes. A, real-time PCR analysis of gluconeogenic gene expression upon methionine treatment in human liver carcinoma cells (n = 3). HepG2 cells were treated with DMSO or 30 μm forskolin (Fsk) overnight. HEPES buffer or methionine (1 mm) was added to the cells 3 h before harvesting. cDNA was generated from RNA, extracted using TRIzol-chloroform extraction methods. B, real-time PCR analysis of gluconeogenic gene expression upon the addition of methionine and MTP combined with AOAA treatment in primary hepatocytes (n = 3). Primary hepatocytes were infected with either GFP or FLAG-PGC-1α adenovirus. Two days post-infection, cells were incubated in DMEM maintenance medium lacking methionine for 7.5 h before harvesting. AOAA (0.2 mm) was added 4.5 h before harvesting. Methionine and MTP (2 mm) were added 4 h before harvesting. C, real-time PCR analysis of gluconeogenic gene expression upon the addition of methionine in Gcn5f/f and Gcn5−/− primary hepatocytes (n = 3). Primary hepatocytes were isolated from liver-specific Gcn5f/f and Gcn5−/− mice. Primary hepatocytes were infected with either GFP or FLAG-PGC-1α adenovirus. Two days post-infection, cells were incubated in DMEM maintenance medium lacking methionine for 7 h before harvesting. Methionine (1 mm) was added 4 h before harvesting. D, hepatic glucose production assay (n = 3). Primary hepatocytes were infected with either GFP or FLAG-PGC-1α adenovirus. Two days post-infection, glucose production capacity of primary hepatocytes was measured by incubating the cells in glucose free medium for 3 h. Methionine (0.1, 3, 4 mm), MTP (4 mm), and methylthiopropylamine (MTPA; 4 mm) were added to the cells 3 h before collection of the media samples. The glucose concentration was calculated based on the difference between pyruvate/lactate-free medium and 2 mm pyruvate/20 mm lactate-containing medium. For all multiple comparisons, one-way analysis of variance with post-hoc Tukey's test was used. *, p < 0.05; **, p < 0.01; ***, p < 0.001.
FIGURE 6.
FIGURE 6.
Methionine repressed gluconeogenesis in vivo. A, real-time PCR analysis of in vivo hepatic gluconeogenic gene expression and whole body glycemia upon methionine (100 mg/kg) intraperitoneal injection (n = 3). Eight-week old male C57BL/6 mice were fasted overnight (16 h). PBS or methionine (100 mg/kg, dissolved in PBS) was intraperitoneally injected into the mice. All mice were sacrificed 2 h post-injection, and livers were snap-frozen for gene expression analysis. Glycemia was measured via tail-bleeding at the time of harvesting. B, Western blot analysis of endogenous PGC-1α acetylation status in vivo. Endogenous PGC-1α was immunoprecipitated (IP) from nuclear extracts of livers. The experiment follows the same procedure as described in A. Mice were intraperitoneally injected with PBS, essential amino acids (300 mg/kg), or methionine (100 mg/kg, 300 mg/kg). For two experimental comparisons, two-tailed Student's t test was used. *, p < 0.05; ***, p < 0.001.

Similar articles

Cited by

References

    1. Gietzen D. W., and Rogers Q. R. (2006) Nutritional homeostasis and indispensable amino acid sensing: a new solution to an old puzzle. Trends Neurosci. 29, 91–99 - PubMed
    1. Gallinetti J., Harputlugil E., and Mitchell J. R. (2013) Amino acid sensing in dietary-restriction-mediated longevity: roles of signal-transducing kinases GCN2 and TOR. Biochem. J. 449, 1–10 - PMC - PubMed
    1. Wek R. C., Jackson B. M., and Hinnebusch A. G. (1989) Juxtaposition of domains homologous to protein kinases and histidyl-tRNA synthetases in GCN2 protein suggests a mechanism for coupling GCN4 expression to amino acid availability. Proc. Natl. Acad. Sci. U.S.A. 86, 4579–4583 - PMC - PubMed
    1. Dong J., Qiu H., Garcia-Barrio M., Anderson J., and Hinnebusch A. G. (2000) Uncharged tRNA activates GCN2 by displacing the protein kinase moiety from a bipartite tRNA-binding domain. Mol. Cell 6, 269–279 - PubMed
    1. Sancak Y., Peterson T. R., Shaul Y. D., Lindquist R. A., Thoreen C. C., Bar-Peled L., and Sabatini D. M. (2008) The Rag GTPases bind raptor and mediate amino acid signaling to mTORC1. Science 320, 1496–1501 - PMC - PubMed

Publication types

MeSH terms

Substances

LinkOut - more resources