. 2016 Jun;22(6):839-51.
doi: 10.1261/rna.053959.115. Epub 2016 Mar 28.

How many biological replicates are needed in an RNA-seq experiment and which differential expression tool should you use?

Affiliations

How many biological replicates are needed in an RNA-seq experiment and which differential expression tool should you use?

Nicholas J Schurch et al. RNA. 2016 Jun.

Erratum in

Abstract

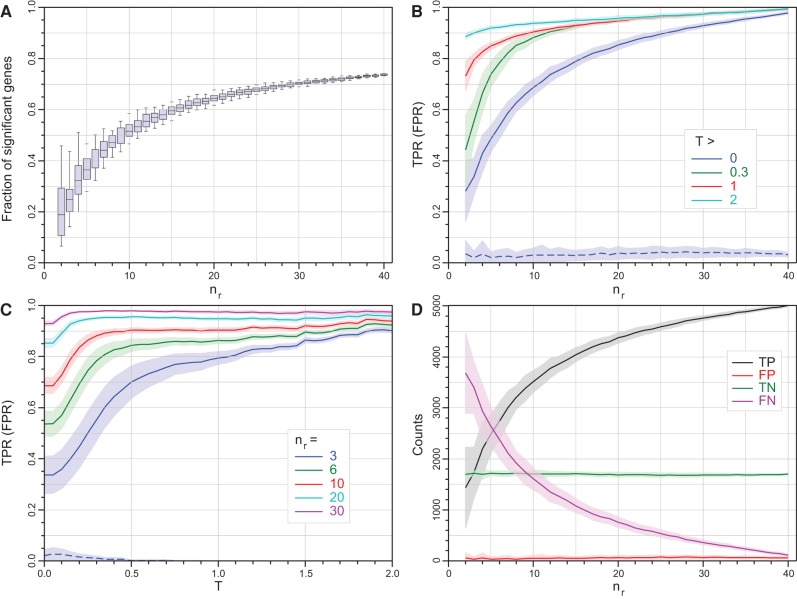
RNA-seq is now the technology of choice for genome-wide differential gene expression experiments, but it is not clear how many biological replicates are needed to ensure valid biological interpretation of the results or which statistical tools are best for analyzing the data. An RNA-seq experiment with 48 biological replicates in each of two conditions was performed to answer these questions and provide guidelines for experimental design. With three biological replicates, nine of the 11 tools evaluated found only 20%-40% of the significantly differentially expressed (SDE) genes identified with the full set of 42 clean replicates. This rises to >85% for the subset of SDE genes changing in expression by more than fourfold. To achieve >85% for all SDE genes regardless of fold change requires more than 20 biological replicates. The same nine tools successfully control their false discovery rate at ≲5% for all numbers of replicates, while the remaining two tools fail to control their FDR adequately, particularly for low numbers of replicates. For future RNA-seq experiments, these results suggest that at least six biological replicates should be used, rising to at least 12 when it is important to identify SDE genes for all fold changes. If fewer than 12 replicates are used, a superior combination of true positive and false positive performances makes edgeR and DESeq2 the leading tools. For higher replicate numbers, minimizing false positives is more important and DESeq marginally outperforms the other tools.

Keywords: RNA-seq; benchmarking; differential expression; experimental design; replication; statistical power; yeast.


Figures

FIGURE 1.
FIGURE 1.
Statistical properties of edgeR (exact) as a function of |log2(FC)| threshold, T, and the number of replicates, nr. Individual data points are not shown for clarity; however, the points comprising the lines are each an average over 100 bootstrap iterations, with the shaded regions showing the 1 SD limits. (A) The fraction of all (7126) genes called as SDE as a function of the number of replicates (boxplots show the median, quartiles and 95% limits across replicate selections within a bootstrap run). (B) Mean true positive rate (TPR) as a function of nr for four thresholds T∈{0,0.3,1,2} (solid curves, the mean false positive rate [FPR] for T = 0 is shown as the dashed blue curve, for comparison). Data calculated for every Δnr = 1. (C) Mean TPR as a function of T for nr∈{3,6,10,20,30} (solid curves, again the mean FPR for nr = 3 is shown as the dashed blue curve, for comparison). Data calculated every ΔT = 0.1. (D) The number of genes called as true/false positive/negative (TP, FP, TN, and FN) as a function of nr. The FPR remains extremely low with increasing nr demonstrating that edgeR is excellent at controlling its false discovery rate. Data calculated for every Δnr = 1.
FIGURE 2.
FIGURE 2.
Comparison of the true positive rate (TPR) and false positive rate (FPR) performance for each of the DGE tools on low-, medium-, and highly replicated RNA-seq data (nr∈{3,6,12,20}—rows) for three |log2(FC)| thresholds (T∈{0,0.5,2}—columns). The TPRs and FPRs for each tool are calculated by comparing the mean number of true and false positives (TPs and FPs) calculated over 100 bootstrap iterations to the number of TPs and FPs calculated from the same tool using the full clean data set (error bars are 1 SD). Although the TPRs and FPRs from each tool are calculated by comparing each tool against itself rather than a tool-independent “gold standard” (albeit with the full clean data set), the results are comparable across tools except for DEGSeq which calls a significantly larger fraction of genes as DE for all values of T and nr (Supplemental Fig. S4). In general, the TPR increases with increasing nr (AD) while both the TPR increases and the FPR decreases with increasing T (A,D,E,F). The TPR for bootstrap subselections with three replicates and no fold-change threshold is ∼20%–40% for all the tools except NOISeq and DEGSeq (A). For the highest fold-change genes (T = 2), the tools show TPRs ≳85% and, with the exception of cuffdiff also show FPRs consistent with zero ([E] NOISeq and PoissonSeq produce no FPs for the highest threshold genes and thus no FPR is shown for them). For T = 2, increasing nr provides only a modest increase in TPR (∼85% to ∼95%) irrespective of the tool (E and F). PoissonSeq and BaySeq show an increasing FPR with increasing nr (AD), and cuffdiff unexpectedly shows an increase in FPR with increasing T. DESeq appears more conservative than the other tools, consistently returning fewer FPs (particularly for high values of nr [D and F]) and fewer TPs (particularly at low values of nr [A and E]).
FIGURE 3.
FIGURE 3.
Hierarchical clustering of eleven RNA-seq DGE tools and five standard statistical tests using all of the full clean data set comprising 42 WT and 44 Δsnf2 replicates. For each tool, or test, a 7126-element long vector of 1's and 0's was constructed representing whether each gene in the annotation was called as SDE (adjusted P-value or FDR threshold ≤0.05) by the tool or not. The vectors for each tool and test were then ordered by the gene id and hierarchically clustered by Correlation distance with complete linkage using the R package pvclust. Approximately unbiased P-value percentages (bracketed values) calculated for each branch in the clustering represent the support in the data for the observed sub-tree clustering. AU% > 95% are strongly supported by the data. AU% values are not shown for branch points where AU% = 100 for clarity. The outlier clustering of baySeq, DEGSeq, edgeR (GLM), and NOISeq suggest that these tools are clearly distinct from the other tools. Combined with the tool performance data shown in Figure 2, this suggests that, given a large number of replicates, the tools and tests in Cluster 1 are reliably and reproducibly converging on a similar answer, and are likely to be correctly capturing the SDE signal in the data.
FIGURE 4.
FIGURE 4.
Testing false positive rate (FPR) performance: Each tool was used to call significantly differentially expressed (SDE) genes based on two artificial “conditions,” each constructed only from WT biological replicates. Genes identified as SDE are, by definition, false positives. The box plots show the median, quartiles, and 95% data limits on the FPR for 100 bootstrap iterations of each of the eleven tools and the log t-test for nr = 3,4,..,20. The red line highlights a 5% FPR. (A) y-axis scale 0–0.5; (B) y-axis scale 0–1.0. In most cases the tools perform well for each bootstrap iteration, with only a small number of iterations showing a FPR > 5%. DEGSeq, NOISeq, and SAMSeq consistently show a higher and more variable FPR, suggesting that they are struggling to control their FPR adequately.

References

    1. Anders S, Huber W. 2010. Differential expression analysis for sequence count data. Genome Biol 11: R106. - PMC - PubMed
    1. Anders S, Pyl PT, Huber W. 2015. HTSeq–a Python framework to work with high-throughput sequencing data. Bioinformatics 31: 166–169. - PMC - PubMed
    1. Auer PL, Doerge RW. 2010. Statistical design and analysis of RNA sequencing data. Genetics 185: 405–416. - PMC - PubMed
    1. Becker PB, Horz W. 2002. ATP-dependent nucleosome remodeling. Annu Rev Biochem 71: 247–273. - PubMed
    1. Bellera CA, Julien M, Hanley JA. 2010. Normal approximations to the distributions of the Wilcoxon statistics: accurate to what N? Graphical insights. J Stat Educ 18.

MeSH terms