

Status competition, inequality, and fertility: implications for the demographic transition
- PMID: 27022077
- PMCID: PMC4822430
- DOI: 10.1098/rstb.2015.0150
Status competition, inequality, and fertility: implications for the demographic transition
Abstract
The role that social status plays in small-scale societies suggests that status may be important for understanding the evolution of human fertility decisions, and for understanding how such decisions play out in modern contexts. This paper explores whether modelling competition for status--in the sense of relative rank within a society--can help shed light on fertility decline and the demographic transition. We develop a model of how levels of inequality and status competition affect optimal investment by parents in the embodied capital (health, strength, and skills) and social status of offspring, focusing on feedbacks between individual decisions and socio-ecological conditions. We find that conditions similar to those in demographic transition societies yield increased investment in both embodied capital and social status, generating substantial decreases in fertility, particularly under conditions of high inequality and intense status competition. We suggest that a complete explanation for both fertility variation in small-scale societies and modern fertility decline will take into account the effects of status competition and inequality.
Keywords: demographic transition; fertility; inequality; social complexity; social status; status competition.
© 2016 The Author(s).
Figures
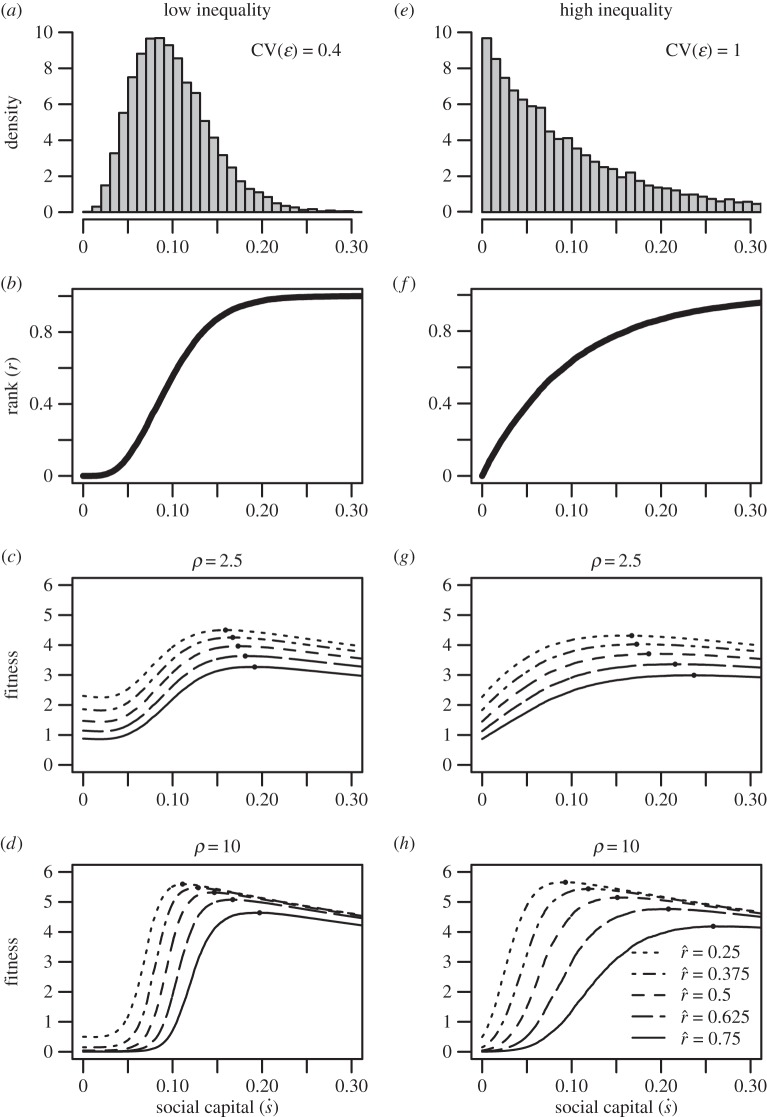
 , varying across the solid and dashed lines) and slope (ρ, varying across panels) of the effect-of-social-capital function. Solid black points indicate the optimal (fitness-maximizing) levels of investment in social capital.
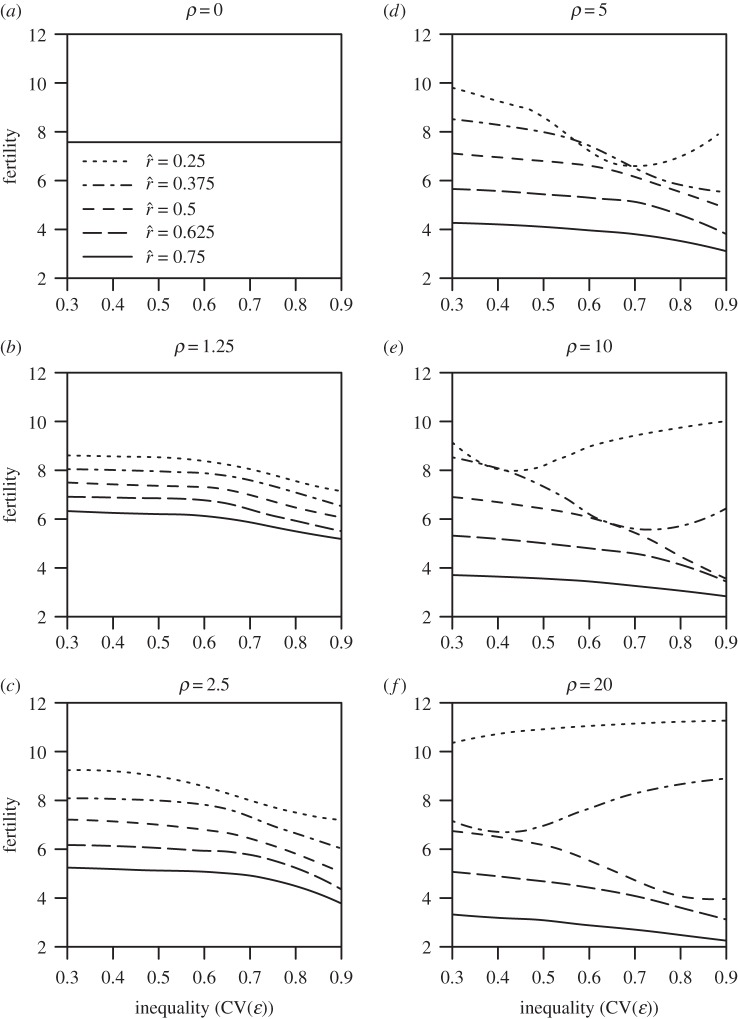
 , varying across the dashed and solid lines) and slope (ρ, varying across panels) of the effect-of-social-capital function.
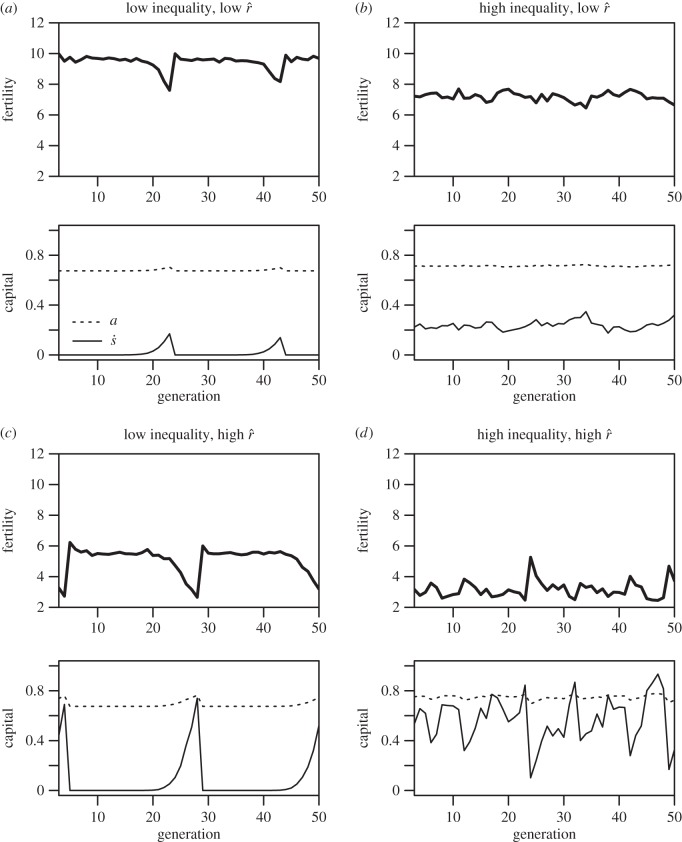
 ). The left-hand column represents lower inequality in the inputs to status (CV(ɛ) = 0.4), whereas the right-hand column represents higher inequality (CV(ɛ) = 1). The top row represents a lower intensity of status competition (
 ), whereas the bottom row represents a higher intensity (
 ). ρ is held constant at 2.5 across ecologies.
References
-
- Caldwell JC, Caldwell BK, Caldwell P, McDonald PF, Schindlmayr T. 2006. Demographic transition theory. Dordrecht, The Netherlands: Springer.
-
- Frank RH. 1985. Choosing the right pond: human behavior and the quest for status. Oxford, UK: Oxford University Press.
Publication types
MeSH terms
LinkOut - more resources
Full Text Sources
Other Literature Sources
