. 2016 Mar 29;11(3):e0152194.
doi: 10.1371/journal.pone.0152194. eCollection 2016.

Most and Least Preferred Colours Differ According to Object Context: New Insights from an Unrestricted Colour Range

Affiliations

Most and Least Preferred Colours Differ According to Object Context: New Insights from an Unrestricted Colour Range

Domicele Jonauskaite et al. PLoS One. .

Abstract

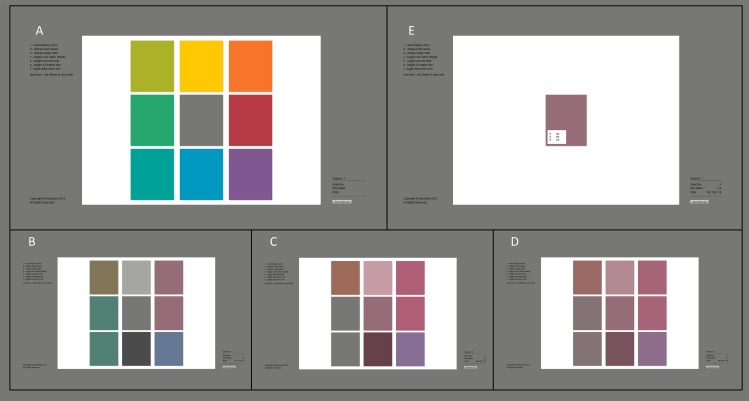
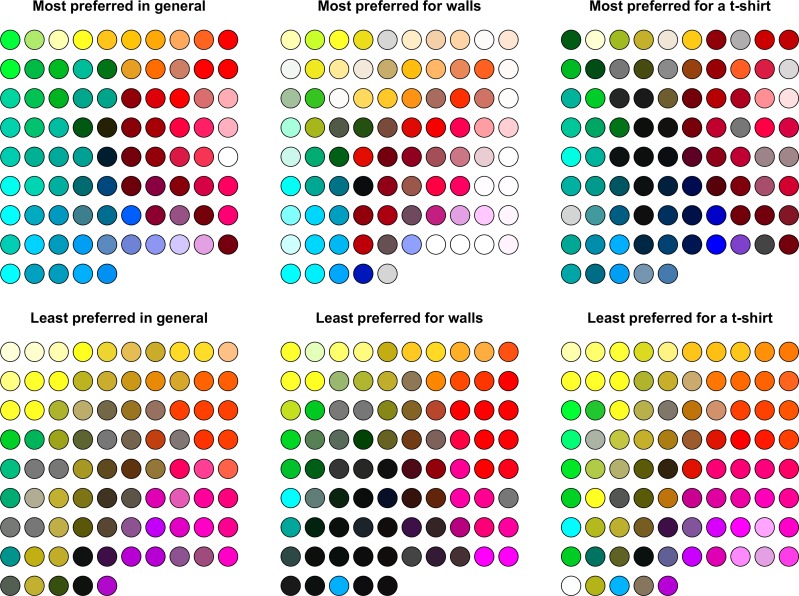
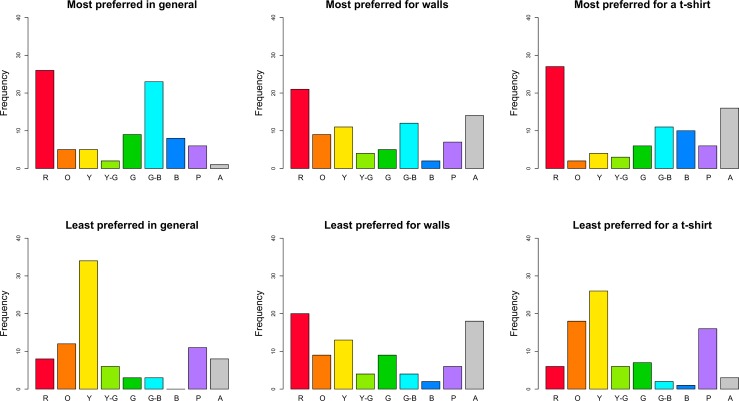
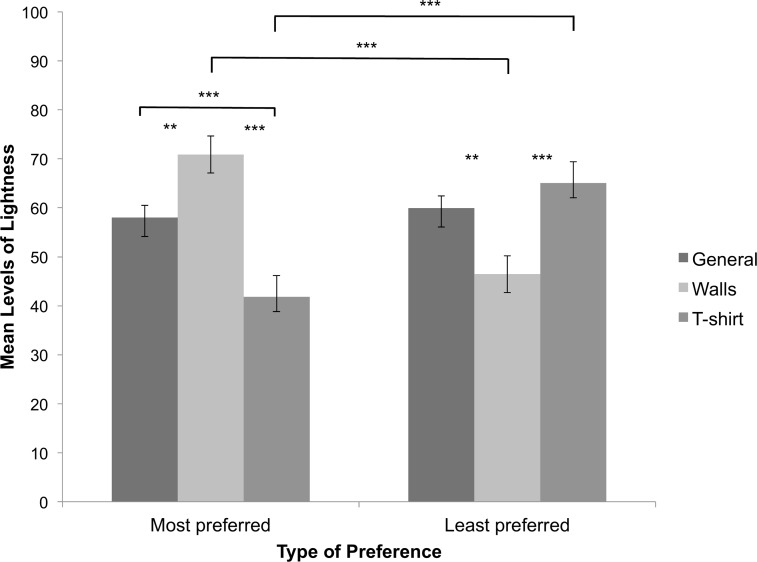
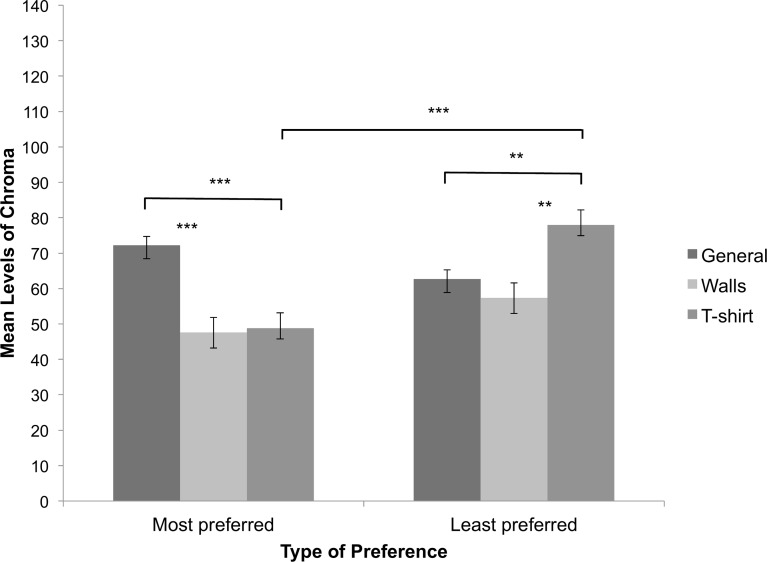
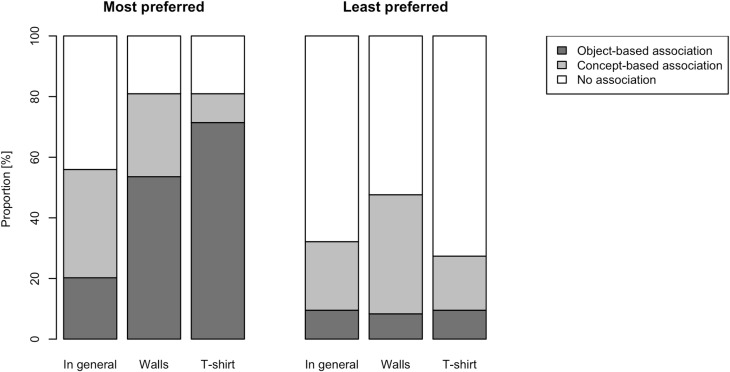
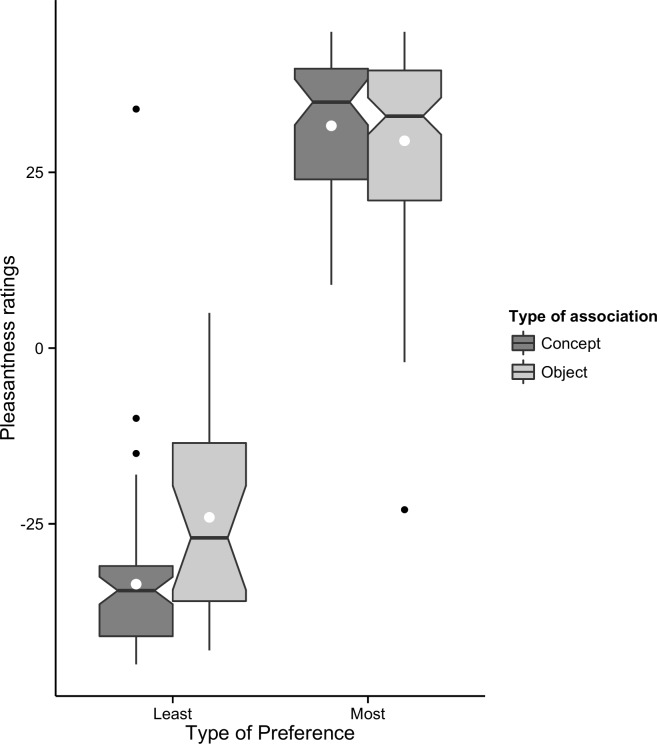
Humans like some colours and dislike others, but which particular colours and why remains to be understood. Empirical studies on colour preferences generally targeted most preferred colours, but rarely least preferred (disliked) colours. In addition, findings are often based on general colour preferences leaving open the question whether results generalise to specific objects. Here, 88 participants selected the colours they preferred most and least for three context conditions (general, interior walls, t-shirt) using a high-precision colour picker. Participants also indicated whether they associated their colour choice to a valenced object or concept. The chosen colours varied widely between individuals and contexts and so did the reasons for their choices. Consistent patterns also emerged, as most preferred colours in general were more chromatic, while for walls they were lighter and for t-shirts they were darker and less chromatic compared to least preferred colours. This meant that general colour preferences could not explain object specific colour preferences. Measures of the selection process further revealed that, compared to most preferred colours, least preferred colours were chosen more quickly and were less often linked to valenced objects or concepts. The high intra- and inter-individual variability in this and previous reports furthers our understanding that colour preferences are determined by subjective experiences and that most and least preferred colours are not processed equally.


Conflict of interest statement

Competing Interests: Peter M. Spiers is employed by AkzoNobel. There are no patents, products in development or marketed products to declare arising from the research. This does not alter the authors' adherence to all the PLOS ONE policies on sharing data and materials, as detailed online in the guide for authors.

Figures

Fig 1
Fig 1. Illustration of the colour picker.
Picture A refers to the starting screen and picture E refers to the screen of the final colour choice. Pictures B, C and D refer to possible intermediate selection steps of the program.
Fig 2
Fig 2. Most preferred and least preferred colour choices in three context conditions.
Each colour patch represents a colour choice of one participant. Their positions are defined by 1) hue so that neighbouring hues on the colour circle (e.g. orange and yellow) appear next to each other in the graph, and 2) lightness so that darker colours appear closer to the centre as compared to lighter colours. The colours were derived from the CIE LCh values.
Fig 3
Fig 3. Distributions of colour choices according to hue for most and least preferred colours in three context conditions.
This representation does not account for CIE LCh lightness and chroma values. R = red, O = orange, Y = yellow, Y-G = yellow-green, G = green, G-B = green-blue, B = blue, P = purple, and A = achromatic.
Fig 4
Fig 4. Lightness levels of colour choices.
Depicted are the mean lightness levels for the three context conditions and most and least preferred colours, separately. Bars indicate one standard error of the mean. We indicate significant pairwise comparisons (** p < 0.010, *** p < 0.001).
Fig 5
Fig 5. Chroma levels of colour choices.
Depicted are the mean chroma levels for the three context conditions and most and least preferred colours, separately. Bars indicate one standard error of the mean. We indicate significant pairwise comparisons (** p < 0.010, *** p < 0.001).
Fig 6
Fig 6. Cumulative bar chart of reported associations to colour choices.
The portions of the cumulative bars indicate the percentage of the participants associating their chosen colours with an object, a concept, or nothing (i.e. no association). Colour choices are split by type of preference and context condition.
Fig 7
Fig 7. Pleasantness ratings of objects and concepts associated to selected colours.
Notches indicate the confidence interval of 95% from the median (horizontal line within the box) and the white dot in the box indicates the mean. The edges of the boxes indicate the range of responses of 50% of participants. The whiskers indicate the range responses without extreme outliers, which are indicated as dots.

Similar articles

Cited by

References

    1. Moore, B. Color Trends 2015. Benjamin Moore. 2015. Available: http://www.benjaminmoore.com/en-us/for-your-home/benjamin-moore-color-tr...
    1. Colour Futures 15. Five wonderful stories about normal things… 2014. Available: http://www.colourfutures.com/en_trends.jsp
    1. Color Matters. Global colour survey. 2015. Available: http://www.colormatters.com/color-symbolism/global-color-survey
    1. Scott Design Inc. What’s your favorite color? 2015. Available: https://www.hotdesign.com/marketing/whats-your-favorite-color/
    1. Judd DB, Wyszecki JJ. Color in Business Science and Industry (3rd Ed., p. 388). NY, U.S.A.: Wiley, New York; 1975

Publication types

LinkOut - more resources