Review
. 2016:56:91-100.
doi: 10.1159/000442784. Epub 2016 Mar 15.

Optical Coherence Tomography Angiography of Dry Age-Related Macular Degeneration

Review

Optical Coherence Tomography Angiography of Dry Age-Related Macular Degeneration

Nadia K Waheed et al. Dev Ophthalmol. 2016.

Abstract

Optical coherence tomography angiography (OCTA) can be used to visualize alterations in the choriocapillaris of patients with dry age-related macular degeneration (AMD). These changes seem to be present during all stages of the disease. Earlier stages are associated with patchy thinning of the choriocapillaris, while geographic atrophy is associated with loss of choriocapillaris lying under the area of geographic atrophy and asymmetric alteration of choriocapillaris at the margins of the geographic atrophy. The use of high-speed, long-wave-length swept-source OCT for angiography, with its better penetration into the choroid and high acquisition speeds, enable OCTA with scaled slowest detectable flow and fastest distinguishable flow. This will enable us to better investigate choriocapillaris changes in patients with dry AMD. The ability to image the choriocapillaris structure and flow impairments may be useful in the future for detecting and monitoring the progression of dry AMD and for monitoring treatment responses in clinical trials to therapies that target disease progression in dry AMD.


Figures

Fig. 1
Fig. 1
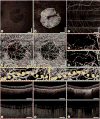
A composite image of a color photo (a) and a same-day swept-source optical coherence tomography (OCT) angiography (OCTA) image and the corresponding en face OCT intensity image at the level of the choriocapillaris (CC) (b, c) and a spectral-domain OCTA image with the corresponding en face OCT intensity image at the level of the CC (e, f) and the corresponding B-scan (d). The green arrows show an area of shadowing under drusen, visible as a dark area on both the intensity and angiographic images. Note that the swept-source OCTA (b) image has less pronounced shadowing in the area underneath the drusen than the spectral-domain OCTA image (e), likely to due to improved choroidal penetration at longer wavelengths. The corresponding OCTA image (b) shows a relatively normal CC with little, if any, dropout of the CC.
Fig. 2
Fig. 2
Fundus autofluorescence, OCT and OCTA in a 75-year-old patient with nonexudative age-related macular degeneration with geographic atrophy (GA). The fundus autofluorescence (a) and mean en face projection of the entire OCT volume (b) clearly show the region of GA, outlined by the yellow dashed contour (b). The GA region appears lighter due to increased light penetration into the choroid caused by retinal pigment epithelium atrophy. c The mean en face projection of the OCTA volume through the depths spanned by the retinal vasculature; the vasculature appears normal. (d) A 4.4-μm-thick en face OCTA slab at the CC level obtained using a 1.5-ms interscan time. The yellow dashed contour from (b) is superimposed, and a severe CC alteration appears within it. The severe CC alteration is also evident outside of the GA margin, (e) The same 4.4-μm-thick en face OCTA CC slab as (d), obtained using a 5.0-ms interscan time. Note how some areas with a low decorrelation signal (d) have increased decorrelation (e), suggesting flow impairment rather than complete atrophy. Enlarged views of the solid orange and green boxes (d, e) are shown (f, g), respectively. Note that some choroidal vessels that are not visible (f) become visible (g). Enlarged views of the dashed orange and green boxes (d, e) are shown (h, i), respectively. Note that some of the regions with low decorrelation signals (h) have higher decorrelation signals (i), suggesting flow impairment along the GA margin. OCT (top) and OCTA (bottom) B-scans through the red, blue, and purple horizontal dashed lines (d) are shown (j–l), respectively. All scale bars are 1 mm.
Fig. 3
Fig. 3
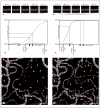
Variable interscan time analysis. OCTA images are generated using 5 repeated B-scans at the same location, with a time interval of 1.5 ms between each scan. Comparisons between B-scans are used to generate the decorrelation signal. Decorrelation signals can be generated by comparing adjacent B-scans, with an interscan time of 1.5 ms (a), or between every second B-scan, increasing the interscan time to 3 ms (d). Figures (b, e) show schematic representations of how the decorrelation signal varies with the erythrocyte flow speed. Areas with no flow generate a decorrelation signal that appears black, while areas with high flow appear as white on OCTA. The dynamic range of OCTA for each interscan time is marked with brackets, indicating the slowest detectable flow and the fastest distinguishable flow. The asterisk, square, and circle indicate three hypothetical flow speeds. The slow flow, marked with the asterisk, does not fall within the OCTA dynamic range with the 1,5-ms interscan time, and it cannot be seen on the corresponding OCTA (c). However, when the interscan time is increased to 3 ms, this slow flow can be visualized. When the interscan time is increased to 3 ms, many vessels are visible that are either partially visible or absent on OCTA with an interscan time of 1.5 ms (d). Conversely, comparing OCTA with a 3.0-ms interscan time to OCTA with a 1.5-ms interscan time identifies area of flow impairment that are not distinguishable on the image obtained with a 3.0-ms interscan time alone. The scale bars are 250 μm, and the images are enlarged views from a 6 × 6 mm field of view.

References

    1. Velez-Montoya R, Oliver SC, Olson JL, Fine SL, Quiroz-Mercado H, Mandava N. Current knowledge and trends in age-related macular degeneration: genetics, epidemiology, and prevention. Retina. 2014;34:423–441. - PubMed
    1. Friedman DS, OColmain BJ, Munoz B, Tomany SC, McCarty C, de Jong PT, et al. Prevalence of age-related macular degeneration in the United States. Arch Ophthalmol. 2004;122:564–572. - PubMed
    1. Fleckenstein M, Schmitz-Valckenberg S, Adrion C, Kramer I, Eter N, Helb HM, et al. Tracking progression with spectral-domain optical coherence tomography in geographic atrophy caused by age-related macular degeneration. Invest Ophthalmol Vis Sci. 2010;51:3846–3852. - PubMed
    1. Nunes RP, Gregori G, Yehoshua Z, Stetson PF, Feuer W, Moshfeghi AA, et al. Predicting the progression of geographic atrophy in age-related macular degeneration with SD-OCT en face imaging of the outer retina. Ophthalmic Surg Lasers Imaging Retina. 2013;44:344–359. - PubMed
    1. Klein R, Klein BE, Linton KL. Prevalence of age-related maculopathy. The Beaver Dam Eye Study. Ophthalmology. 1992;99:933–943. - PubMed

MeSH terms