

A Neurophysiological Approach for Evaluating Noise-Induced Sleep Disturbance: Calculating the Time Constant of the Dynamic Characteristics in the Brainstem
- PMID: 27023587
- PMCID: PMC4847031
- DOI: 10.3390/ijerph13040369
A Neurophysiological Approach for Evaluating Noise-Induced Sleep Disturbance: Calculating the Time Constant of the Dynamic Characteristics in the Brainstem
Abstract
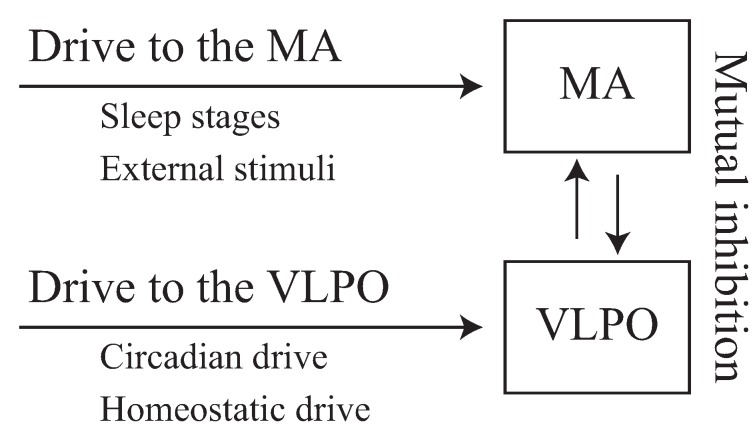
Chronic sleep disturbance induced by traffic noise is considered to cause environmental sleep disorder, which increases the risk of cardiovascular disease, stroke, diabetes and other stress-related diseases. However, noise indices for the evaluation of sleep disturbance are not based on the neurophysiological process of awakening regulated by the brainstem. In this study, through the neurophysiological approach, we attempted (1) to investigate the thresholds of awakening due to external stimuli in the brainstem; (2) to evaluate the dynamic characteristics in the brainstem and (3) to verify the validity of existing noise indices. Using the mathematical Phillips-Robinson model, we obtained thresholds of awakening in the brainstem for different durations of external stimuli. The analysis revealed that the brainstem seemed insensitive to short stimuli and that the response to external stimuli in the brainstem could be approximated by a first-order lag system with a time constant of 10-100 s. These results suggest that the brainstem did not integrate sound energy as external stimuli, but neuroelectrical signals from auditory nerve. To understand the awakening risk accumulated in the brainstem, we introduced a new concept of "awakening potential" instead of sound energy.
Keywords: Phillips–Robinson model; brainstem; neurophysiology; sleep disturbance; time constant.
Figures


Similar articles
-
Development of a new night-time noise index: Integration of neurophysiological theory and epidemiological findings.Noise Health. 2020 Jan-Mar;22(104):1-9. doi: 10.4103/nah.NAH_27_20. Noise Health. 2020. PMID: 33243962 Free PMC article.
-
Night-Time Noise Index Based on the Integration of Awakening Potential.Int J Environ Res Public Health. 2016 Mar 1;13(3):272. doi: 10.3390/ijerph13030272. Int J Environ Res Public Health. 2016. PMID: 26938546 Free PMC article.
-
Wind Turbine Noise and Sleep: Pilot Studies on the Influence of Noise Characteristics.Int J Environ Res Public Health. 2018 Nov 17;15(11):2573. doi: 10.3390/ijerph15112573. Int J Environ Res Public Health. 2018. PMID: 30453618 Free PMC article.
-
Cardiovascular effects of environmental noise exposure.Eur Heart J. 2014 Apr;35(13):829-36. doi: 10.1093/eurheartj/ehu030. Epub 2014 Mar 9. Eur Heart J. 2014. PMID: 24616334 Free PMC article. Review.
-
Event-related potentials as a measure of sleep disturbance: a tutorial review.Noise Health. 2010 Apr-Jun;12(47):137-53. doi: 10.4103/1463-1741.63216. Noise Health. 2010. PMID: 20472959 Review.
Cited by
-
Calculation of the physiologically developed nighttime noise index from existing noise indices.Noise Health. 2021 Jul-Sep;23(110):75-80. doi: 10.4103/nah.NAH_61_20. Noise Health. 2021. PMID: 34599110 Free PMC article.
-
Development of a new night-time noise index: Integration of neurophysiological theory and epidemiological findings.Noise Health. 2020 Jan-Mar;22(104):1-9. doi: 10.4103/nah.NAH_27_20. Noise Health. 2020. PMID: 33243962 Free PMC article.
References
-
- Babisch W. The noise/stress concept, risk assessment and research needs. Noise Health. 2002;4:1–11. - PubMed
-
- Passchier-Vermeer W. Night-Time Noise Events and Awakening. TNO Inro Report; Delft, The Netherlands: 2003.
-
- World Health Organization Regional Office for Europe . Night Noise Guidelines for Europe. World Health Organization Regional Office for Europe; Copenhagen, Denmark: 2009.
-
- World Health Organization Regional Office for Europe . Burden of Disease from Environmental Noise. Quantification of Healthy Life Years Lost in Europe. World Health Organization Regional Office for Europe; Copenhagen, Denmark: 2011.
Publication types
MeSH terms
LinkOut - more resources
Full Text Sources
Other Literature Sources
Medical
