

Bias and precision of methods for estimating the difference in restricted mean survival time from an individual patient data meta-analysis
- PMID: 27025706
- PMCID: PMC4812643
- DOI: 10.1186/s12874-016-0137-z
Bias and precision of methods for estimating the difference in restricted mean survival time from an individual patient data meta-analysis
Erratum in
-
Erratum to: Bias and precision of methods for estimating the difference in restricted mean survival time from an individual patient data meta-analysis.BMC Med Res Methodol. 2016 Jun 15;16(1):71. doi: 10.1186/s12874-016-0154-y. BMC Med Res Methodol. 2016. PMID: 27306030 Free PMC article. No abstract available.
Abstract
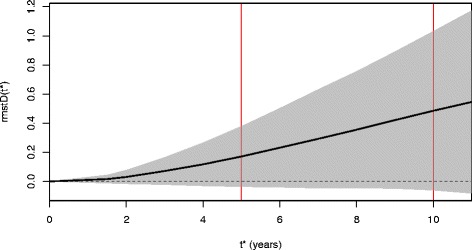
Background: The difference in restricted mean survival time ([Formula: see text]), the area between two survival curves up to time horizon [Formula: see text], is often used in cost-effectiveness analyses to estimate the treatment effect in randomized controlled trials. A challenge in individual patient data (IPD) meta-analyses is to account for the trial effect. We aimed at comparing different methods to estimate the [Formula: see text] from an IPD meta-analysis.
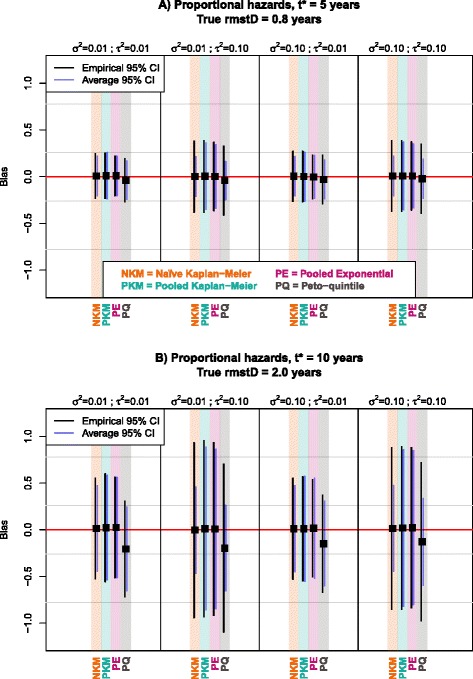
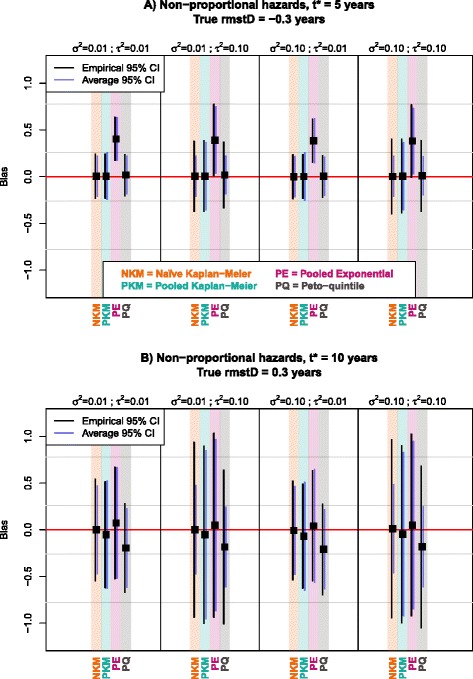
Methods: We compared four methods: the area between Kaplan-Meier curves (experimental vs. control arm) ignoring the trial effect (Naïve Kaplan-Meier); the area between Peto curves computed at quintiles of event times (Peto-quintile); the weighted average of the areas between either trial-specific Kaplan-Meier curves (Pooled Kaplan-Meier) or trial-specific exponential curves (Pooled Exponential). In a simulation study, we varied the between-trial heterogeneity for the baseline hazard and for the treatment effect (possibly correlated), the overall treatment effect, the time horizon [Formula: see text], the number of trials and of patients, the use of fixed or DerSimonian-Laird random effects model, and the proportionality of hazards. We compared the methods in terms of bias, empirical and average standard errors. We used IPD from the Meta-Analysis of Chemotherapy in Nasopharynx Carcinoma (MAC-NPC) and its updated version MAC-NPC2 for illustration that included respectively 1,975 and 5,028 patients in 11 and 23 comparisons.
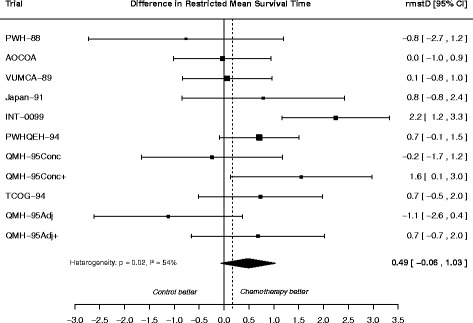
Results: The Naïve Kaplan-Meier method was unbiased, whereas the Pooled Exponential and, to a much lesser extent, the Pooled Kaplan-Meier methods showed a bias with non-proportional hazards. The Peto-quintile method underestimated the [Formula: see text], except with non-proportional hazards at [Formula: see text]= 5 years. In the presence of treatment effect heterogeneity, all methods except the Pooled Kaplan-Meier and the Pooled Exponential with DerSimonian-Laird random effects underestimated the standard error of the [Formula: see text]. Overall, the Pooled Kaplan-Meier method with DerSimonian-Laird random effects formed the best compromise in terms of bias and variance. The [Formula: see text] estimated with the Pooled Kaplan-Meier method was 0.49 years (95% CI: [-0.06;1.03], p = 0.08) when comparing radiotherapy plus chemotherapy vs. radiotherapy alone in the MAC-NPC and 0.59 years (95% CI: [0.34;0.84], p < 0.0001) in the MAC-NPC2.
Conclusions: We recommend the Pooled Kaplan-Meier method with DerSimonian-Laird random effects to estimate the difference in restricted mean survival time from an individual-patient data meta-analysis.
Keywords: Meta-analysis; Multicenter clinical trial; Restricted mean survival time; Simulation study; Survival analysis; Survival benefit.
Figures
Similar articles
-
Chemotherapy and radiotherapy in nasopharyngeal carcinoma: an update of the MAC-NPC meta-analysis.Lancet Oncol. 2015 Jun;16(6):645-55. doi: 10.1016/S1470-2045(15)70126-9. Epub 2015 May 6. Lancet Oncol. 2015. PMID: 25957714
-
[Meta-analysis of the Italian studies on short-term effects of air pollution].Epidemiol Prev. 2001 Mar-Apr;25(2 Suppl):1-71. Epidemiol Prev. 2001. PMID: 11515188 Italian.
-
Concurrent chemoradiotherapy vs radiotherapy alone in stage II nasopharyngeal carcinoma: phase III randomized trial.J Natl Cancer Inst. 2011 Dec 7;103(23):1761-70. doi: 10.1093/jnci/djr432. Epub 2011 Nov 4. J Natl Cancer Inst. 2011. PMID: 22056739 Clinical Trial.
-
Kaplan-Meier Survival Analysis Overestimates the Risk of Revision Arthroplasty: A Meta-analysis.Clin Orthop Relat Res. 2015 Nov;473(11):3431-42. doi: 10.1007/s11999-015-4235-8. Clin Orthop Relat Res. 2015. PMID: 25804881 Free PMC article. Review.
-
Chemotherapy in locally advanced nasopharyngeal carcinoma: an individual patient data meta-analysis of eight randomized trials and 1753 patients.Int J Radiat Oncol Biol Phys. 2006 Jan 1;64(1):47-56. doi: 10.1016/j.ijrobp.2005.06.037. Int J Radiat Oncol Biol Phys. 2006. PMID: 16377415 Review.
Cited by
-
Impact of thoracic radiotherapy timing in limited-stage small-cell lung cancer: usefulness of the individual patient data meta-analysis.Ann Oncol. 2016 Oct;27(10):1818-28. doi: 10.1093/annonc/mdw263. Epub 2016 Jul 19. Ann Oncol. 2016. PMID: 27436850 Free PMC article. Review.
-
Development of hypertensive complications in oocyte donation pregnancy: protocol for a systematic review and individual participant data meta-analysis (DONOR IPD).BMJ Open. 2022 Jul 18;12(7):e059594. doi: 10.1136/bmjopen-2021-059594. BMJ Open. 2022. PMID: 35851011 Free PMC article.
-
IPDfromKM: reconstruct individual patient data from published Kaplan-Meier survival curves.BMC Med Res Methodol. 2021 Jun 1;21(1):111. doi: 10.1186/s12874-021-01308-8. BMC Med Res Methodol. 2021. PMID: 34074267 Free PMC article.
-
Survival and safety after neoadjuvant chemotherapy or upfront surgery for locally advanced colon cancer: meta-analysis.Br J Surg. 2024 Jan 31;111(2):znae021. doi: 10.1093/bjs/znae021. Br J Surg. 2024. PMID: 38381934 Free PMC article.
-
Role of chemotherapy in 5000 patients with head and neck cancer treated by curative surgery: A subgroup analysis of the meta-analysis of chemotherapy in head and neck cancer.Oral Oncol. 2019 Aug;95:106-114. doi: 10.1016/j.oraloncology.2019.06.001. Epub 2019 Jun 15. Oral Oncol. 2019. PMID: 31345376 Free PMC article.
References
Publication types
MeSH terms
Substances
LinkOut - more resources
Full Text Sources
Other Literature Sources
