. 2016 Mar 30:6:23568.
doi: 10.1038/srep23568.

Dorso-Lateral Frontal Cortex of the Ferret Encodes Perceptual Difficulty during Visual Discrimination

Affiliations

Dorso-Lateral Frontal Cortex of the Ferret Encodes Perceptual Difficulty during Visual Discrimination

Zhe Charles Zhou et al. Sci Rep. .

Abstract

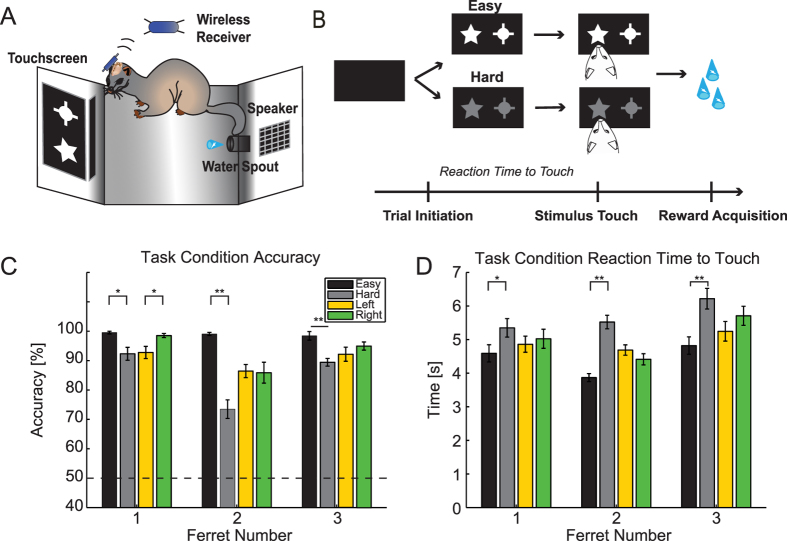
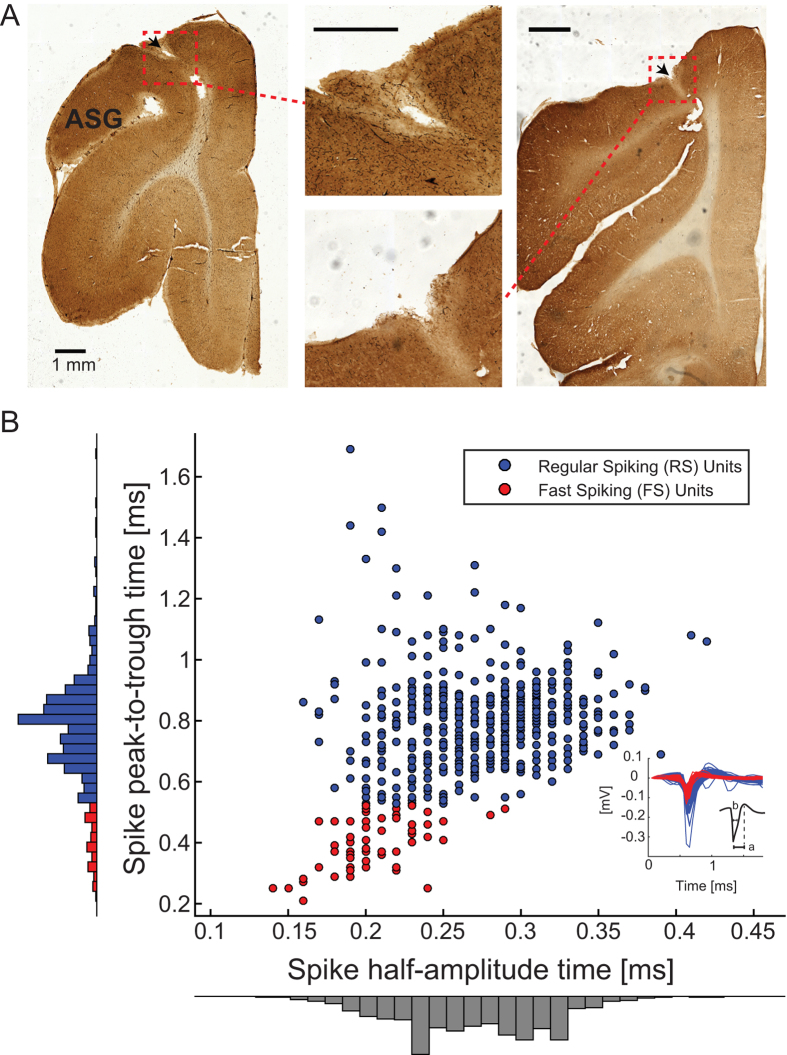
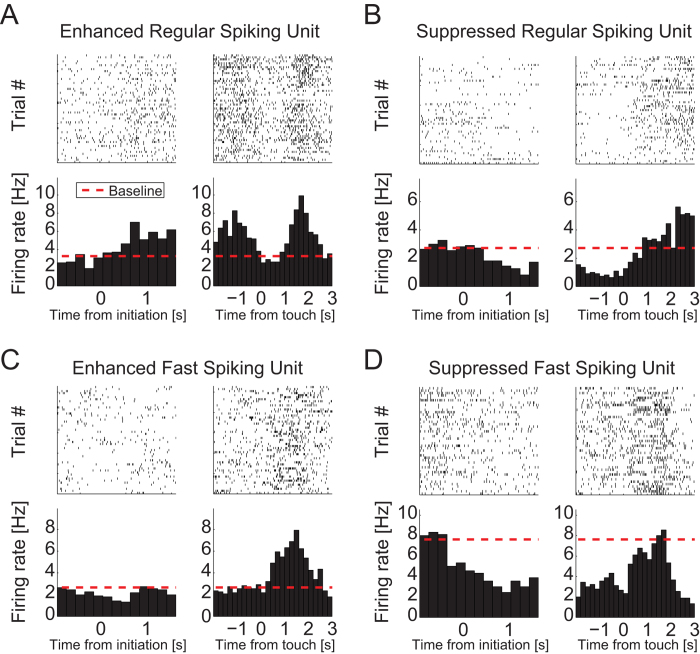
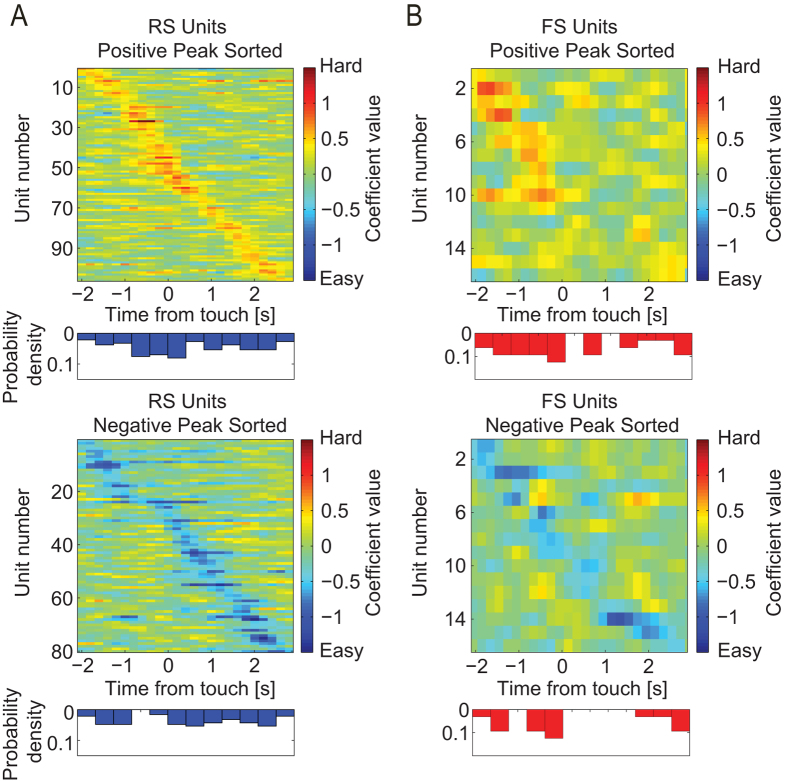
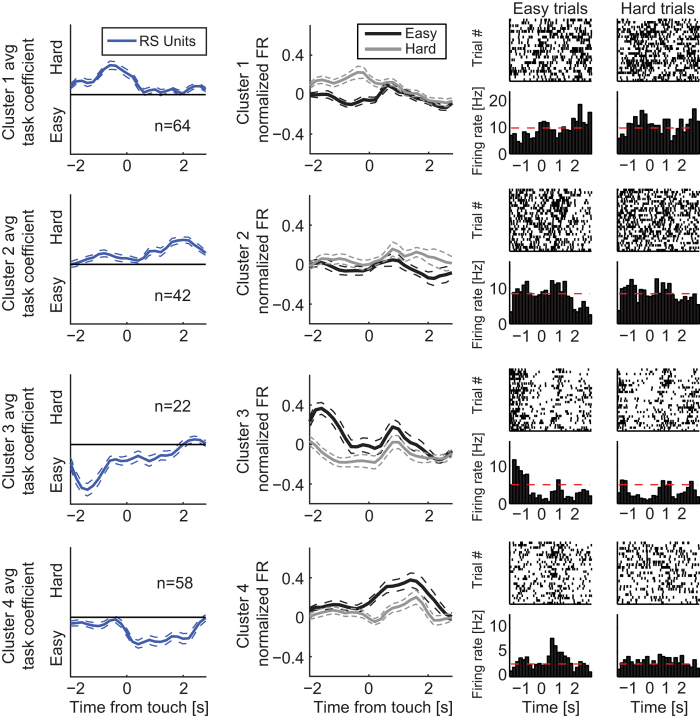
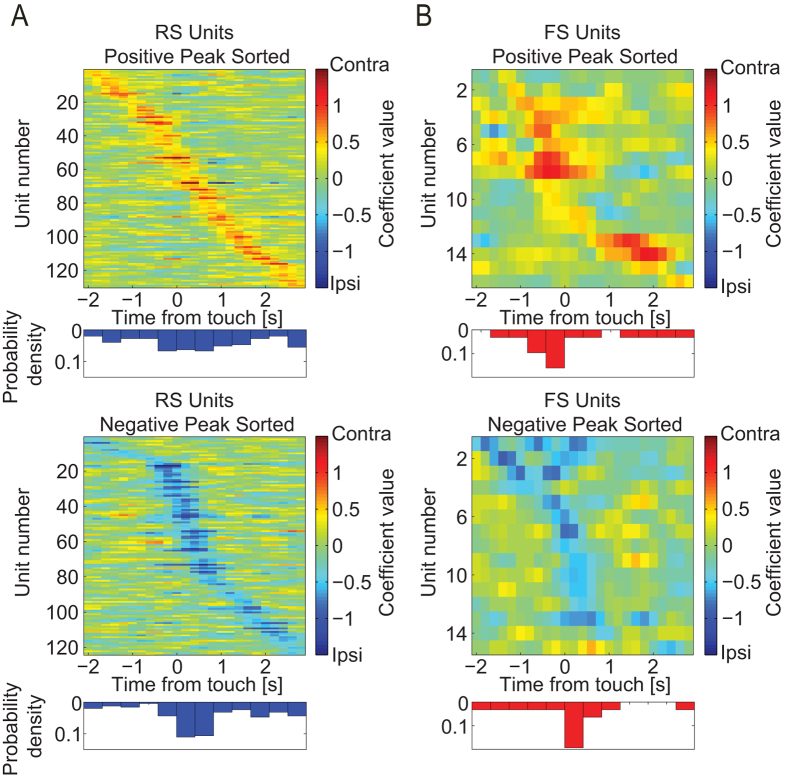
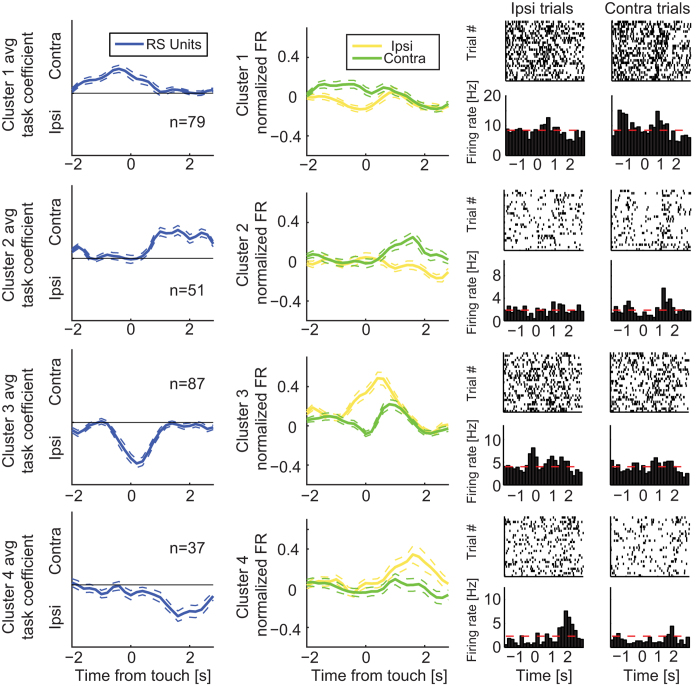
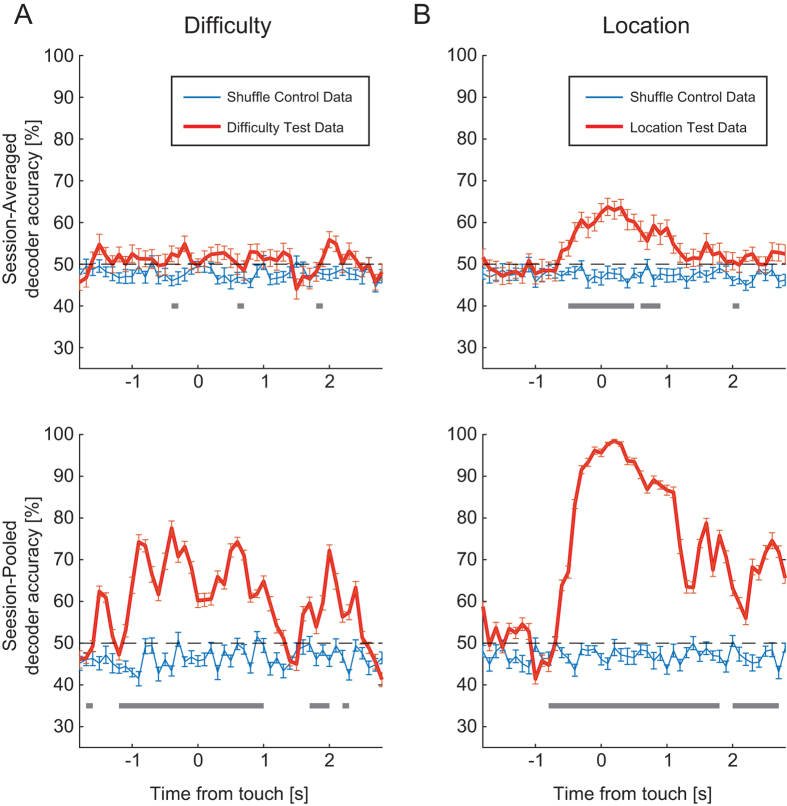
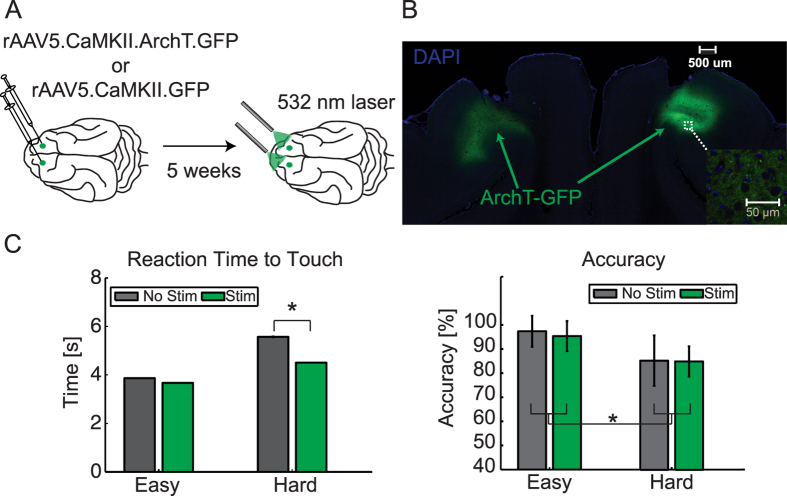
Visual discrimination requires sensory processing followed by a perceptual decision. Despite a growing understanding of visual areas in this behavior, it is unclear what role top-down signals from prefrontal cortex play, in particular as a function of perceptual difficulty. To address this gap, we investigated how neurons in dorso-lateral frontal cortex (dl-FC) of freely-moving ferrets encode task variables in a two-alternative forced choice visual discrimination task with high- and low-contrast visual input. About two-thirds of all recorded neurons in dl-FC were modulated by at least one of the two task variables, task difficulty and target location. More neurons in dl-FC preferred the hard trials; no such preference bias was found for target location. In individual neurons, this preference for specific task types was limited to brief epochs. Finally, optogenetic stimulation confirmed the functional role of the activity in dl-FC before target touch; suppression of activity in pyramidal neurons with the ArchT silencing opsin resulted in a decrease in reaction time to touch the target but not to retrieve reward. In conclusion, dl-FC activity is differentially recruited for high perceptual difficulty in the freely-moving ferret and the resulting signal may provide top-down behavioral inhibition.


Figures

Figure 1
Figure 1. Experimental task design and behavioral performance.
(A) Operant behavioral chamber. Ferrets were trained to perform a visual discrimination task in an operant chamber fitted with a touchscreen monitor. Ferrets initiated trials by nose-poking an infrared sensor positioned within the water spout in the rear of the chamber. Upon water release after nose-poke of the correct stimulus, the animal returned to the spout for reward acquisition. Neural activity was recorded using a wireless headstage. Visual stimuli shown in the figure are similar to the ones used in the study. (B) Two-alternative forced choice, visual discrimination task. Upon initiation of a trial at the water spout, an image pair was simultaneously presented in the left and right windows of the touchscreen. Trials were randomly interleaved with easy and hard image pairs. Nose-poke to the conditioned stimulus window triggered a tone and a water reward at the spout. (C) Mean accuracy performance in “easy” (black), “hard” (gray), “left” (yellow), and “right” (green) trials for each ferret. The dashed line represents chance performance. Error bars, standard error of the mean (SEM) across sessions. *p < 0.05; **p < 0.01. (D) Mean reaction time to target touch in easy (black), hard (gray), left (yellow), and right (green) trials for each ferret. Error bars, SEM across trials. *p < 0.05; **p < 0.001.
Figure 2
Figure 2. Classification of single unit cell types.
(A) Coronal sections of FC stained for cytochrome c oxidase for histological verification of recording sites. Left and right images show locations of electrolytic lesions within red boxes. Middle images show electrode insertion site at higher magnification. Black arrows indicate the insertion points of the electrode arrays. Data from two animals are shown, histology from third animal shown in Supplementary Fig. S1. Black scale bars represent 1 mm. (B) Action potential duration was characterized by half-amplitude time (x-axis) and peak-to-trough time (y-axis). Single units were classified as presumed regular spiking (RS) or fast spiking (FS) based on the 10th percentile cut-off point in peak-to-trough times. RS units (blue) were identified by long duration (>0.52 ms). FS units (red) were identified by short duration <0.52 ms. Inset: Average waveforms of identified RS (blue) and FS (red) units. Spike peak-to-trough time (a) and half-amplitude time (b) are shown for the black sample waveform.
Figure 3
Figure 3. Dynamics of task-modulated single units.
Rasterplots and corresponding raw FR PETHs of example task-modulated SUs. Activity is aligned to initiation (left column) and target touch (right column). Plots aligned to initiation and target touch are not continuous due to variable response times across trials. Behavioral epochs are defined, relative to target touch, as follows: stimulus viewing (−2 to −0.5 seconds), stimulus touch (−0.5 to 0.5 seconds), reward acquisition (0.5 to 3 seconds). Dashed red lines indicate average baseline activity levels. (A) RS unit with increased activity prior to stimulus touch and during reward acquisition. (B) RS unit with activity suppression during stimulus viewing. (C) FS unit with increased activity during reward acquisition. (D) FS unit with suppression during the stimulus viewing epoch.
Figure 4
Figure 4. Coefficient time-series of task difficulty preference.
(A) Heat maps and corresponding probability density functions of regression coefficient time-series extracted from the linear model for populations of RS units with difficulty preference. Positive and negative peak sorted (top and bottom, respectively) time-series heat maps and corresponding probability density functions. Time-series are aligned to target touch. (B) FS units exhibiting difficulty preference. Same representation as in Panel (A).
Figure 5
Figure 5. Dynamics of units with difficulty preference.
Coefficient time-series, PETHs, and sample rastergrams of RS units clustered by coefficient peak times. Rows correspond to clusters of units grouped by linkage analysis. Left column: Coefficient time-series averaged across units. Middle column: Normalized PETHs averaged across units for easy and hard conditions. Right column: Rastergrams and corresponding PETHs of easy and hard trials for a sample unit in each cluster; dashed red lines indicate average baseline activity levels. All plots are aligned to target touch. Upper and lower dotted lines indicate SEM across units, n indicates number of SUs.
Figure 6
Figure 6. Coefficient time-series of location preference.
(A) Heat maps and corresponding probability density functions of regression coefficient time-series extracted from the linear model for populations of RS units with CS+ location preference. Positive and negative peak sorted (top and bottom, respectively) time-series heat maps and corresponding probability density functions. Time-series are aligned to target touch. (B) FS units exhibiting location preference. Same representation as in Panel (A).
Figure 7
Figure 7. Dynamics of units with target location preference.
Coefficient time-series, PETHs, and sample rastergrams of RS units clustered by coefficient peak times. Rows correspond to clusters of units grouped by linkage analysis. Left column: Coefficient time-series averaged across units. Middle column: Normalized PETHs averaged across units for ipsilateral and contralateral conditions. Right column: Rastergrams and corresponding PETHs of ipsilateral and contralateral trials for a sample unit in each cluster; dashed red lines indicate average baseline activity levels. All plots are aligned to target touch. Upper and lower dotted lines indicate SEM across units, n indicates number of neurons.
Figure 8
Figure 8. Population Coding of Task Properties.
(A) Support vector machine analysis was used to establish whether population activity encodes task properties. Top: Session- and animal- averaged decoding accuracies are aligned to target touch. The test data decoding performance is represented by the red line. Shuffle control performance, which was calculated by performing the SVM analysis using shuffled trial identifiers, is plotted in blue. Bottom: Mean decoding accuracy of the session-pooled SVM analysis (SUs pooled across sessions and animals). For each session, a random subset of trials (n = 20) from each condition was included in the model. We computed multiple iterations of the SVM (n = 15) for test data (red lines) and shuffle control data (blue lines). Gray blocks represent statistically significant epochs (paired t-test, p < 0.05, Bonferroni-corrected). Error bars, SEM across units. (B) Same representations and conventions as in panel (A) for location decoding.
Figure 9
Figure 9. Optogenetics experiment and behavioral performance.
(A) ArchT experimental design. dl-FC of animals were injected bilaterally with either rAAV5.CaMKII.ArchT.GFP or rAAV5.CaMKII.GFP constructs. Virus was allowed to express for 4 weeks before behavioral experiments. Animals performed the same visual discrimination task as the electrophysiology experiment with the exception that sessions were composed of counterbalanced trials with left/right and stimulation/no-stimulation. Difficulty conditions were designated at the level of session for these optogenetics experiments. During stimulation trials, 532 nm light (15–25 mW) was delivered bilaterally through ceramic-ferrule patch cables during the stimulus presentation epoch (from trial initiation to stimulus touch) or during reward retrieval (from stimulus touch to reward acquisition). (B) Coronal section from dl-FC of ArchT animal A for histological verification of virus expression. DAPI stain shown in blue and ArchT.GFP expression shown in green. Inset: 20× close-up of the expression outlined by the white box. Images were acquired with a confocal microscope. (C) Accuracy (left) and reaction time to target touch (right) of the ArchT animal in (B). Means pooled across trials and sessions for each condition (split by easy/hard and no-stim/stim) shown as bars. Error bars, SEM across trials. *p < 0.05.

Similar articles

Cited by

References

    1. Fuster J. M. The Prefrontal Cortex. Creativity 1, 410 (2008).
    1. Jacobson S., Butters N. & Tovsky N. J. Afferent and efferent subcortical projections of behaviorally defined sectors of prefrontal granular cortex. Brain Res 159, 279–296 (1978). - PubMed
    1. Pandya D. N. & Kuypers H. G. Cortico-cortical connections in the rhesus monkey. Brain Res 13, 13–36 (1969). - PubMed
    1. Yeterian E. H., Pandya D. N., Tomaiuolo F. & Petrides M. The cortical connectivity of the prefrontal cortex in the monkey brain. Cortex 48, 58–81 (2012). - PMC - PubMed
    1. Funahashi S., Chafee M. V. & Goldman-Rakic P. S. Prefrontal neuronal activity in rhesus monkeys performing a delayed anti-saccade task. Nature 365, 753–756 (1993). - PubMed

Publication types

LinkOut - more resources