. 2016 Mar 29:13:16.
doi: 10.1186/s12989-016-0127-7.

Multi-walled carbon nanotube induces nitrative DNA damage in human lung epithelial cells via HMGB1-RAGE interaction and Toll-like receptor 9 activation

Affiliations

Multi-walled carbon nanotube induces nitrative DNA damage in human lung epithelial cells via HMGB1-RAGE interaction and Toll-like receptor 9 activation

Yusuke Hiraku et al. Part Fibre Toxicol. .

Abstract

Background: Carbon nanotube (CNT) is used for various industrial purposes, but exhibits carcinogenic effects in experimental animals. Chronic inflammation in the respiratory system may participate in CNT-induced carcinogenesis. 8-Nitroguanine (8-nitroG) is a mutagenic DNA lesion formed during inflammation. We have previously reported that multi-walled CNT (MWCNT) induced 8-nitroG formation in lung epithelial cells and this process involved endocytosis. To clarify the mechanism of CNT-induced carcinogenesis, we examined the role of Toll-like receptor (TLR) 9, which resides in endosomes and lysosomes, in 8-nitroG formation in human lung epithelial cell lines.

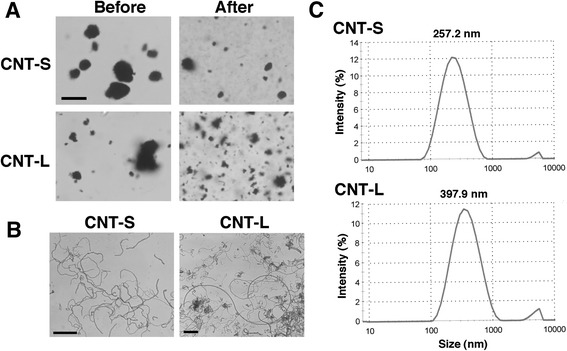
Methods: We performed immunocytochemistry to examine 8-nitroG formation in A549 and HBEpC cells treated with MWCNT with a length of 1-2 μm (CNT-S) or 5-15 μm (CNT-L) and a diameter of 20-40 nm. We examined inhibitory effects of endocytosis inhibitors, small interfering RNA (siRNA) for TLR9, and antibodies against high-mobility group box-1 (HMGB1) and receptor for advanced glycation end-products (RAGE) on 8-nitroG formation. The release of HMGB1 and double-stranded DNA (dsDNA) into the culture supernatant from MWCNT-treated cells was examined by ELISA and fluorometric analysis, respectively. The association of these molecules was examined by double immunofluorescent staining and co-immunoprecipitation.

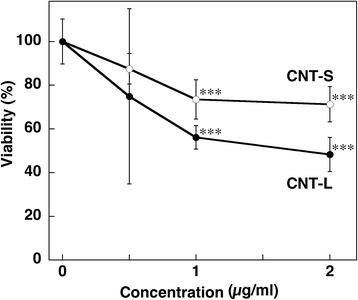
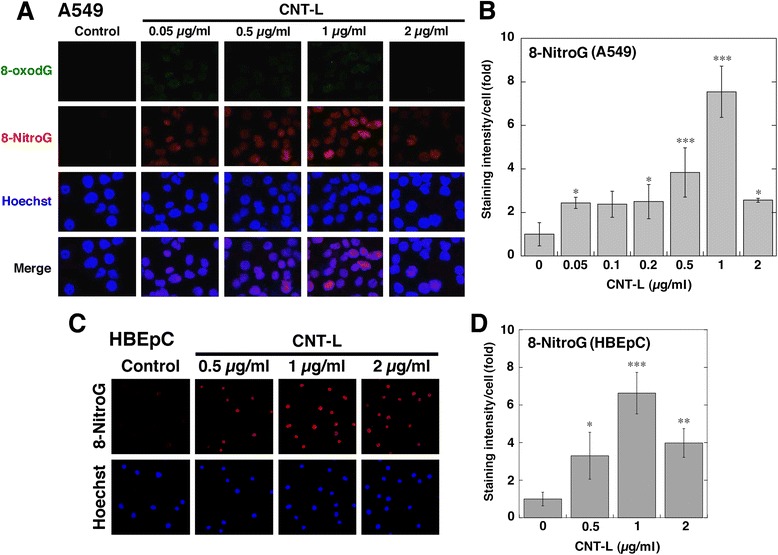
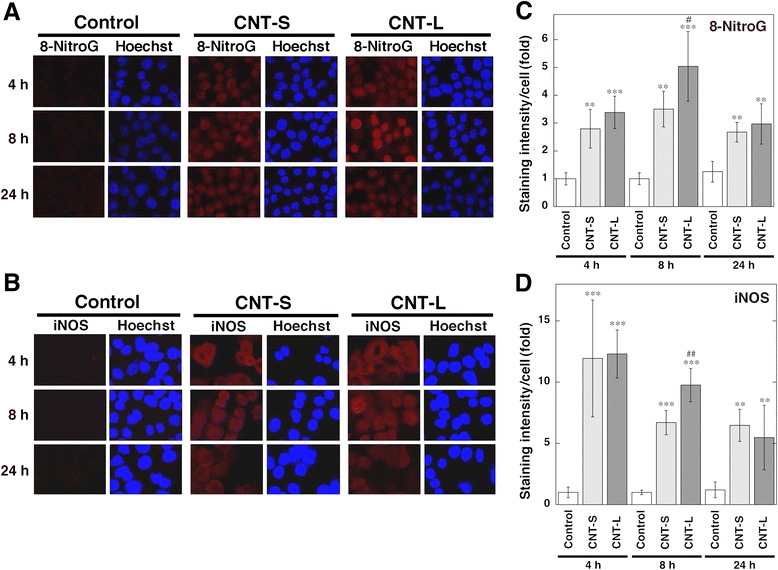
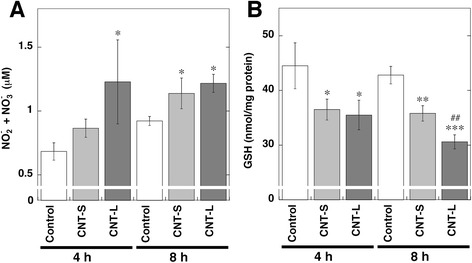
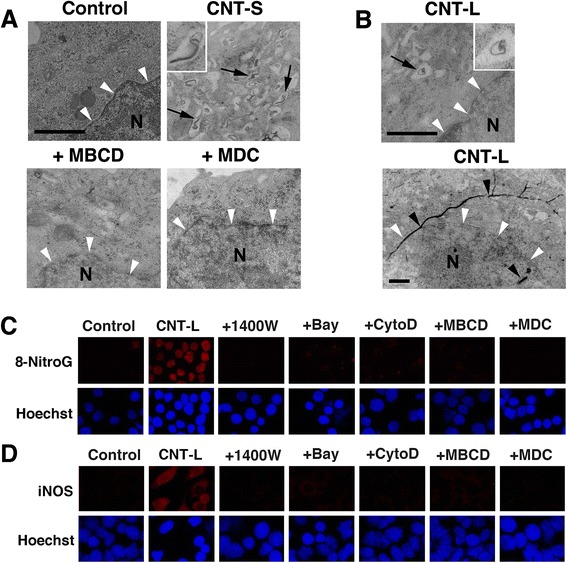
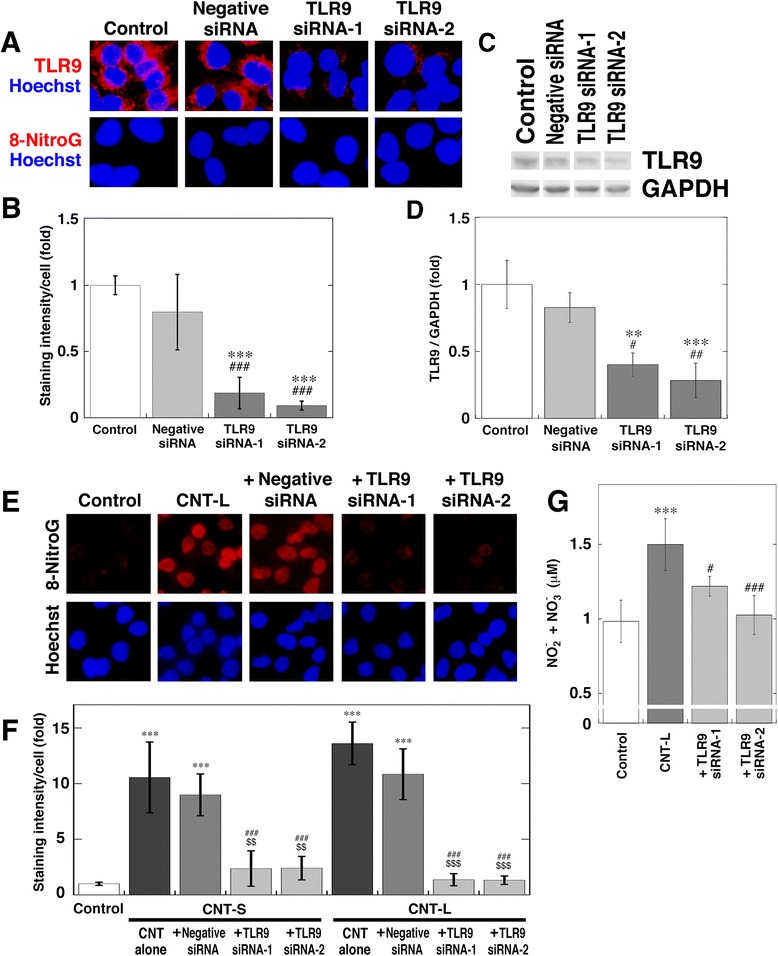
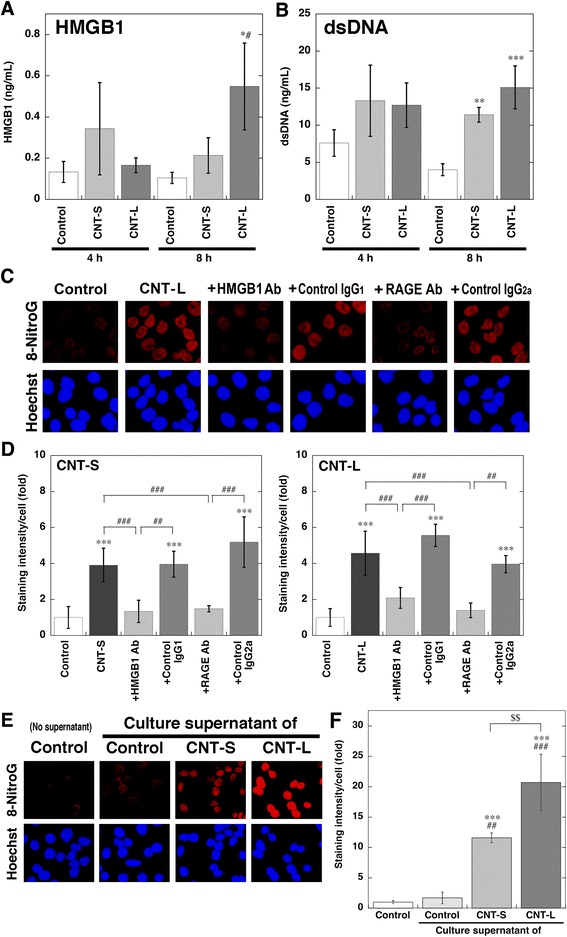
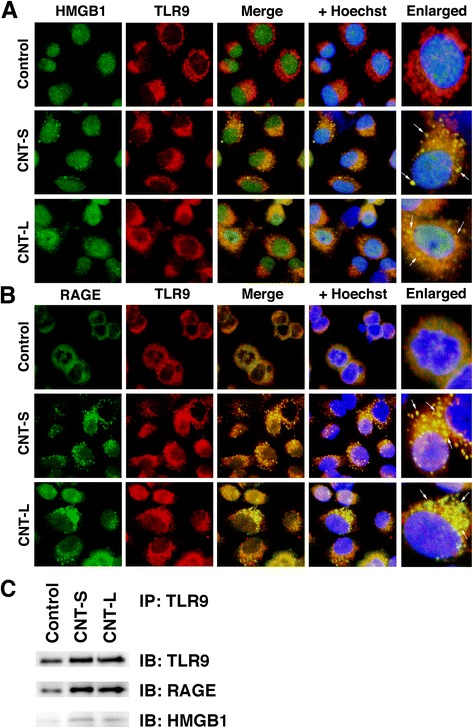
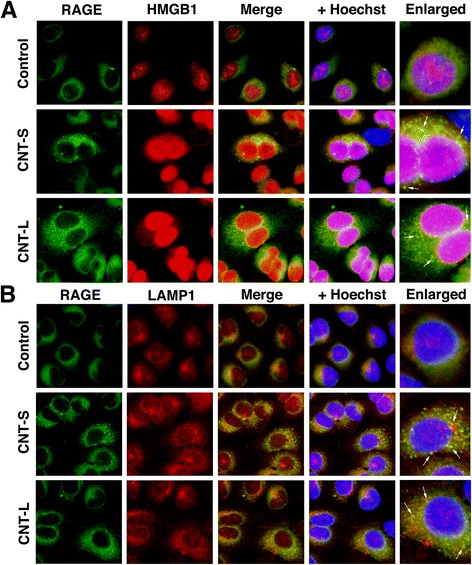
Results: CNT-L significantly increased 8-nitroG formation at 0.05 μg/ml in A549 cells and its intensity reached a maximum at 1 μg/ml. CNT-L tended to induce stronger cytotoxicity and 8-nitroG formation than CNT-S. Endocytosis inhibitors, TLR9 siRNA and antibodies against HMGB1 and RAGE largely reduced MWCNT-induced 8-nitroG formation. MWCNT increased the release of HMGB1 and dsDNA from A549 cells into culture supernatant. The culture supernatant of MWCNT-exposed cells induced 8-nitroG formation in fresh A549 cells. Double immunofluorescent staining and co-immunoprecipitation showed that TLR9 was associated with HMGB1 and RAGE in lysosomes of MWCNT-treated cells.

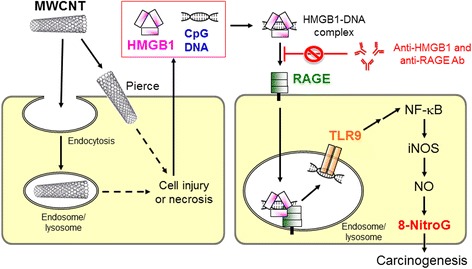
Conclusions: MWCNT induces injury or necrosis of lung epithelial cells, which release HMGB1 and DNA into the extracellular space. The HMGB1-DNA complex binds to RAGE on neighboring cells and then CpG DNA is recognized by TLR9 in lysosomes, leading to generation of nitric oxide and 8-nitroG formation. This is the first study demonstrating that TLR9 and related molecules participate in MWCNT-induced genotoxicity and may contribute to carcinogenesis.

Keywords: 8-nitroguanine; Carbon nanotube; Carcinogenesis; Cytotoxicity; DNA damage; Endocytosis; High-mobility group box-1, Receptor for advanced glycation end-products, Toll-like receptor; Nitric oxide.


Figures

Fig. 1
Fig. 1
Dispersion of MWCNT agglomerates. MWCNT was suspended in DMEM and sonicated as described in Methods. a Photographs of MWCNT agglomerates before and after the sonication. The particles were observed with a light microscope. Bar = 10 μm. b Photographs of MWCNT fibers. After the sonication, MWCNT was observed with TEM as described in Methods. Bars = 1 μm. c Size distribution of dispersed MWCNT agglomerates. The size distribution was measured with a Zetasizer Nano particle size analyzer (Malvern, Worcestershire, UK)
Fig. 2
Fig. 2
Cytotoxic effect of MWCNT. A549 cells were treated with 1 μg/ml MWCNT for 24 h at 37 °C, and the cell viability was examined by MTT assay as described in Methods. Viability of the control cells was set at 100 %. Data represent means ± SD of 4-6 independent experiments. ***p < 0.001, compared with the control by two-way ANOVA followed by Tukey’s test
Fig. 3
Fig. 3
DNA damage in CNT-L-treated cells. a Immunofluorescent images of CNT-L-induced 8-oxodG and 8-nitroG formation in A549 cells. A549 cells were treated with CNT-L at indicated concentrations for 8 h at 37 °C, and 8-oxodG and 8-nitroG formation was examined by double immunofluorescent technique as described in Methods. Hoechst, Hoechst 33258. Magnification, X200. b Relative staining intensity of 8-nitroG formed in CNT-L-treated A549 cells. Staining intensity per cell was analyzed by an ImageJ software. Relative staining intensity of the control was set at 1. Data represent means ± SD of 8 (control) or 4 (CNT-L) independent experiments. *p < 0.05 and ***p < 0.001, compared with the control. c 8-NitroG formation in CNT-L-treated HBEpC cells. HBEpC cells were treated with CNT-L at indicated concentrations for 4 h at 37 °C, and immunofluorescent technique was performed. Magnification, X100. d Relative staining intensity of 8-nitroG formed in CNT-L-treated HBEpC cells. Data were quantitatively analyzed as described in (b). Data represent means ± SD of 3-4 independent experiments. *p < 0.05, **p < 0.01 and ***p < 0.001, compared with the control. Statistical analysis was performed by ANOVA followed by Tukey’s test
Fig. 4
Fig. 4
Time course of 8-nitroG formation and iNOS expression in MWCNT-treated cells. Immunofluorescent images of 8-nitroG formation (a) and iNOS expression (b) in MWCNT-treated A549 cells. A549 cells were treated with 1 μg/ml MWCNT for indicated durations at 37 °C, and 8-nitroG formation and iNOS expression were examined by fluorescent immunocytochemistry as described in Methods. Hoechst, Hoechst 33258. Magnification, X200. (c, d) Relative staining intensity of 8-nitroG and iNOS in A549 cells. Staining intensities of 8-nitroG (c) and iNOS (d) per cell were analyzed by an ImageJ software. Relative staining intensity of the control at 4 h was set at 1. Data represent means ± SD of 4 (control) and 6 (CNT-S and CNT-L) independent experiments. **p < 0.01 and ***p < 0.001, compared with the control; # p < 0.05 and ## p < 0.01, compared with CNT-S-treated cells by ANOVA followed by Tukey’s test
Fig. 5
Fig. 5
NO release and GSH decrease in MWCNT-treated cells. A549 cells were treated with 1 μg/ml MWCNT for indicated durations at 37 °C. a NO release from MWCNT-treated cells. The concentrations of NO2 - and NO3 - in culture supernatant were measured by the Griess method as described in Methods. b Decrease of GSH contents in MWCNT-treated cells. Intracellular GSH contents were measured with HPLC coupled with an ECD as described in Methods. Data represent means ± SD of 3 independent experiments. *p < 0.05, **p < 0.01 and ***p < 0.001, compared with the control; ## p < 0.01, compared with CNT-S-treated cells by ANOVA followed by Tukey’s test
Fig. 6
Fig. 6
Intracellular distribution of MWCNT and effects of endocytosis inhibitors on inflammatory responses. a Intracellular distribution of CNT-S and effects of endocytosis inhibitors. A549 cells were incubated with 1 μg/ml of CNT-S for 4 h at 37 °C. In certain experiments, the cells were pretreated with 2 mM MBCD or 50 μM MDC for 30 min. Then the cells were observed by TEM as described in Methods. Numerous fibers can be seen in vesicular structures in the cytosol (arrows and inset), but no or few fibers are observed in MBCD- and MDC-pretreated cells. b Intracellular distribution of CNT-L. A549 cells were incubated with 1 μg/ml of CNT-L for 4 h at 37 °C. Only a few fibers are observed in vesicular structures in the cytosol (arrow and inset), and long fibers penetrated the plasma and nuclear membranes (black arrowheads). a, b Bars = 1 μm. N = nucleus. Nuclear membrane is indicated by white arrowheads. Effects of various inhibitors on CNT-L-induced 8-nitroG formation (c) and iNOS expression (d). A549 cells were treated with 1 μg/ml of CNT-L for 8 h at 37 °C in the presence of an inhibitor (1 μM 1400 W, 10 μM Bay, 1 μM CytoD, 2 mM MBCD or 50 μM MDC). Then, fluorescent immunocytochemistry was performed as described in Methods. Hoechst, Hoechst 33258. Magnification, X200
Fig. 7
Fig. 7
Inhibitory effect of TLR9 siRNA on MWCNT-induced 8-nitroG formation. a Immunofluorescent images of reduced TLR9 expression and the absence of 8-nitroG formation in siRNA-transfected cells. A549 cells were transfected with negative control or TLR9 siRNA (siRNA-1 and siRNA-2). TLR9 expression and 8-nitroG formation were examined by fluorescent immunocytochemistry. Hoechst, Hoechst 33258. Magnification, X400. b Relative staining intensity of TLR9 in siRNA-transfected A549 cells. The staining intensity of TLR9 per cell was analyzed by an ImageJ software. Relative staining intensity of the control was set at 1. Data represent means ± SD of 4 independent experiments. ***p < 0.001, compared with the control; ### p < 0.001, compared with negative control siRNA-transfected cells. c Reduction of TLR9 expression in siRNA-transfected cells. A549 cells transfected with TLR9 siRNA were lysed and treated, and then Western blotting was performed to detect TLR9 and GAPDH as described in Methods. d Relative intensity of TLR9 expression in siRNA-transfected A549 cells. The relative band intensity of TLR9 normalized by GAPDH was measured with an ImageJ software. Data represent means ± SD of 3 independent experiments. **p < 0.01 and ***p < 0.001, compared with the control; # p < 0.05 and ## p < 0.01, compared with negative control siRNA-transfected cells. e Inhibitory effect of TLR9 siRNA on MWCNT-induced 8-nitroG formation. After siRNA transfection, A549 cells were treated with 1 μg/ml CNT-L for 8 h. 8-NitroG formation was analyzed by fluorescent immunocytochemistry. Magnification, X200. f Quantitative image analysis for effects of TLR9 siRNA on MWCNT-induced 8-nitroG formation. Staining intensity was analyzed as described in (b). Data represent means ± SD of 3-4 independent experiments. ***p < 0.001, compared with the control, ### p < 0.001, compared with MWCNT alone, $$ p < 0.01 and $$$ p < 0.001, compared with MWCNT + negative control siRNA. g Effect of TLR9 siRNA on NO release from MWCNT-exposed cells. After siRNA transfection, A549 cells were treated with 1 μg/ml CNT-L for 4 h. Data represent means ± SD of 5-6 independent experiments. ***p < 0.001, compared with the control; # p < 0.05 and ### p < 0.001, compared with CNT-L-treated cells. Statistical analysis was performed by ANOVA followed by Tukey’s test
Fig. 8
Fig. 8
Release of HMGB1 and dsDNA from MWCNT-treated cells and inhibitory effects of antibodies on 8-nitroG formation. a Release of HMGB1 from MWCNT-treated cells. A549 cells were treated with 1 μg/ml of MWCNT for indicated durations at 37 °C. Then the concentration of HMGB1 in the culture supernatant was measured by a commercial ELISA kit. b Release of dsDNA from MWCNT-treated cells. A549 cells were treated with 1 μg/ml of MWCNT at 37 °C, and the concentration of dsDNA in the culture supernatant was measured with a Quantus fluorometer. a, b Data represent means ± SD of 3 independent experiments. *p < 0.05, **p < 0.01 and ***p < 0.001 compared with the control; # p < 0.05, compared with CNT-S-treated cells. c Inhibitory effects of anti-HMGB1 and anti-RAGE antibodies on MWCNT-induced 8-nitroG formation. A549 cells were pretreated with 10 μg/ml anti-HMGB1 or anti-RAGE antibody (or corresponding control IgG) for 30 min and then treated with 1 μg/ml CNT-L for 8 h. Then fluorescent immunocytochemistry was performed as described in Methods. Hoechst, Hoechst 33258. Magnification, X200. d Quantitative image analysis for effects of the antibodies on 8-nitroG formation in MWCNT-treated cells. Staining intensity per cell was analyzed by an ImageJ software. Relative staining intensity of the control was set at 1. Data represent means ± SD of 8 (control and MWCNT alone) or 4 (MWCNT plus an antibody) independent experiments. ***p < 0.001, compared with the control; ## p < 0.01 and ### p < 0.001. e 8-NitroG formation induced by culture supernatant of MWCNT-exposed cells. A549 cells were treated with 1 μg/ml of MWCNT for 8 h, and the culture supernatant was given to fresh A549 cells, followed by incubation for 2 h at 37 °C. 8-NitroG formation was examined by fluorescent immunocytochemistry. f Quantitative image analysis for 8-nitroG formation induced by culture supernatant of MWCNT-treated cells. Staining intensity was analyzed as described in (d). Data represent means ± SD of 3-4 independent experiments. ***p < 0.001, compared with the non-treated control; ## p < 0.01 and ### p < 0.001, compared with the cells treated with control cell supernatant; $$ p < 0.01. Statistical analysis was performed by ANOVA followed by Tukey’s test
Fig. 9
Fig. 9
Association of TLR9 with HMGB1 and RAGE in MWCNT-treated cells. A549 cells were treated with 1 μg/mL MWCNT for 8 h. Double immunofluorescent analysis was performed to examine the colocalization of TLR9 with HMGB1 (a) and RAGE (b) as described in Methods. HMGB1 and RAGE were stained with the corresponding mouse monoclonal antibodies and Alexa 488-labeled goat anti-mouse IgG antibody. TLR9 was stained with the rabbit polyclonal antibody and Alexa 594-labeled goat anti-rabbit IgG antibody. Hoechst, Hoechst 33258. Magnification, X400. Arrows indicate the colocalization of TLR9 with HMGB1 or RAGE in the cytosol. c Interaction of TLR9 with RAGE and HMGB1. Immunoprecipitation (IP) was performed using anti-TLR9 rabbit polyclonal antibody and TLR9, RAGE and HMGB1 were detected by Western immunoblotting (IB). The membrane was treated with corresponding mouse monoclonal antibodies. Data are representative of 3 independent experiments
Fig. 10
Fig. 10
Colocalization of RAGE with HMGB1 and LAMP1 in MWCNT-treated cells. A549 cells were treated with 1 μg/mL MWCNT for 8 h, and then double immunofluorescent analysis was performed to examine the colocalization of RAGE with HMGB1 (a) and LAMP1, a lysosomal marker (b), as described in Methods. RAGE was stained with the mouse monoclonal antibody and Alexa 488-labeled goat anti-mouse IgG antibody. HMGB1 and LAMP were stained with the corresponding rabbit polyclonal antibodies and Alexa 594-labeled goat anti-rabbit IgG antibody. Hoechst, Hoechst 33258. Magnification, X400. Arrows indicate the colocalization of RAGE with HMGB1 or LAMP in the cytosol
Fig. 11
Fig. 11
Proposed mechanism of MWCNT-induced DNA damage

Similar articles

Cited by

References

    1. Pacurari M, Castranova V, Vallyathan V. Single- and multi-wall carbon nanotubes versus asbestos: are the carbon nanotubes a new health risk to humans? J Toxicol Environ Health A. 2010;73:378–95. doi: 10.1080/15287390903486527. - DOI - PubMed
    1. Medina C, Santos-Martinez MJ, Radomski A, Corrigan OI, Radomski MW. Nanoparticles: pharmacological and toxicological significance. Br J Pharmacol. 2007;150:552–8. doi: 10.1038/sj.bjp.0707130. - DOI - PMC - PubMed
    1. Pacurari M, Yin XJ, Zhao J, Ding M, Leonard SS, Schwegler-Berry D, et al. Raw single-wall carbon nanotubes induce oxidative stress and activate MAPKs, AP-1, NF-κB, and Akt in normal and malignant human mesothelial cells. Environ Health Perspect. 2008;116:1211–7. doi: 10.1289/ehp.10924. - DOI - PMC - PubMed
    1. Oberdörster G. Safety assessment for nanotechnology and nanomedicine: concepts of nanotoxicology. J Intern Med. 2010;267:89–105. doi: 10.1111/j.1365-2796.2009.02187.x. - DOI - PubMed
    1. Poland CA, Duffin R, Kinloch I, Maynard A, Wallace WA, Seaton A, et al. Carbon nanotubes introduced into the abdominal cavity of mice show asbestos-like pathogenicity in a pilot study. Nat Nanotechnol. 2008;3:423–8. doi: 10.1038/nnano.2008.111. - DOI - PubMed

Publication types

MeSH terms

LinkOut - more resources