. 2016 Apr 7;532(7597):64-8.
doi: 10.1038/nature17625. Epub 2016 Mar 30.

Candidalysin is a fungal peptide toxin critical for mucosal infection

Affiliations

Candidalysin is a fungal peptide toxin critical for mucosal infection

David L Moyes et al. Nature. .

Abstract

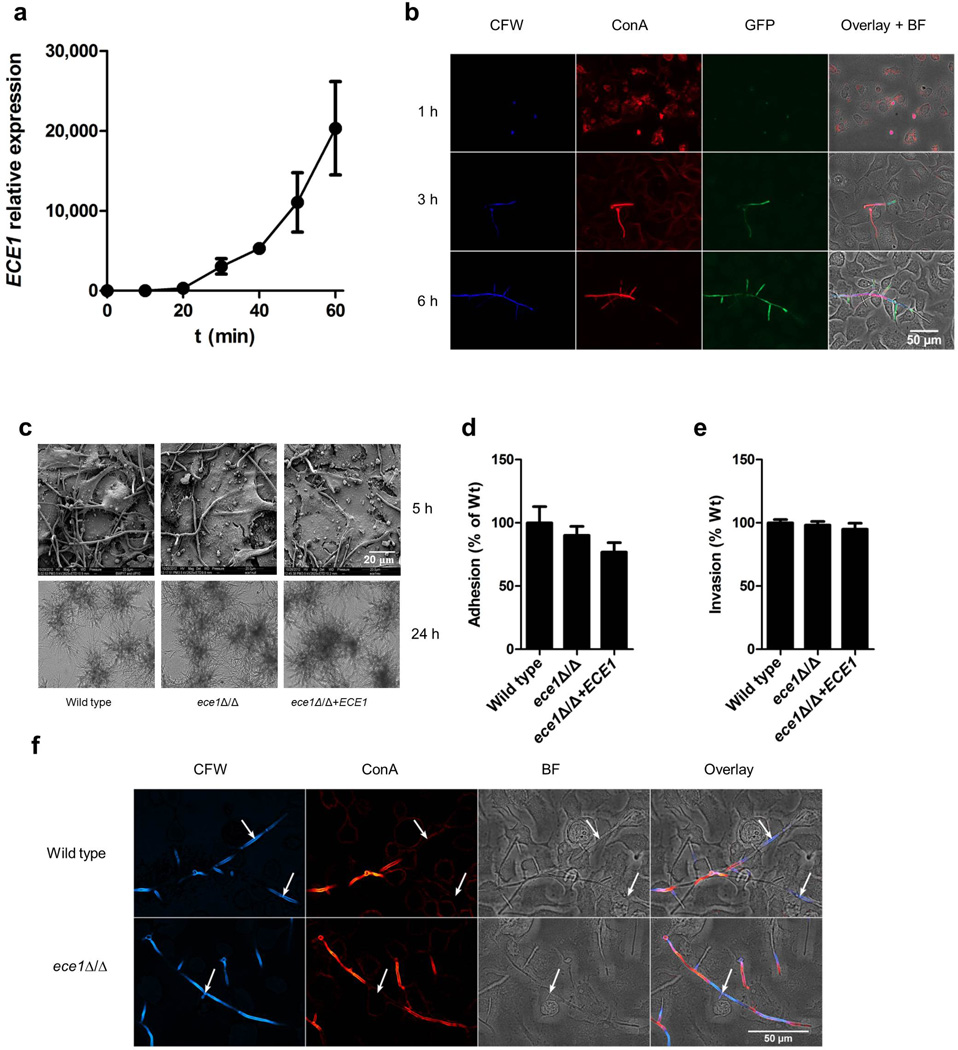
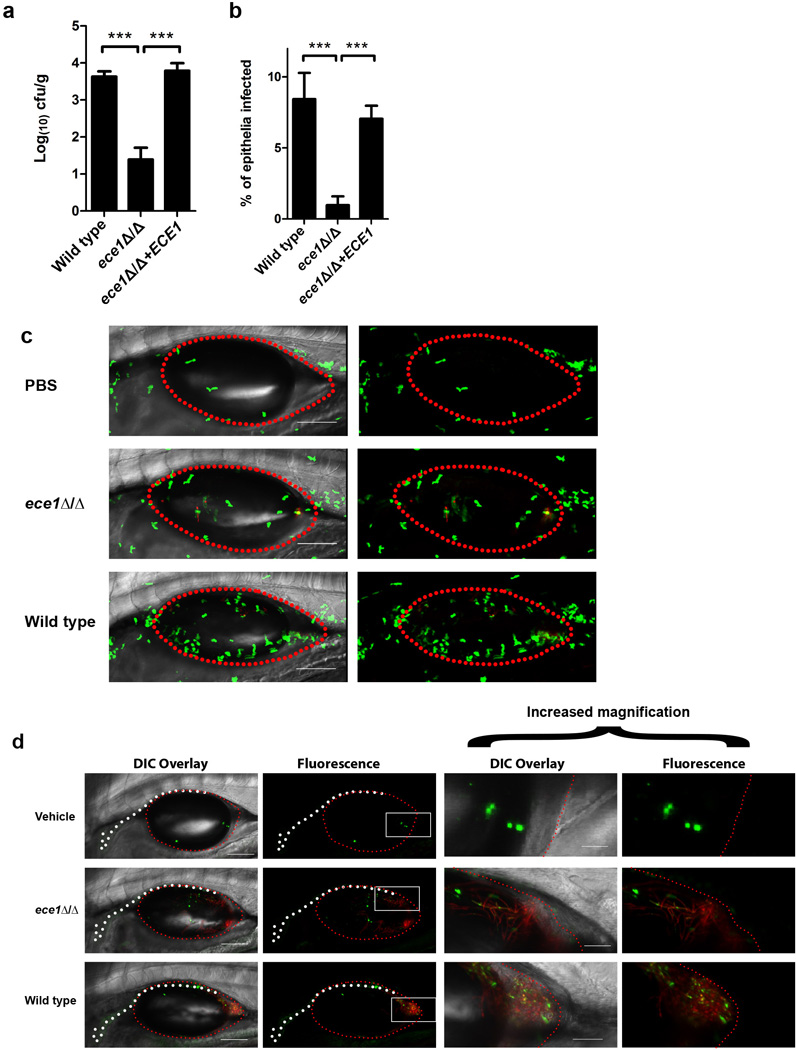
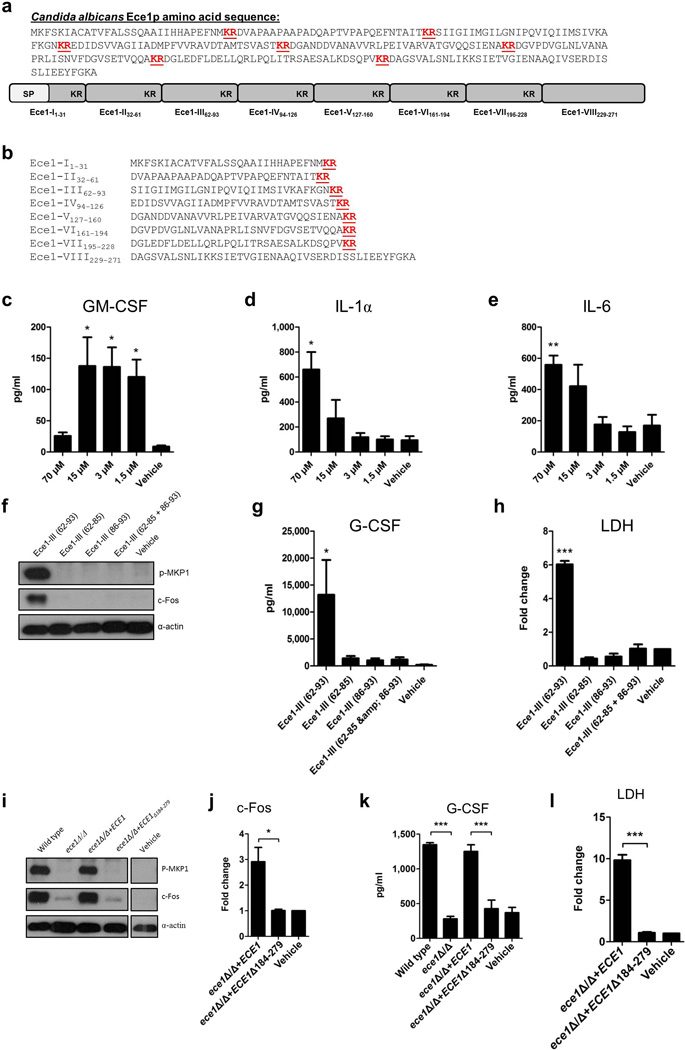
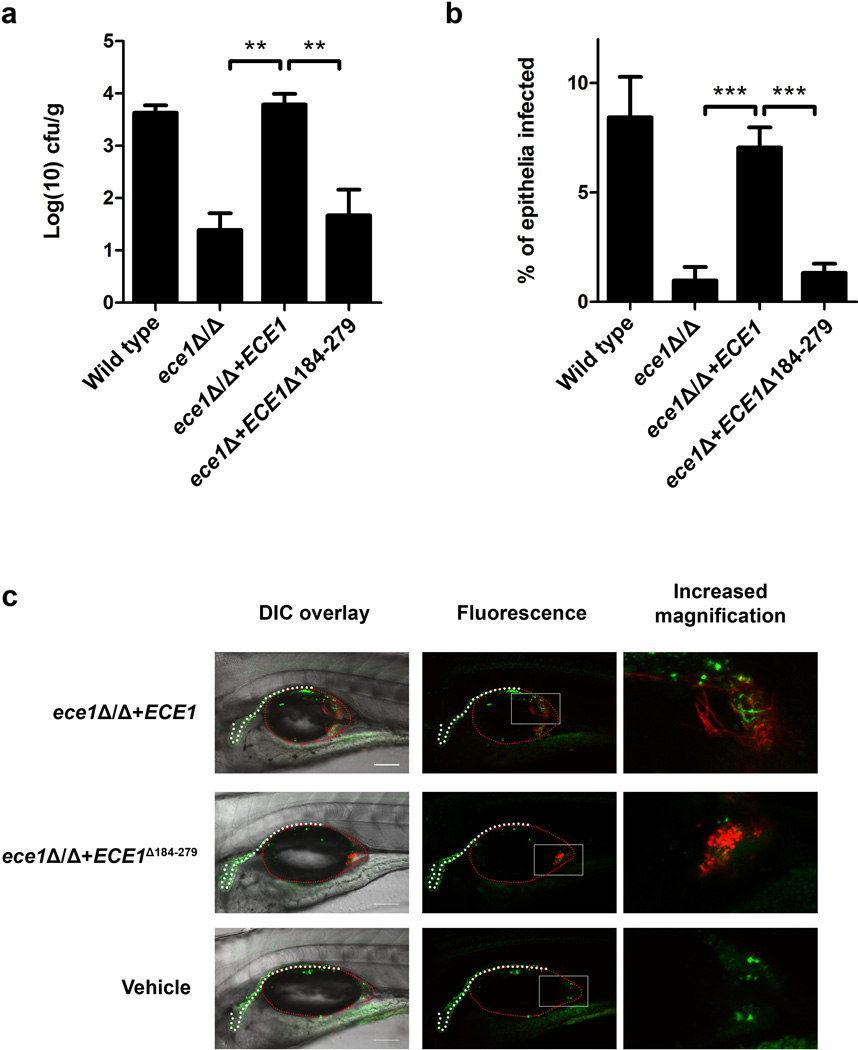
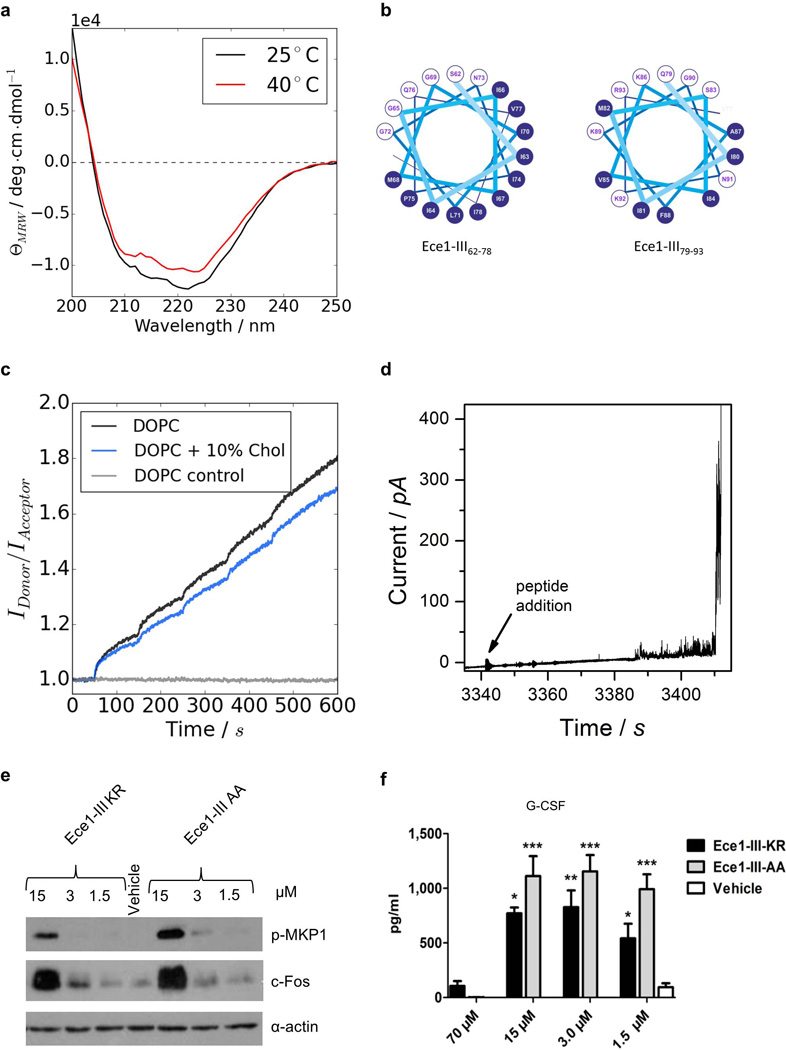
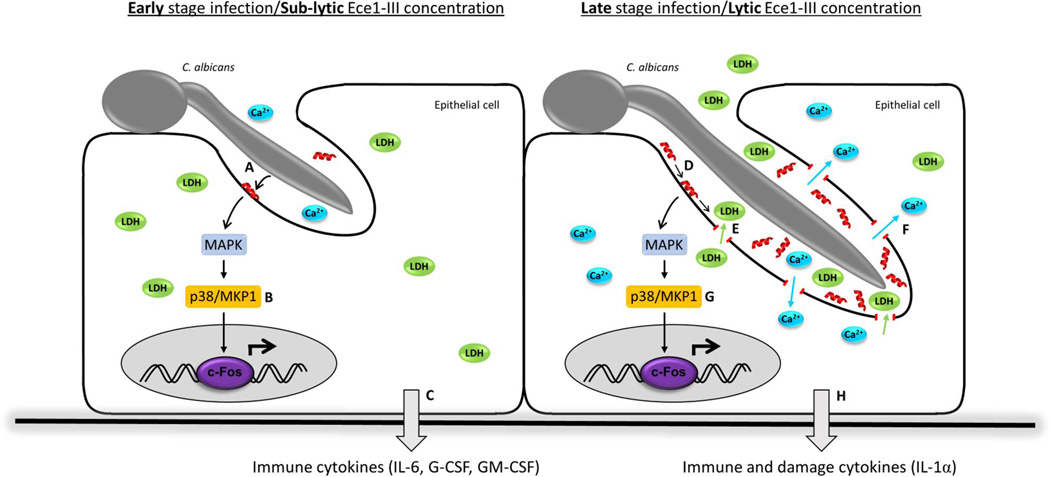
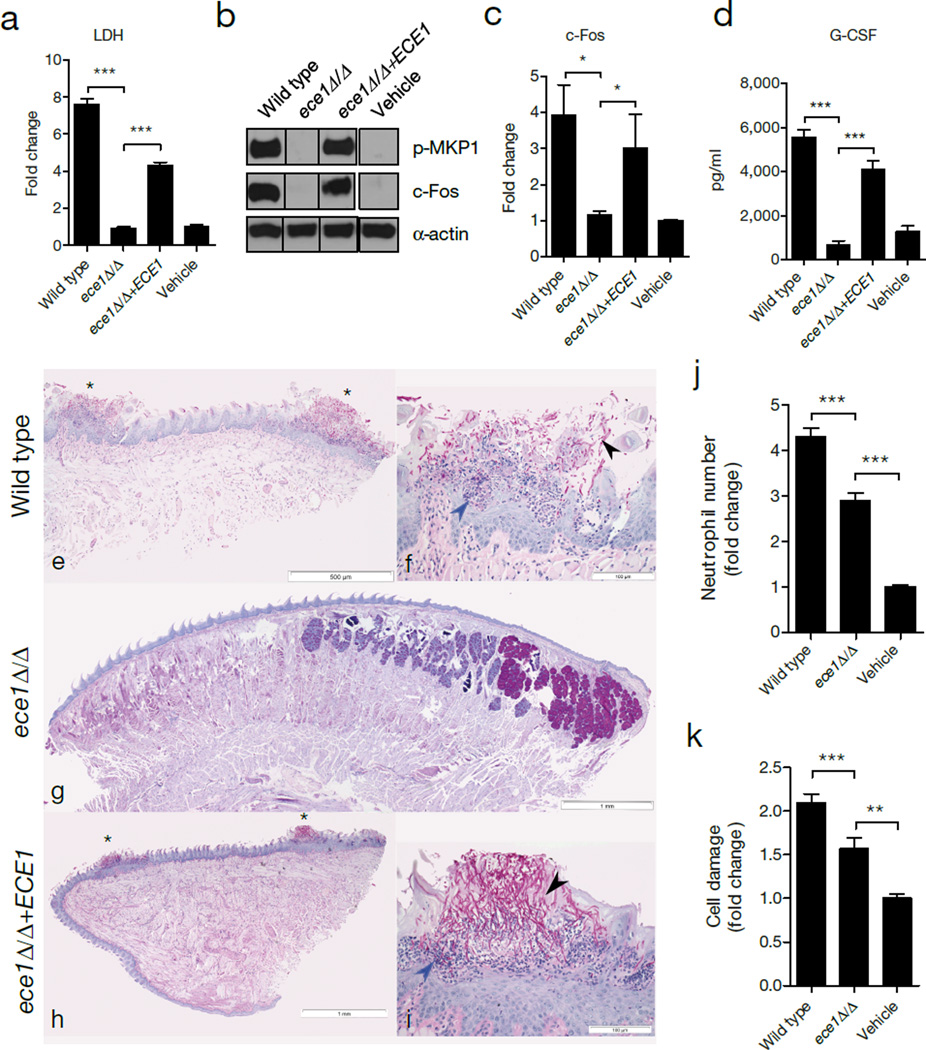
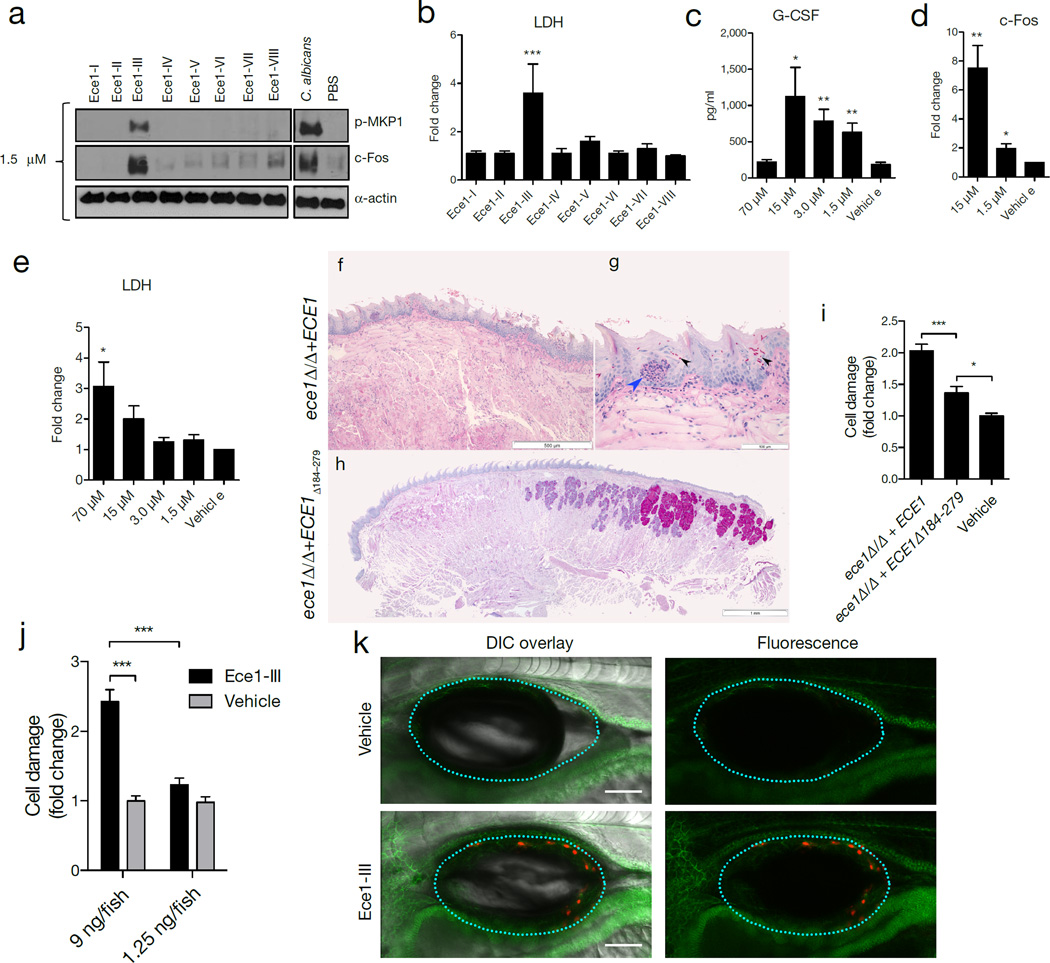
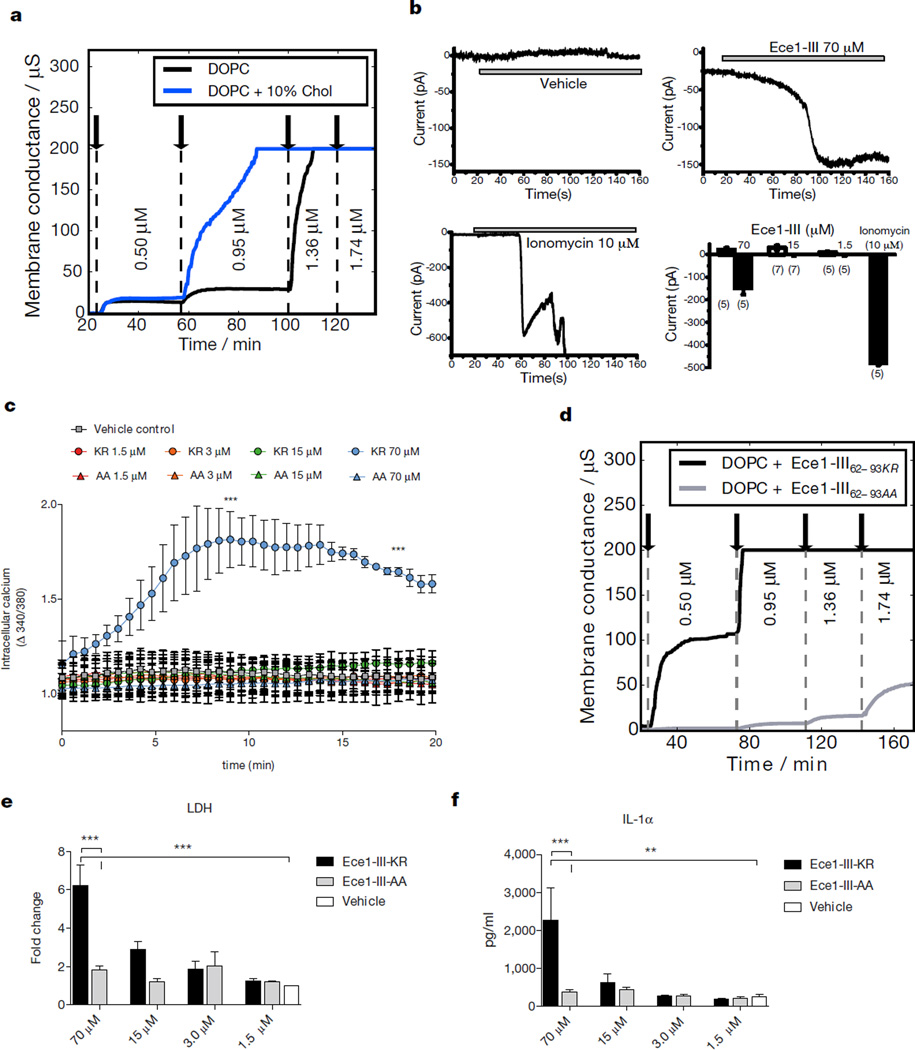
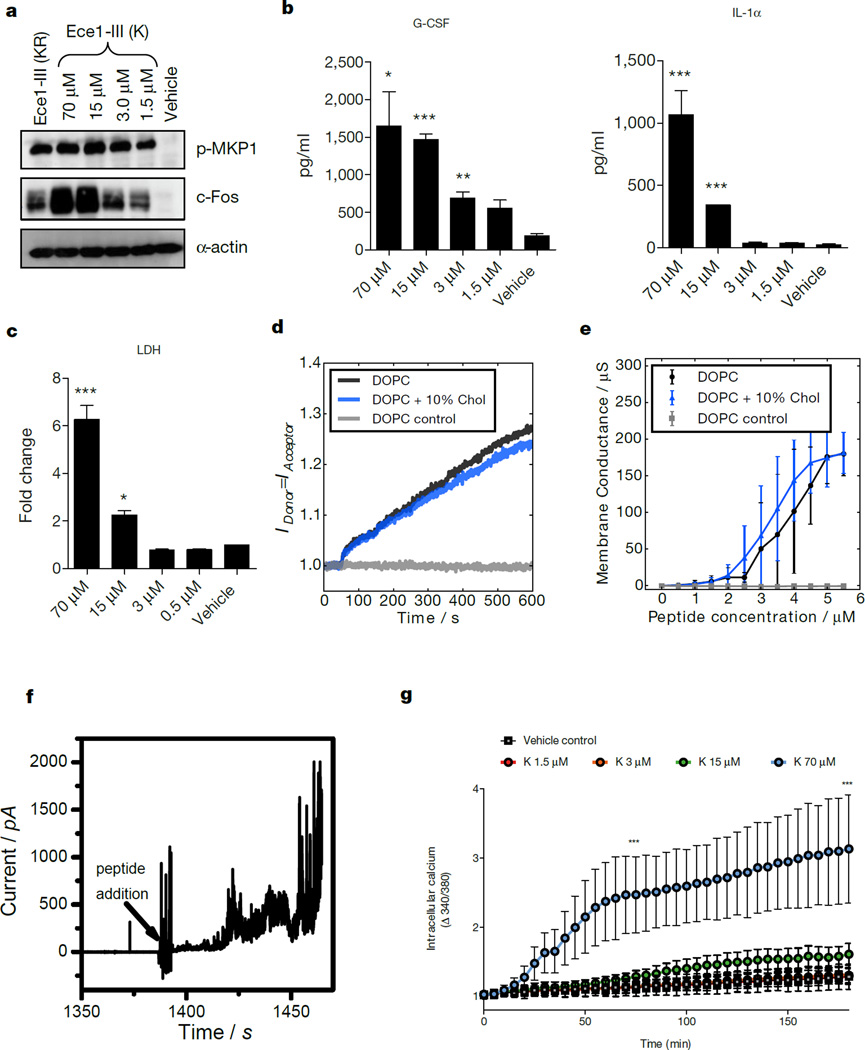
Cytolytic proteins and peptide toxins are classical virulence factors of several bacterial pathogens which disrupt epithelial barrier function, damage cells and activate or modulate host immune responses. Such toxins have not been identified previously in human pathogenic fungi. Here we identify the first, to our knowledge, fungal cytolytic peptide toxin in the opportunistic pathogen Candida albicans. This secreted toxin directly damages epithelial membranes, triggers a danger response signalling pathway and activates epithelial immunity. Membrane permeabilization is enhanced by a positive charge at the carboxy terminus of the peptide, which triggers an inward current concomitant with calcium influx. C. albicans strains lacking this toxin do not activate or damage epithelial cells and are avirulent in animal models of mucosal infection. We propose the name 'Candidalysin' for this cytolytic peptide toxin; a newly identified, critical molecular determinant of epithelial damage and host recognition of the clinically important fungus, C. albicans.


Conflict of interest statement

Author Information Reprints and permissions information is available at www.nature.com/reprints. The authors declare no competing financial interests. Readers are welcome to comment on the online version of the paper. Correspondence and requests for materials should be addressed to BHu (bernhard.hube@leibniz-hki.de).

Figures

Extended Data Figure 1
Extended Data Figure 1. C. albicans ECE1 expression and phenotypic effects of ECE1 gene deletion
(a) Relative expression (vs t = 0) of ECE1 in C. albicans wild type over time after addition of yeast cells to TR146 epithelial cells as measured by RT-qPCR. (b) Imaging confirmation of ECE1 expression over time within C. albicans wild type. C. albicans cells expressing GFP under the control of the ECE1 5′ intragenic region, containing the ECE1 promoter, were grown on TR146 epithelial cells and stained with calcofluor white (CFW, post-permeabilization) to show cell wall chitin and Alexa-Fluor-647-labelled concanavalin A (ConA, pre-permeabilization) to show carbohydrates. A composite image showing CFW, ConA, GFP and the brightfield (BF) image is shown. (c) Scanning electron micrographs (top panels, 5 h) and light microscopy (bottom panels, 24 h) showing no gross abnormalities in hypha formation between C. albicans wild type (BWP17+CIp30), ECE1-deletion (ece1Δ/Δ) and ECE1 re-integrant (ece1Δ/Δ+ECE1) strains after infection of TR146 epithelial cells. (d) No difference in adhesion of C. albicans wild type, ece1Δ/Δ and ece1Δ/Δ+ECE1 strains to TR146 epithelial cells after 60 min. (e) No difference in invasion of C. albicans wild type, ece1Δ/Δ and ece1Δ/Δ+ECE1 strains into TR146 epithelial cells after 3 h. (f) Fluorescence staining of C. albicans wild type and ece1Δ/Δ hyphae invading through TR146 epithelial cells. Fungal cells are stained with calcofluor white (CFW, post-permeabilization) and Alexa-Fluor-647-labelled concanavalin A (ConA, pre-permeabilization) to show cell wall chitin and carbohydrates, respectively, and to distinguish between invading hyphae (only stained after permeabilization) and non-invading hyphae (stained both pre- and post-permeabilization). Levels of chitin and β-glucan are comparable in both strains. White arrows indicate invasion into epithelial cells. Data shown are representative (b, c, f) or the mean (a, d, e) of three biological replicates. Error bars show ± SEM.
Extended Data Figure 2
Extended Data Figure 2. C. albicans Ece1p is critical for mucosal virulence in vivo
(a) Fungal burdens recovered from the tongues of mice infected with C. albicans wild type (BWP17+CIp30) (n (number of mice) = 13), ECE1-deletion (ece1Δ/Δ) (n = 20) and ECE1 re-integrant (ece1Δ/Δ+ECE1) (n = 24) strains after 2 day oropharyngeal infection. (b) Average percentage of the entire tongue epithelium area infected in different groups of mice infected with the different C. albicans strains. (c) Confocal imaging of 4 day post-fertilization (dpf) mpo-gfp transgenic zebrafish swimbladders infected with C. albicans wild type (BWP17+CIp30+dTomato), ECE1-deletion (ece1Δ/Δ+dTomato) and ECE1 re-integrant (ece1Δ/Δ+ECE1+dTomato) strains for 24 h. C. albicans cells appear red whilst neutrophils appear green. Red dots outline the swimbladder. Images are composites of maximum projections in the red and green channels (25 slices each, approximately 100 µm depth) with (left) or without (right) a single slice in the DIC channel overlay. Scale bars represent 100 µm. (d) Confocal imaging of 4 dpf zebrafish swimbladders infected with C. albicans wild type (BWP17+CIp30+dTomato), ECE1-deletion (ece1Δ/Δ+dTomato) and ECE1 re-integrant (ece1Δ/Δ+ECE1+dTomato) strains for 24 h stained with the fluorescent exclusion dye Sytox Green. C. albicans cells appear red and damaged epithelial cells appear green. White dots outline the pronephros and red dots outline the swimbladder. Images are composites of maximum projections in the red and green channels (25 slices each, approximately 100 µm depth) with (left) or without (right) a single slice in the DIC channel overlay. High magnification images of the white boxes are shown. Scale bars (bottom right) represent 100 µm (low magnification) and 30 µm (high magnification). Data shown are the mean (a, b) or representative (c, d) of at least three biological replicates. Error bars show ± SEM. Data were analyzed by Mann-Whitney test. *** = P < 0.001.
Extended Data Figure 3
Extended Data Figure 3. Ece1-III62–93 is the active region of Ece1p
(a) Amino acid sequence of Ece1p and a schematic of the protein, indicating the signal peptide (SP), lysine-arginine motifs (KR) at the C-terminus of each peptide, and the processed peptides (Ece1-I-VIII) produced by Kex2p cleavage. (b) Amino acid sequences of the processed peptides (Ece1-I-VIII) produced by Kex2p cleavage. Induction of (c) GM-CSF, (d) IL-1α and (e) IL-6 secreted after stimulation of TR146 epithelial cells for 24 h with varying concentrations of Ece1-III62–93 (70 µM - 1.5 µM). (f) Phosphorylation of MKP-1 and c-Fos production after 2 h treatment of TR146 epithelial cells with 15 µM of Ece1-III62–85 (hydrophobic region), Ece1-III86–93 (hydrophillic region), Ece1-III62–85 and Ece1-III86–93 together, or Ece1-III62–93 alone. (g) Induction of G-CSF secretion after 24 h treatment of TR146 epithelial cells with 15 µM of Ece1-III62–85, Ece1-III86–93, Ece1-III62–85 and Ece1-III86–93 together, or Ece1-III62–93 alone. (h) Fold change induction of LDH release after 24 h treatment of TR146 epithelial cells with 70 µM of Ece1-III62–85, Ece1-III86–93, Ece1-III62–85 and Ece1-III86–93 together, or Ece1-III62–93 alone. (i) Induction of p-MKP-1 and c-Fos 2 h post-infection (p.i.) with the indicated C. albicans strains (MOI = 10). (j) c-Fos DNA binding induction 3 h p.i. with indicated C. albicans strains (MOI = 10). (k) G-CSF secretion and (l) LDH release 24 h p.i. with indicated C. albicans strains (MOI = 0.01). Data shown are representative (f, i) or the mean (c-e, g-h, j-l) of three biological replicates. Error bars show ± SEM. Data were analyzed by one-way ANOVA (c-e, g-h,k-l) or T test (j). * = P < 0.05, ** = P < 0.01, *** = P < 0.001 (compared with vehicle control). For gel source data, see Supplementary Figure 1.
Extended Data Figure 4
Extended Data Figure 4. Ece1-III62–93 is required for C. albicans mucosal infection
(a) Fungal burdens recovered from the tongues of mice infected with C. albicans wild type (BWP17+CIp30) (n (number of mice) = 13), ECE1-deletion (ece1Δ/Δ) (n = 20), ECE1 re-integrant (ece1Δ/Δ+ECE1) (n = 24) and Ece1-III62–93 deletion (ece1Δ/Δ+ECE1Δ184–279) (n = 10) strains after 2 day oropharyngeal infection. (b) Average percentage of the entire tongue epithelium area infected in different groups of mice infected with the different C. albicans strains. (c) Confocal imaging of 4 dpf zebrafish swimbladders infected with C. albicans Ece1-III62–93 deletion (ece1Δ/Δ+ECE1Δ184–279+dTomato) and ECE1 re-integrant (ece1Δ/Δ+ECE1+dTomato) strains for 24 h stained with the fluorescent exclusion dye Sytox Green. C. albicans cells appear red and damaged cells appear green. White dots outline the pronephros and red dots outline the swimbladder. Images are composites of maximum projections in the red and green channels (25 slices each, approximately 100 µm depth) with (left) or without (right) a single slice in the DIC channel overlay. Scale bars (bottom right) represent 100 µm. Data shown are the mean (a-b) or representative (c) of at least three biological replicates. Error bars show ± SEM. Data were analyzed by Mann-Whitney test. ** = P < 0.01, *** = P < 0.001.
Extended Data Figure 5
Extended Data Figure 5. Ece1-III62–93 is a cytolytic α-helical peptide
(a) Circular dichroism spectra showing the α-helical conformation of Ece1-III62–93 in buffer (100 mM KCl, 5 mM HEPES, pH 7). Increasing the temperature from 25°C to 40°C did not affect the stability of the α-helical structure. (b) Diagram to illustrate the amphipathic nature of Ece1-III62–93 (residues 62–78, left panel; residues 79–93, right panel). Residues with hydrophobic or polar/charged side chains are displayed with a blue and white background, respectively. Modified from output generated in PEPWHEEL (http://emboss.bioinformatics.nl/cgi-bin/emboss/pepwheel). (c) Förster resonance energy transfer (FRET) experiments show the intercalation of Ece1-III62–93 into lipid liposomes (10 µM) composed of DOPC in the absence or presence of cholesterol. Peptide titration of Ece1-III62–93 to liposomes showed slightly enhanced intercalation for pure DOPC. (d) Ece1-III62–93 induced the permeabilization of planar lipid membranes composed of DOPC. The graph shows heterogeneous and transient lesions leading finally to a rupture of the membrane. Ece1-III62–93 concentration was 0.125 µM. (e) Induction of p-MKP-1 and c-Fos 2 h in TR146 cells post stimulation (p.s.) with Ece1-III62–93KR or Ece1-III62–93AA(f) Secretion of G-CSF from TR146 cells 24 h p.s. with Ece1-III62–93KR or Ece1-III62–93AA. Data shown are representative (a-e) or mean (f) of at least three biological replicates. Error bars show ± SEM. Data were analyzed by one-way ANOVA (f). * = P < 0.05, ** = P < 0.01, *** = P < 0.001 (compared with vehicle control). For gel source data, see Supplementary Figure 1.
Extended Data Figure 6
Extended Data Figure 6. Schematic of the role of Ece1-III in C. albicans infection of epithelial cells
During early stage infection of the mucosal surface by C. albicans, Ece1-III (red α-helix) is secreted into the invasion pocket created by the invading hypha (a). Sub-lytic concentrations of Ece1-III trigger epithelial signal transduction through MAPK, p38/MKP-1 and c-Fos (b) resulting in the production of immune regulatory cytokines (c). As the severity of the infection increases, Ece1-III accumulates (d) and once lytic concentrations are reached, causes membrane damage and the release of lactate dehydrogenase from the host epithelium (e), concomitant with calcium influx (f). Epithelial signal transduction is maintained (g) and additionally induces the release of damage associated cytokines, such as IL-1α (h). Ece1-III may also have activity on the epithelial surface outside of the invasion pocket and on neighboring cells not in contact with hyphae if Ece1-III is produced in sufficient concentrations.
Figure 1
Figure 1. ECE1 is required for epithelial activation and C. albicans infection
TR146 cells were infected with the indicated C. albicans strains. (a) LDH release 24 h post-infection (p.i.) (MOI = 0.1). (b) Induction of p-MKP-1 and c-Fos at 2 h p.i. (MOI = 10). (c) c-Fos DNA binding at 3 h p.i. (MOI = 10). (d) G-CSF production at 24 h p.i. (MOI = 0.01). (e-i) PAS-stained tongues from mice subjected to OPC 2 d p.i. (e, g, h) Whole-mount (x25) and (f, i) high-power (x200) views of PAS-stained tongues of mice infected with C. albicans wild type (e, f), ece1Δ/Δ (g) and ece1Δ/Δ+ECE1 (h, i). Invading hyphae (black arrow) and inflammatory cells (blue arrow) are indicated. (j) Quantification of neutrophils in zebrafish swimbladder following infection with wild type C. albicans (n (number of fish) = 47), ece1Δ/Δ (n = 53) or PBS (n = 40). (k) Quantification of damaged cells in zebrafish swimbladder after infection with C. albicans wild type (n = 73), ece1Δ/Δ (n = 59) or vehicle (n = 63). Data are representative (b, e-i) or the mean (a, c-d, j-k) of three biological replicates. Error bars ± SEM. Data were analyzed by one-way ANOVA (a, d), paired T test (c) or Kruskal-Wallis (j, k) and * = P < 0.05, ** = P < 0.01, *** = P < 0.001. For gel source data, see Supplementary Figure 1.
Figure 2
Figure 2. Ece1-III62–93 is the active region of Ece1p and is required for TR146 cell activation and mucosal C. albicans infection
(a) Induction of p-MKP-1 and c-Fos 2 h post-stimulation (p.s.) with Ece1 peptides at 1.5 µM. (b) LDH release 24 h p.s. with 70 µM Ece1 peptides. (c) Induction of G-CSF 24 h p.s. with Ece1-III62–93 (d) c-Fos DNA binding induction 3 h p.s. with sub-lytic concentrations of Ece1-III62–93 (e) LDH release 24 h p.s. with Ece1-III62–93 (f-h) PAS stained tongue sections from mice subjected to OPC, 2 d p.i. with (f, g) C. albicans ece1Δ/Δ+ECE1 (x25 and x200) or (h) ece1Δ/Δ+ECE1Δ184–279. Invading hyphae (black arrows) and infiltrating inflammatory cells (blue arrow) are shown. (i) Damaged cells in a zebrafish swimbladder 24 h p.i. with C. albicans ece1Δ/Δ+ECE1 (n (number of fish) = 44), ece1Δ/Δ+ECE1Δ184–279 (n = 58) or vehicle (n = 58). (j) Damaged cells in zebrafish swimbladders after stimulation with 9 ng (n = 51) or 1.25 ng (n = 56) Ece1-III62–93, or vehicle (40% DMSO, n = 54 and 5% DMSO, n = 55). (k) Co-localization of adherens junctions (α-catenin-citrine) with Ece1-III62–93-damaged cells (Sytox Orange-positive cells) in a zebrafish swimbladder. Data are representative (a, f-h, k) or mean (b-e, i-j) of three biological replicates (a-d) or ten mice or fish (f-h, k). Error bars show ± SEM. Data were analyzed by one-way ANOVA (b, c, e) paired T test (d) or Kruskal-Wallis (i, j). * = P < 0.05, ** = P < 0.01, *** = P < 0.001 (compared with vehicle control unless otherwise indicated). For gel source data, see Supplementary Figure 1.
Figure 3
Figure 3. Ece1-III62–93 functions as a cytolytic peptide toxin
(a) Kinetic changes in conductance of tethered lipid membranes after exposure to different concentrations of Ece1-III62–93. (b) Evoked inward current at a membrane potential of −60 mV in TR146 cells post-addition of Ece1-III62–93 or ionomycin (positive control); individual (representative) and cumulative changes (bar chart - number of cells analyzed below each bar) shown. (c) Intracellular calcium level kinetics in TR146 cells post-stimulation (p.s.) with Ece1-III62–93 wild type (Ece1-III62–93KR) or Ece1-III62–93 AA C-terminal substitution (Ece1-III62–93AA). (d) Kinetic changes in conductance of tethered DOPC membranes after exposure to different concentrations of Ece1-III62–93KR and Ece1-III62–93AA. (e) LDH release and (f) Secretion of IL-1α from TR146 cells 24 h p.s. with Ece1-III62–93KR or Ece1-III62–93AA. Data shown are representative (a, d) or mean (b-c, e-f) of three biological replicates. Error bars show ± SEM. Data were analyzed by one-way ANOVA (c, e and f). ** = P < 0.01, *** = P < 0.001.
Figure 4
Figure 4. Ece1-III62–92K functions as a cytolytic peptide toxin that activates and damages epithelial cells
(a) Induction of p-MKP-1 and c-Fos 2 h post-stimulation (p.s.), and (b) secretion of G-CSF and IL-1-α 24 h p.s., and (c) LDH release 24 h p.s. of TR146 cells with Ece1-III62–92K. (d) Förster resonance energy transfer (FRET) showing intercalation of Ece1-III62–92K (10 µM) into lipid liposomes. (e) Average peptide concentration-dependent changes in conductance of tethered lipid membranes. (f) Ece1-III62–92K (4 µM) induced permeabilization of planar lipid membranes showing heterogeneous and transient lesions leading to membrane rupture. (g) Intracellular calcium level kinetics in TR146 cells p.s. with Ece1-III62–92K. Data shown are representative (a, d, f) or mean (b-c, e, g) of three biological replicates. Error bars show ± SEM. Data are analyzed by one-way ANOVA (b, c). * = P < 0.05, ** = P < 0.01, *** = P < 0.001 (compared with vehicle control). For gel source data, see Supplementary Figure 1.

Comment in

References

    1. Brown GD, et al. Hidden killers: human fungal infections. Sci Transl Med. 2012;4 165rv113. - PubMed
    1. Jacobsen ID, et al. Candida albicans dimorphism as a therapeutic target. Expert Rev Anti Infect Ther. 2012;10:85–93. - PubMed
    1. Moyes DL, et al. A Biphasic Innate Immune MAPK Response Discriminates between the Yeast and Hyphal Forms of Candida albicans in Epithelial Cells. Cell Host Microbe. 2010;8:225–235. - PMC - PubMed
    1. Moyes DL, et al. Candida albicans yeast and hyphae are discriminated by MAPK signaling in vaginal epithelial cells. PLoS ONE. 2011;6:e26580. - PMC - PubMed
    1. Murciano C, et al. Candida albicans cell wall glycosylation may be indirectly required for activation of epithelial cell proinflammatory responses. Infect Immun. 2011;79:4902–4911. - PMC - PubMed

Extended Data Table references

    1. Gillum AM, Tsay EY, Kirsch DR. Isolation of the Candida albicans gene for orotidine-5′-phosphate decarboxylase by complementation of S. cerevisiae ura3, E. coli pyrF mutations. Mol Gen Genet. 1984;198:179–182. - PubMed
    1. Wilson RB, Davis D, Mitchell AP. Rapid hypothesis testing with Candida albicans through gene disruption with short homology regions. J Bacteriol. 1999;181:1868–1874. - PMC - PubMed
    1. Fonzi WA, Irwin MY. Isogenic strain construction and gene mapping in Candida albicans . Genetics. 1993;134:717–728. - PMC - PubMed
    1. Davis D, Wilson RB, Mitchell AP. RIM101-dependent and-independent pathways govern pH responses in Candida albicans . Mol Cell Biol. 2000;20:971–978. - PMC - PubMed
    1. Braun BR, Johnson AD. TUP1, CPH1 and EFG1 make independent contributions to filamentation in Candida albicans . Genetics. 2000;155:57–67. - PMC - PubMed

Publication types

MeSH terms