. 2016 May 3;7(18):26307-30.
doi: 10.18632/oncotarget.8368.

Small-molecule inhibition of STAT3 in radioresistant head and neck squamous cell carcinoma

Affiliations

Small-molecule inhibition of STAT3 in radioresistant head and neck squamous cell carcinoma

Uddalak Bharadwaj et al. Oncotarget. .

Erratum in

Abstract

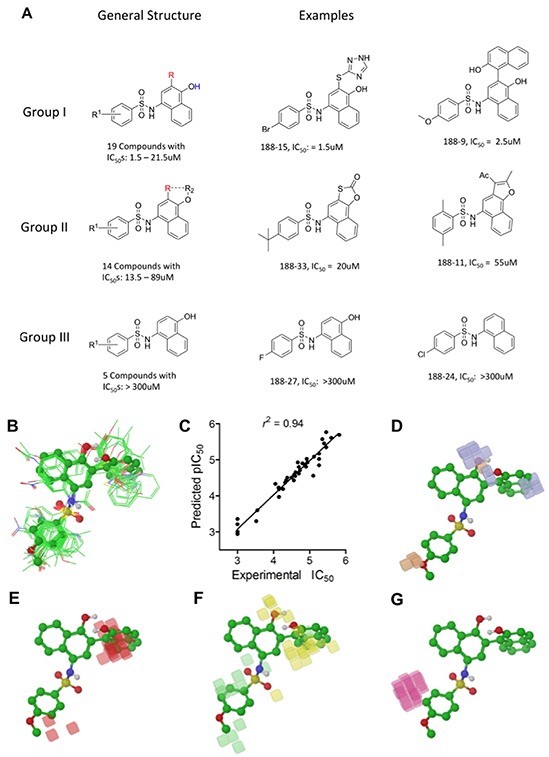
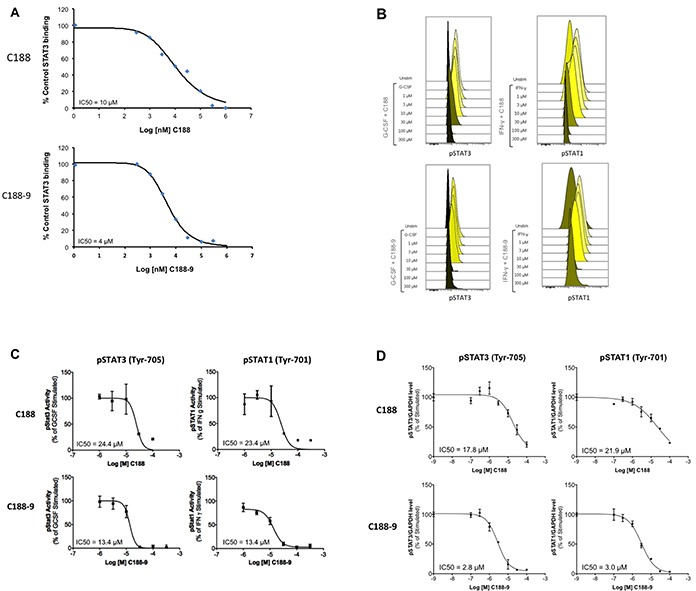
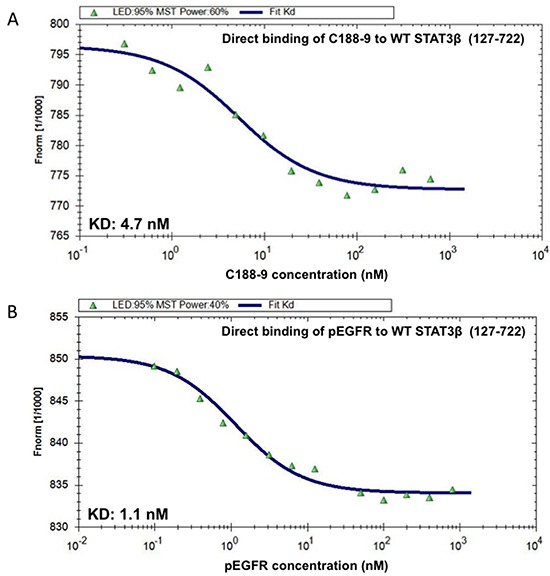
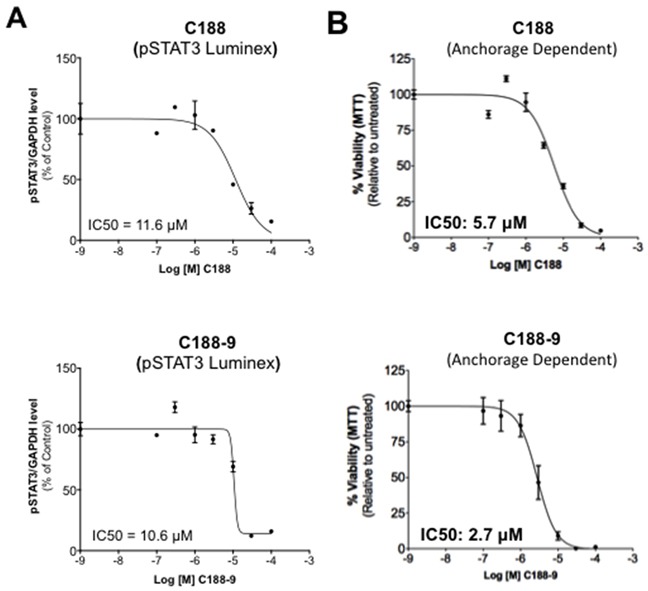
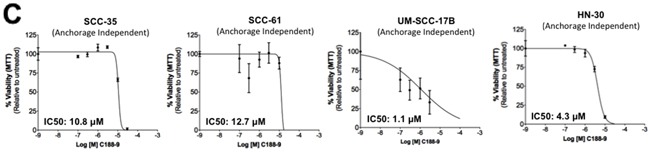
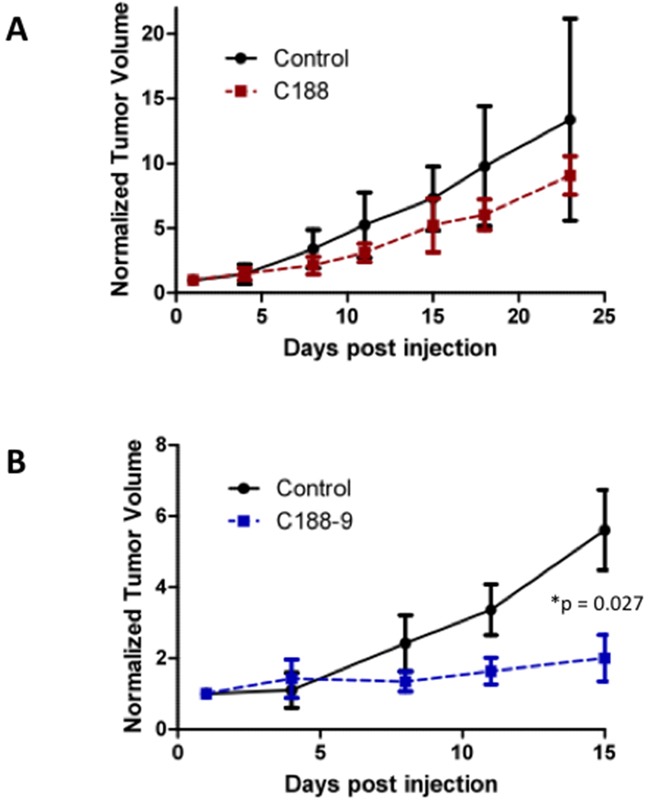
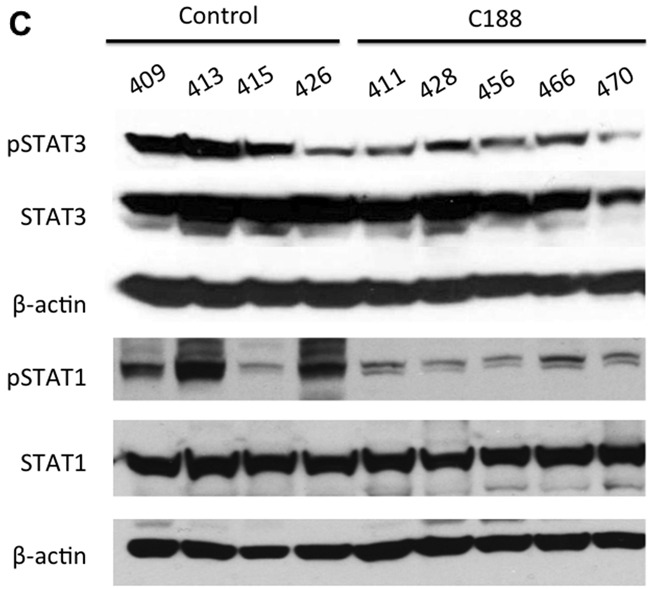
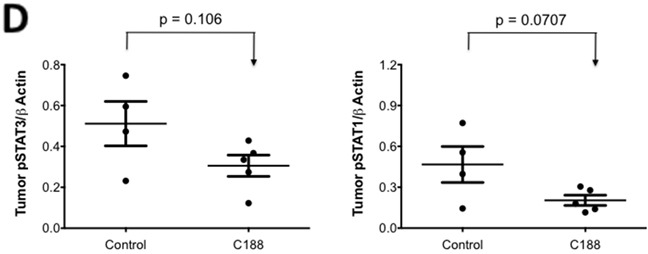
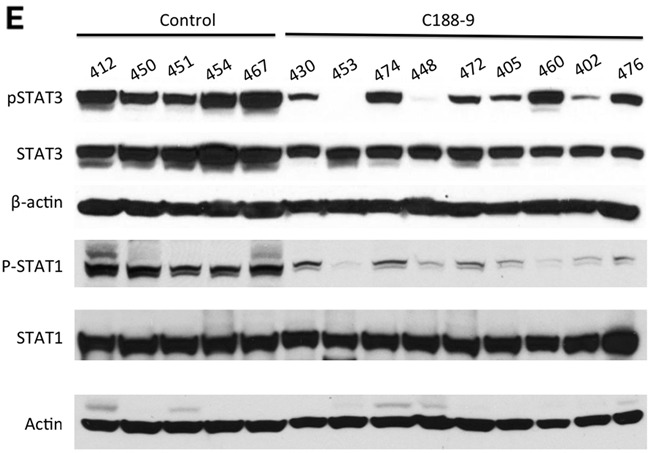
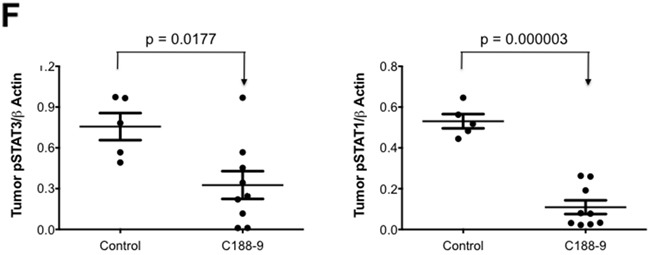
While STAT3 has been validated as a target for treatment of many cancers, including head and neck squamous cell carcinoma (HNSCC), a STAT3 inhibitor is yet to enter the clinic. We used the scaffold of C188, a small-molecule STAT3 inhibitor previously identified by us, in a hit-to-lead program to identify C188-9. C188-9 binds to STAT3 with high affinity and represents a substantial improvement over C188 in its ability to inhibit STAT3 binding to its pY-peptide ligand, to inhibit cytokine-stimulated pSTAT3, to reduce constitutive pSTAT3 activity in multiple HNSCC cell lines, and to inhibit anchorage dependent and independent growth of these cells. In addition, treatment of nude mice bearing xenografts of UM-SCC-17B, a radioresistant HNSCC line, with C188-9, but not C188, prevented tumor xenograft growth. C188-9 treatment modulated many STAT3-regulated genes involved in oncogenesis and radioresistance, as well as radioresistance genes regulated by STAT1, due to its potent activity against STAT1, in addition to STAT3. C188-9 was well tolerated in mice, showed good oral bioavailability, and was concentrated in tumors. Thus, C188-9, either alone or in combination with radiotherapy, has potential for use in treating HNSCC tumors that demonstrate increased STAT3 and/or STAT1 activation.

Keywords: C188-9; HNSCC; STAT3; cancer; small molecule.


Conflict of interest statement

Please note that DJT has the following conflict of interest: Baylor College of Medicine, with DJT as primary inventor, filed composition and methods of use patents on C188 and C188-9. StemMed, Ltd. currently holds an exclusive license to these compounds. DJT is founding partner, President, and CEO of StemMed and also have majority ownership of StemMed. He has been in compliance with all conflict of interests (COI) policies at Baylor College of Medicine and currently is in compliance with all COI policies at StemMed and at the University of Texas M.D. Anderson Cancer Center, where he relocated on December 1, 2014.

Figures

Figure 1
Figure 1. Structure Activity Relationship (SAR) of C188 and similar compounds
A. SAR grouping of 37 C188-like STAT3 probes. Thirty-seven of the 39 C188-like compounds can be divided into three structural groups with activity ranging from highest to lowest. The most potent Group I compounds contain a variety of groups, such as a triazole-3-yl-mercapto (188-15) or a hydroxynaphthalene (188-9), at the 3-position of the naphthylamine ring (the -R group highlighted in red). Group II compounds with intermediate potency contain a 5-membered ring that combines the 3-R and 4-OR2 groups, such as a furan (188-11). The least potent Group III probes do not contain a substitution at the 3-position. B–G. Quantitative SAR of compounds. Alignment of C188 and C188-1 through C188-39 showing (B) only heavy atoms and polar hydrogens displayed for clarity, with C188-9 in ball and stick model; C. Correlation between experimental and predicted pIC50 values; D. Phase H-bond donor fields, superimposed with the aligned structure of C188-9, blue favorable, orange disfavored; E. hydrophobic fields, red favorable; F. electron-withdrawing fields, yellow favorable, light green disfavored; G. negative ionic fields, pink favorable.
Figure 2
Figure 2. Inhibition of STAT3 activities by C188 and C188-9
A. Inhibition of recombinant STAT3 (200nM) binding to Biacore sensor-chip-immobilized phosphododecapeptide ligand (12 amino acids surrounding and including pY1068 within EGFR) by C188 (0.1 to 1000 μM, top) and C188-9 (0.1 to 1000 μM, bottom) by SPR. The equilibrium binding levels obtained ± compound were normalized (resonance obtained in the presence of compound ÷ the resonance obtained in the absence of compound × 100) and plotted against Log [nM] C188 (or C188-9) and IC50 calculated (value shown in inlay). B. Inhibition of ligand-stimulated STAT phosphorylation, measured by phosphoflow. Serum-starved (1 hour) Kasumi-1 cells, pre-incubated with compound/DMSO (1 hour), were treated with G-CSF (10 ng/ml, 15 min, left two panels) or IFN-γ (10ng/ml, 15 min, right panel). Cells were permeabilized and stained with Alexa647-pSTAT3, and PE-pSTAT1 antibodies and analyzed on BD LSR2. FCS files were uploaded to Cytobank for pSTAT3 and pSTAT1 quantitation. Histograms depicting pSTAT3 and pSTAT1 levels are shown. C. Mean fluorescence (pSTAT3/1) levels were plotted as function the Log [M] compound, and IC50 calculated using GraphPad. 1D shows IC50 curve from representative experiments. D. Inhibition of ligand-stimulated STAT phosphorylation, measured by Luminex. Serum-starved (1 hour) Kasumi-1 cells, pre-incubated with compound/DMSO (0/0.1/0.3/1/3/10/100 μM, 1 hour), were treated with G-CSF (10 ng/ml, 15′). Total protein extracts of cells were assayed for pSTAT3, pSTAT1, and GAPDH levels by Luminex. GAPDH-normalized pSTAT3 or pSTAT1 values were divided by this ratio for untreated cells and expressed in percentage. These values were plotted as a function of Log [M] compound, and IC50 values calculated using GraphPad. Upper panel shows data from representative experiments with C188 and lower panel shows those with C188-9.
Figure 3
Figure 3. C188-9 binds to STAT3 with high affinity
Increasing concentrations of C188-9 (0.305 to 10,000 nM; panel A.) and the phosphotyrosyl (pY)-dodecapeptide based on the portion of the EGFR surrounding Y1068 (EGFR pY-1068; 0.025 to 800 nM; panel B.) were incubated with a constant concentration (80 nM) of fluorescently labeled STAT3 (aa residues 127-722). Fluorescence was measured continuously before and after application of an infrared laser. The change in fluorescence (Fnorm) was calculated from the ratio of fluorescence immediately before heating and 30 seconds after heating and plotted against the logarithm of the different concentrations of C188-9 or EGFR pY-1068 (A and B); the sigmoidal binding curve was used to calculate the dissociation constant KD.
Figure 4
Figure 4. Inhibition of constitutive pSTAT3 and pSTAT1 and resultantly growth of HNSCC cells by C188-9
A. Lysates from asynchronous cultures of UM-SCC-17B cells treated with DMSO or C188 or C188-9 with DMSO or increasing doses (0/0.1/0.3/1/3/10/100 μM) of C188 or C188-9 for 24 hrs, assayed for pSTAT3/pSTAT1 and GAPDH by Luminex. GAPDH-normalized pSTAT3 or pSTAT1 values were divided by that for untreated cells and expressed in percentage. These values were plotted as a function of Log [M] compound, and IC50 values calculated using GraphPad. Upper panel shows data from representative experiments with C188 and lower panel shows those with C188-9. B. Effect of C188 and C188-9 on anchorage dependent growth of UM-SCC-17B cells. Cells were cultured for 48 hrs in complete DMEM with 10% FBS ± C188 0r C188-9 (0/0.1/0.3/1/3/10/100 μM) in cell-culture-treated 96-well plates. Viable cells quantitated using MTT. Relative % viability was measured by (viability after any treatment ÷ viability of untreated cells × 100) and plotted as a function of Log [M] C188/C188-9, and IC50 values calculated using GraphPad. Data show representative experiments from ≥ 2 replicates. C. SCC-35, SCC-61, UM-SCC-17B and HN30 cells were treated with increasing doses of C188-9 for 72 hrs and IC50 for ability of C188-9 to inhibit anchorage independent growth were calculated as in (B). Representative curves are shown. Mean IC50 values are shown in Table 2.
Figure 5
Figure 5. C188-9 efficiently targets STAT3 in HNSCC xenografts and inhibits tumor growth in nude mice
UM-SCC-17B cells (1.5 × 10⁶) were injected into the tongues of athymic, 8–10 week old, male, nude mice (NCI, Frederick, MD, USA). Once tumors were established, mice (5/group) were randomized (average tumor vol ~ 15-20 mm3) to receive 5 times a week, intraperitoneal injections of either DMSO or C188 (50 mg/Kg) or C188-9 (100 mg/Kg). Tumor volumes were measured twice weekly. Average tumor volumes (0.5 × (long dimension) × (short dimension)2 were calculated and normalized to the volume at first day of treatment and plotted along the Y axis, for C188 A. and C188-9 B. treatments. Comparison was done by t test (* p<0.05). After injections, mice were euthanized, and lysates of tumors from C188-treated C. or C188-9-treated E. mice were immunoblotted for pSTAT3, total STAT3, β-actin, pSTAT1, total STAT1. Whisker plots of β-actin-normalized pSTAT3 (left panels) and pSTAT1 values (right panels) for C188 treatment F. are shown with the differences in means compared using t test.

References

    1. Zhong Z, Wen Z, Darnell JE., Jr Stat3: a STAT family member activated by tyrosine phosphorylation in response to epidermal growth factor and interleukin-6. Science. 1994;264:95–98. - PubMed
    1. Hanahan D, Weinberg RA. Hallmarks of cancer: the next generation. Cell. 2011;144:646–674. - PubMed
    1. Grandis JR, Chakraborty A, Zeng Q, Melhem MF, Tweardy DJ. Downmodulation of TGF-alpha protein expression with antisense oligonucleotides inhibits proliferation of head and neck squamous carcinoma but not normal mucosal epithelial cells. Journal of cellular biochemistry. 1998;69:55–62. - PubMed
    1. Jing N, Tweardy DJ. Targeting Stat3 in cancer therapy. Anticancer Drugs. 2005;16:601–607. - PubMed
    1. Bharadwaj U, Eckols TK, Kolosov M, Kasembeli MM, Adam A, Torres D, Zhang X, Dobrolecki LE, Wei W, Lewis MT, Dave B, Chang JC, Landis MD, Creighton CJ, Mancini MA, Tweardy DJ. Drug-repositioning screening identified piperlongumine as a direct STAT3 inhibitor with potent activity against breast cancer. Oncogene. 2015;34:1341–53. - PMC - PubMed

MeSH terms