Meta-Analysis
. 2016 Apr;40(3):188-201.
doi: 10.1002/gepi.21953.

JAM: A Scalable Bayesian Framework for Joint Analysis of Marginal SNP Effects

Affiliations
Meta-Analysis

JAM: A Scalable Bayesian Framework for Joint Analysis of Marginal SNP Effects

Paul J Newcombe et al. Genet Epidemiol. 2016 Apr.

Abstract

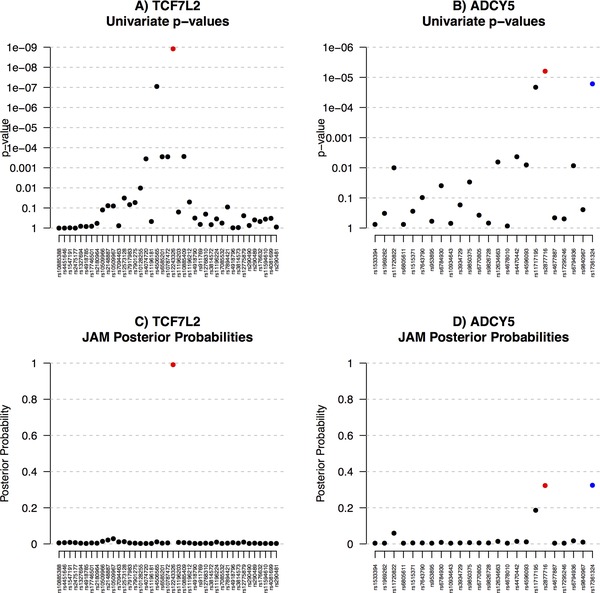
Recently, large scale genome-wide association study (GWAS) meta-analyses have boosted the number of known signals for some traits into the tens and hundreds. Typically, however, variants are only analysed one-at-a-time. This complicates the ability of fine-mapping to identify a small set of SNPs for further functional follow-up. We describe a new and scalable algorithm, joint analysis of marginal summary statistics (JAM), for the re-analysis of published marginal summary statistics under joint multi-SNP models. The correlation is accounted for according to estimates from a reference dataset, and models and SNPs that best explain the complete joint pattern of marginal effects are highlighted via an integrated Bayesian penalized regression framework. We provide both enumerated and Reversible Jump MCMC implementations of JAM and present some comparisons of performance. In a series of realistic simulation studies, JAM demonstrated identical performance to various alternatives designed for single region settings. In multi-region settings, where the only multivariate alternative involves stepwise selection, JAM offered greater power and specificity. We also present an application to real published results from MAGIC (meta-analysis of glucose and insulin related traits consortium) - a GWAS meta-analysis of more than 15,000 people. We re-analysed several genomic regions that produced multiple significant signals with glucose levels 2 hr after oral stimulation. Through joint multivariate modelling, JAM was able to formally rule out many SNPs, and for one gene, ADCY5, suggests that an additional SNP, which transpired to be more biologically plausible, should be followed up with equal priority to the reported index.

Keywords: GWAS meta-analysis; fine-mapping; glucose; insulin; variable selection.


Figures

Figure 1
Figure 1
Comparison of ranking performance by JAM against other fine‐mapping strategies for 15,356 individuals (the total size of the MAGIC consortium). Ranking performance is measured in terms of PPV, the proportion of true signal SNPs in the selection (solid lines, left y‐axis) and power/sensitivity, the proportion of all simulated signals included (dashed lines, right y‐axis). For each method, the average PPV and sensitivity estimates consist of points for each SNP rank, which we have joined with lines to ease the visual comparison. Data were simulated for a single region of 41 SNPs, three of which were given effects as described in the main text. For LD estimation, JAM, FINEMAP, CAVIARBF and GCTA (COJO) were provided with an independently simulated reference dataset of 2,674, the size of the WTCCC control sample. Estimates are averaged over 200 simulation replicates. A vertical grey line highlights the rank equal to the number of true signals, where PPV and sensitivity by definition intersect. Performance of JAM's enumeration (red), JAM's stochastic search (orange) and FINEMAP (green) were indistinguishable and hence these lines are superimposed on top of one another. Performance of CAVIARBF (blue) was marginally weaker than JAM and FINEMAP for top‐ranked SNPs, but indistinguishable at lower ranks.
Figure 2
Figure 2
Comparison of signal to noise discrimination by JAM against various strategies when 12 effects were simulated among 10,000 SNPs for 15,356 individuals (the total size of the MAGIC consortium). Results are only displayed for the first 500 simulated SNPs, which included all 40 simulated effects. For LD estimation, JAM was provided with an independently simulated reference dataset of 2,674, the size of the WTCCC control sample. All summary statistics are averaged over 200 simulation replicates. The 12 true effects are highlighted in red. IPD: individual patient data; ABF: Wakefield's approximate Bayes factor.
Figure 3
Figure 3
Comparison of ranking performance by JAM against various other strategies across two simulation scenarios for 15,356 individuals (the total size of the MAGIC consortium). Ranking performance is measured in terms of PPV, the proportion of true signal SNPs in the selection (solid lines, left y‐axis) and power/sensitivity, the proportion of all simulated signals included (dashed lines, right y‐axis). For each method, the average PPV and sensitivity estimates consist of points for each SNP rank, which we have joined with lines to ease the visual comparison. Panel (A) corresponds to a fine‐mapping scenario, including 132 SNPs across four regions, and panel (B) corresponds to a higher dimensional setting in which 40 effects were simulated among 10,000 SNPs. For LD estimation, JAM and GCTA (COJO) were provided with an independently simulated reference dataset of 2,674, the size of the WTCCC control sample. Estimates are averaged over 200 simulation replicates. A vertical grey line highlights the rank equal to the number of true signals, where PPV and sensitivity by definition intersect. IPD: individual patient data; ABF: Wakefield's approximate Bayes factor. Performance of JAM's enumeration (red), JAM's stochastic search (orange) were nearly identical in both scenarios, and so these lines appear superimposed. In the four region scenario, JAM's performance was very similar to the full IPD data analysis (dark green), and caught up at lower ranks at which point this line also appears superimposed.
Figure 4
Figure 4
Application of JAM to marginal results reported by MAGIC for two of the top loci associated with 2‐hr fasting glucose. Two‐hour glucose levels after oral stimulation are a measure of glucose tolerance. Panels (A) and (B) display marginal one‐at‐a‐time p‐values, (C) and (D) display multivariate adjusted posterior probabilities as inferred by JAM. The MAGIC index SNPs are indicated in red. For ADCY, an additional SNP was highlighted by JAM – this is indicated in blue.
Figure 5
Figure 5
Application of JAM to marginal results reported by MAGIC for two of the top loci associated with 2‐hr fasting glucose, for which the MAGIC index SNP is represented by a tag. For GCKR, our tag SNP had D' 0.96 with the MAGIC index, and for VPS13C, our tag was in LD at D' 0.98. Both tags were the top SNPs. Panels (A) and (B) display marginal one‐at‐a‐time p‐values, (C) and (D) display multivariate adjusted posterior probabilities as inferred by JAM. For both genes JAM found no evidence for more than a single effect, although there was uncertainty around the location.

References

    1. Barrett JC, Fry B, Maller J, Daly MJ. 2005. Haploview: analysis and visualization of LD and haplotype maps. Bioinformatics 21(2):263–265. - PubMed
    1. Benner C, Spencer CCA, Ripatti S, Pirinen M. 2015. FINEMAP : efficient variable selection using summary data from genome‐wide association studies. bioRxiv. doi: 10.1101/027342. - PMC - PubMed
    1. Bottolo L, Richardson S. 2010. Evolutionary stochastic search for Bayesian model exploration. Bayesian Anal 5(3):583–618.
    1. Bottolo L, Chadeau‐hyam M, Hastie DI, Langley SR, Petretto E, et al. 2011. ESS ++ : a C ++ objected‐oriented algorithm for Bayesian stochastic search model exploration. Bioinformatics 27(4):587–588. - PMC - PubMed
    1. Bottolo L, Petretto E, Blankenberg S, Cambien F, Cook SA, Tiret L, Richardson S. 2011. Bayesian detection of expression quantitative trait Loci hot spots. Genetics 189(4):1449–1459. - PMC - PubMed

Publication types

LinkOut - more resources