. 2016 Jul;101(2):265-80.
doi: 10.1111/mmi.13388. Epub 2016 May 3.

A novel membrane anchor for FtsZ is linked to cell wall hydrolysis in Caulobacter crescentus

Affiliations

A novel membrane anchor for FtsZ is linked to cell wall hydrolysis in Caulobacter crescentus

Elizabeth L Meier et al. Mol Microbiol. 2016 Jul.

Abstract

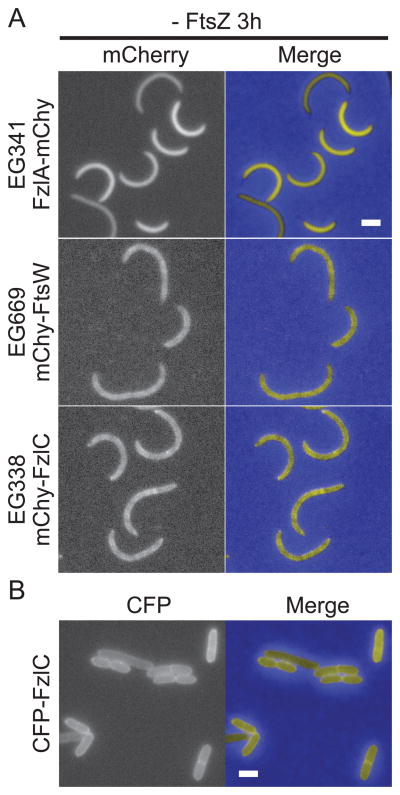
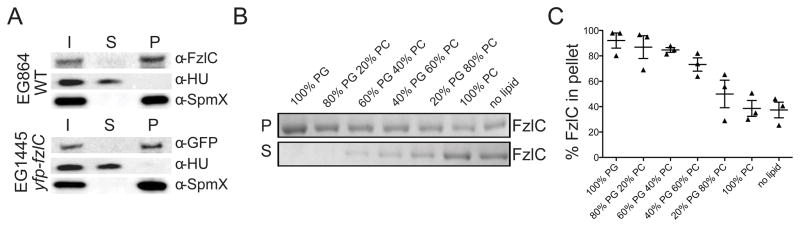
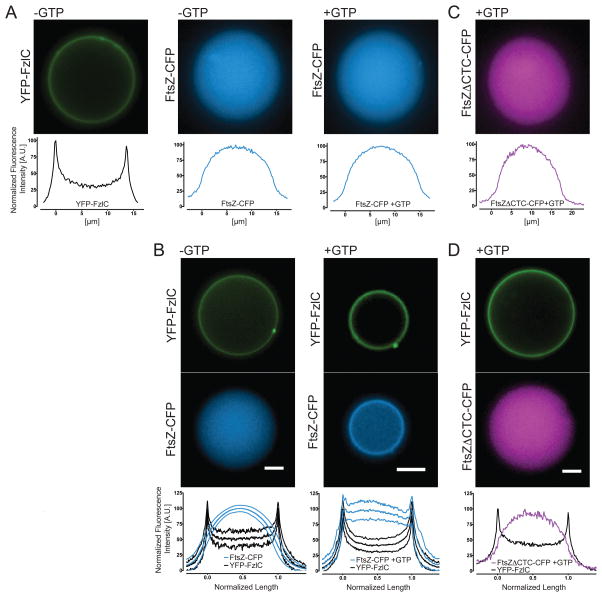
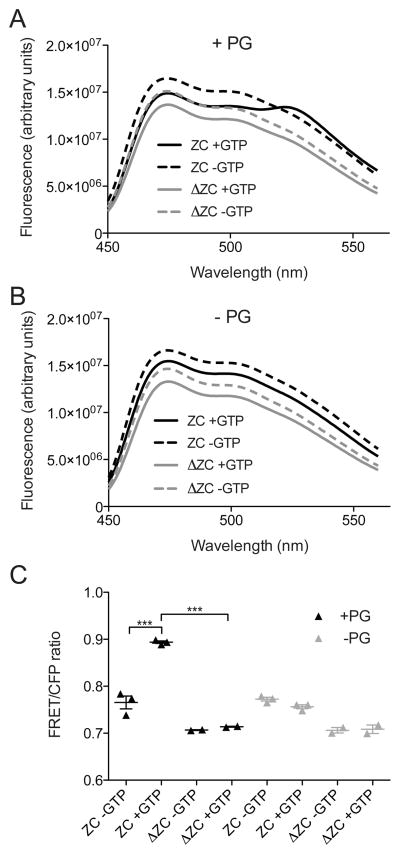
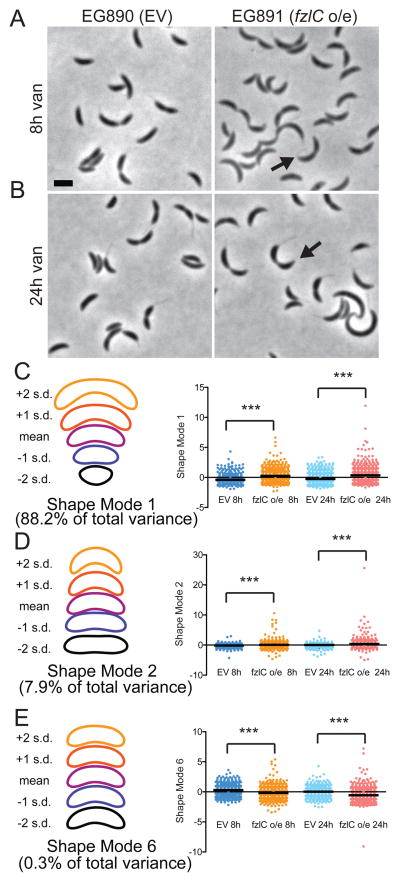
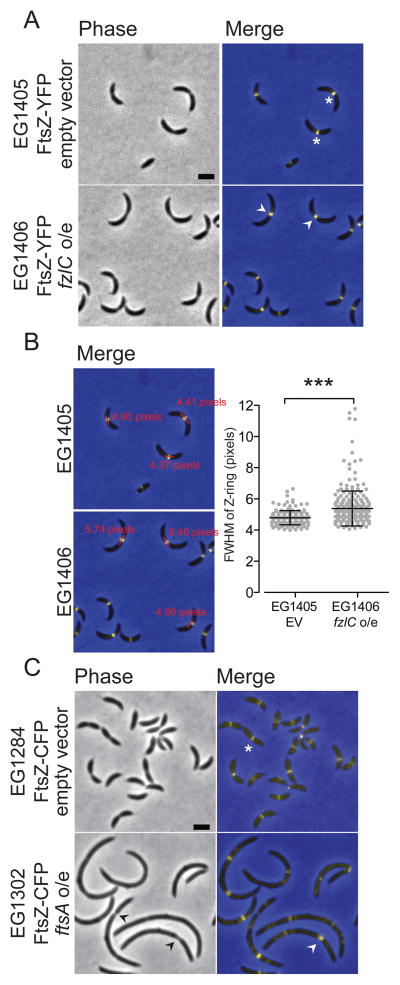
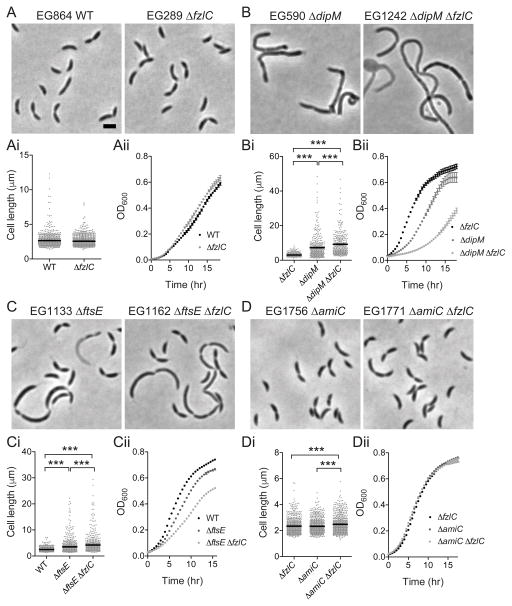
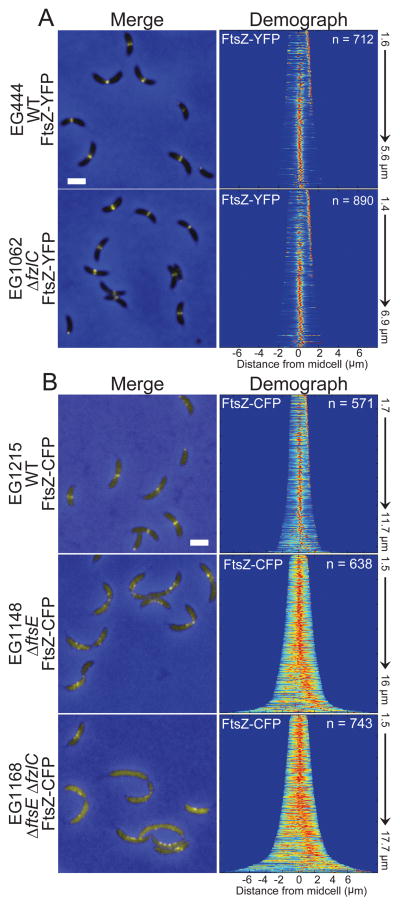
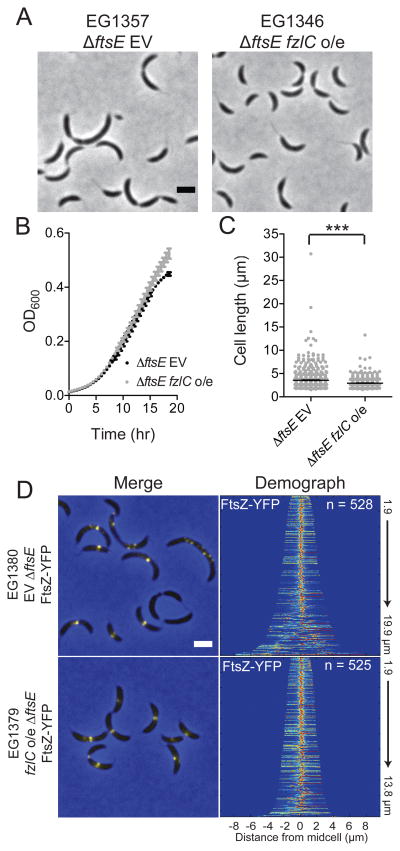
In most bacteria, the tubulin-like GTPase FtsZ forms an annulus at midcell (the Z-ring) which recruits the division machinery and regulates cell wall remodeling. Although both activities require membrane attachment of FtsZ, few membrane anchors have been characterized. FtsA is considered to be the primary membrane tether for FtsZ in bacteria, however in Caulobacter crescentus, FtsA arrives at midcell after stable Z-ring assembly and early FtsZ-directed cell wall synthesis. We hypothesized that additional proteins tether FtsZ to the membrane and demonstrate that in C. crescentus, FzlC is one such membrane anchor. FzlC associates with membranes directly in vivo and in vitro and recruits FtsZ to membranes in vitro. As for most known membrane anchors, the C-terminal peptide of FtsZ is required for its recruitment to membranes by FzlC in vitro and midcell recruitment of FzlC in cells. In vivo, overproduction of FzlC causes cytokinesis defects whereas deletion of fzlC causes synthetic defects with dipM, ftsE and amiC mutants, implicating FzlC in cell wall hydrolysis. Our characterization of FzlC as a novel membrane anchor for FtsZ expands our understanding of FtsZ regulators and establishes a role for membrane-anchored FtsZ in the regulation of cell wall hydrolysis.


Figures

Figure 1
Figure 1. FzlC localizes to membranes in C. crescentus and E. coli cells
(A) Fluorescence and merged micrographs of cells depleted of FtsZ for 3 h and expressing mCherry fusions to the indicated proteins induced with vanillate for 2 h. FzlA is diffuse in the cytoplasm (top row) while FtsW and FzlC display a patchy peripheral localization typical of membrane-associated proteins (middle and bottom rows). (B) Fluorescence and merged micrographs of cells producing CFP-FzlC after 2 h induction with 1% L-arabinose in E. coli. CFP-FzlC localizes to the periphery, indicating membrane association. Scale bars = 2 μm.
Figure 2
Figure 2. FzlC binds to membranes in vivo and in vitro
(A) WT (EG864) or cells expressing yfp-fzlC as the only copy of fzlC (EG1445) were lysed and centrifuged to separate soluble (supernatant) and membrane (pellet) protein fractions. Whole cell lysate/input (I), soluble (S), and membrane (P) fractions were probed by immunoblotting for FzlC, as well as for SpmX (transmembrane protein) and HU (DNA-binding protein) as controls for membrane and soluble fractions, respectively. (B) Coomassie stained gels of supernatant (S) and pellet (P) fractions after copelleting of FzlC with sucrose loaded unilamellar vesicles with the indicated molar percentages of phosphatidylglycerol (PG) and phosphatidylcholine (PC). Abundance of FzlC in the pellet indicates degree of binding to vesicles. (C) Quantification of FzlC lipid binding shown in (B). % FzlC in pellet was calculated by dividing the FzlC pellet band intensity by the total FzlC band intensity (pellet and supe) for each reaction. Error bars represent mean ± standard error of the mean (SEM) from three experimental replicates.
Figure 3
Figure 3. YFP-FzlC recruits FtsZ-CFP polymers to membranes inside giant unilamellar vesicles (GUVs)
(A–D) Fluorescence micrographs of representative GUVs containing the indicated proteins ± GTP. In (A, C, and D), normalized fluorescence intensities from lines scans across the representative GUVs are shown, as localizations were uniform for each of these GUV populations. In (B), the mean normalized fluorescence intensities of line scans across 18 GUVs for each condition (± GTP) are presented, and error bars (thin lines above and below middle line) represent standard deviation. Proteins were used at 2 μM, MgCl2 was present at 2.5 mM in all FtsZ-containing reactions and, where indicated, GTP was used at 2 mM. Scale bars = 5 μm.
Figure 4
Figure 4. FzlC and full length FtsZ, but not FtsZΔCTC, display FRET with GTP and PG vesicles in vitro
(A, B) Emission profiles of YFP-FzlC and FtsZ-CFP or FtsZΔCTC-CFP ± GTP in the presence (A) or absence (B) of PG vesicles after excitation at 435 nm. (C) FRET/CFP ratios of YFP-FzlC and FtsZ-CFP or FtsZΔCTC-CFP ± GTP in the presence or absence of PG vesicles. Error bars represent the mean FRET/CFP ratio ± SEM from three experimental replicates for reactions containing FtsZ-CFP and from two experimental replicates for reactions containing FtsZΔCTC-CFP, *** = p< 0.001, one-way ANOVA. Labels: ZC = FtsZ-CFP/YFP-FzlC, ΔZC = FtsZΔCTC-CFP/YFP-FzlC
Figure 5
Figure 5. High levels of FzlC interfere with efficient cytokinesis
(A,B) Phase contrast micrographs of cells containing empty vector (EG890) or vanillate-inducible fzlC overexpression vector (EG891) grown for 8 or 24 h in the presence of vanillate. The black arrows denote pointy poles (shape mode 6). Scale bar = 2 μm. (C–E) PCA of EG890 and EG891 produced seven different shape modes. Shown are scatter plots of shape modes 1, 2 and 6, which roughly correspond to length, curvature, and pole shape, respectively. Contours reflecting the mean shape and ± 1 or 2 standard deviations (s.d.) from the mean in each shape mode are shown to the left of the corresponding scatter plot. The differences between EG890 (n = 582 and 752 cells at 8 and 24 h, respectively) and EG891 (n = 658 and 817 cells at 8 and 24 h, respectively) were statistically significant for these three shape modes (*** = p < 0.001, Bonferroni’s Multiple Comparison Test).
Figure 6
Figure 6. High levels of FzlC broaden the Z-ring in constricting cells
(A) Phase contrast and merged fluorescent micrographs of cells containing xylose inducible ftsZ-yfp with an empty vector (EG1405) or vanillate-inducible fzlC overexpression vector (EG1406) grown in the presence of vanillate for 24 h and xylose for 1 h. The white asterisks denote focused Z-rings and white arrowheads denote more broad Z-rings at extended division sites. (B) Merged fluorescent micrographs from (A) with representative line scan full width half maximum (FWHM) measurements. Scatter plot shows the FWHM of Z-rings in cells with visible constrictions for EG1405 (n = 163) and EG1406 (n = 262) (*** = p < 0.001, unpaired t-test). (C) Phase contrast and merged micrographs of cells containing vanillate inducible ftsZ-cfp with empty vector (EG1285) or xylose-inducible ftsA overexpression vector (EG1302) grown in the presence of xylose for 4 h and vanillate for 1 h. The white asterisks denote focused Z-rings, the black arrowhead denotes deeply constricted sites, and the white arrowheads denote a more diffuse Z-ring. Scale bars = 2 μm.
Figure 7
Figure 7. Deletion of fzlC has synthetic interactions with non-essential division genes dipM, ftsE, and amiC
(A–D) Phase contrast micrographs of cells with or without fzlC in WT, ΔdipM, ΔftsE, or ΔamiC backgrounds. (Ai-Di) Cell length of strains in (A–D) (see Table S3 for sample sizes). Error bars represent the mean cell length ± SEM, *** = p < 0.001, one-way ANOVA. (Aii-Dii) Growth curves of strains shown in (A–D). Scale bars = 2 μm.
Figure 8
Figure 8. Z-ring assembly is unaffected in ΔfzlC cells but aberrant in ΔftsE cells
(A) Merged fluorescent (yellow) and phase contrast (blue) micrographs of cells with xylose-inducible ftsZ-yfp at the xylX locus in a WT (EG444) or ΔfzlC (EG1062) background. Demographs represent normalized signal profiles of FtsZ-YFP in cells arranged by increasing cell length. (B) Merged fluorescent (yellow) and phase contrast (blue) micrographs of cells with vanillate-inducible ftsZ-cfp at the vanillate locus in a WT (EG1215), ΔftsE (EG1148), or ΔftsEΔfzlC (EG1168) background. Demographs represent signal profiles of FtsZ-CFP in cells arranged by increasing cell length. Scale bar = 2 μm.
Figure 9
Figure 9. High levels of FzlC partially rescue the morphological, growth, and Z-ring structure defects in ΔftsE cells
(A) Phase contrast micrographs of ΔftsE cells with an empty vector (EG1357) or vanillate-inducible fzlC overexpression vector (EG1346) grown in the presence of vanillate for 24 h. (B,C) Growth curves and cell lengths of EG1357 and EG1346 cells shown in (A) (*** = p < 0.001, one-way ANOVA). (D) Xylose-inducible ftsZ-yfp at the xylX locus in an EG1357 or EG1346 background. Demographs represent normalized signal profiles of FtsZ-YFP in cells arranged by increasing cell length Scale bars = 2 μm.

Similar articles

Cited by

References

    1. Beall B, Luktenhaus J. Impaired cell division and sporulation of a Bacillus subtilis strain with the ftsA gene deleted. J Bacteriol. 1992;174:2389–403. - PMC - PubMed
    1. Bowman GR, et al. Caulobacter PopZ forms a polar subdomain dictating sequential changes in pole composition and function. Mol Microbiol. 2010;76:173–89. - PMC - PubMed
    1. Buss J, Coltharp C, Huang T, Pohlmeyer C, Wang SC, Hatem C, Xiao J. In vivo organization of the FtsZ-ring by ZapA and ZapB revealed by quantitative super-resolution microscopy. Mol Microbiol. 2013;89:1099–120. - PMC - PubMed
    1. Cabre EJ, et al. Bacterial division proteins FtsZ and ZipA induce vesicle shrinkage and cell membrane invagination. J Biol Chem. 2013;288:26625–26634. - PMC - PubMed
    1. Christen B, et al. The essential genome of a bacterium. Mol Syst Biol. 2011;7:528–34. - PMC - PubMed

Publication types

MeSH terms