

Unsupervised analysis reveals two molecular subgroups of serous ovarian cancer with distinct gene expression profiles and survival
- PMID: 27028324
- PMCID: PMC4869753
- DOI: 10.1007/s00432-016-2147-y
Unsupervised analysis reveals two molecular subgroups of serous ovarian cancer with distinct gene expression profiles and survival
Abstract
Purpose: Ovarian cancer is typically diagnosed at late stages, and thus, patients' prognosis is poor. Improvement in treatment outcomes depends, at least partly, on better understanding of ovarian cancer biology and finding new molecular markers and therapeutic targets.
Methods: An unsupervised method of data analysis, singular value decomposition, was applied to analyze microarray data from 101 ovarian cancer samples; then, selected genes were validated by quantitative PCR.
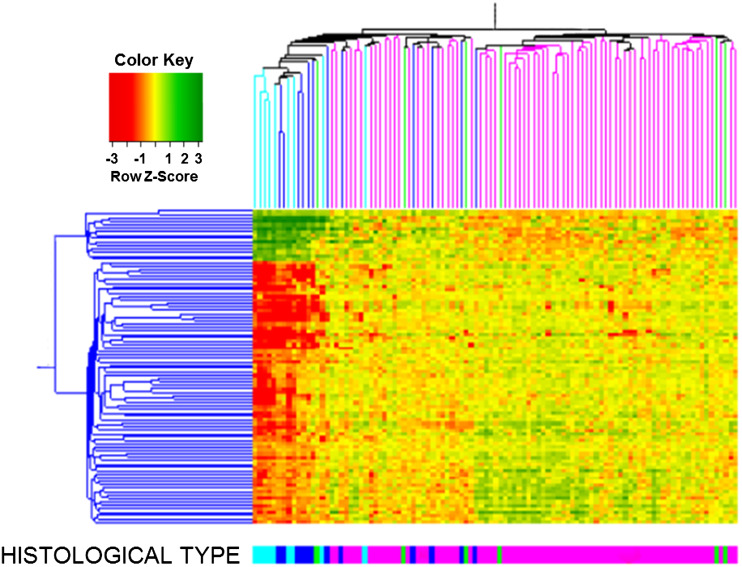
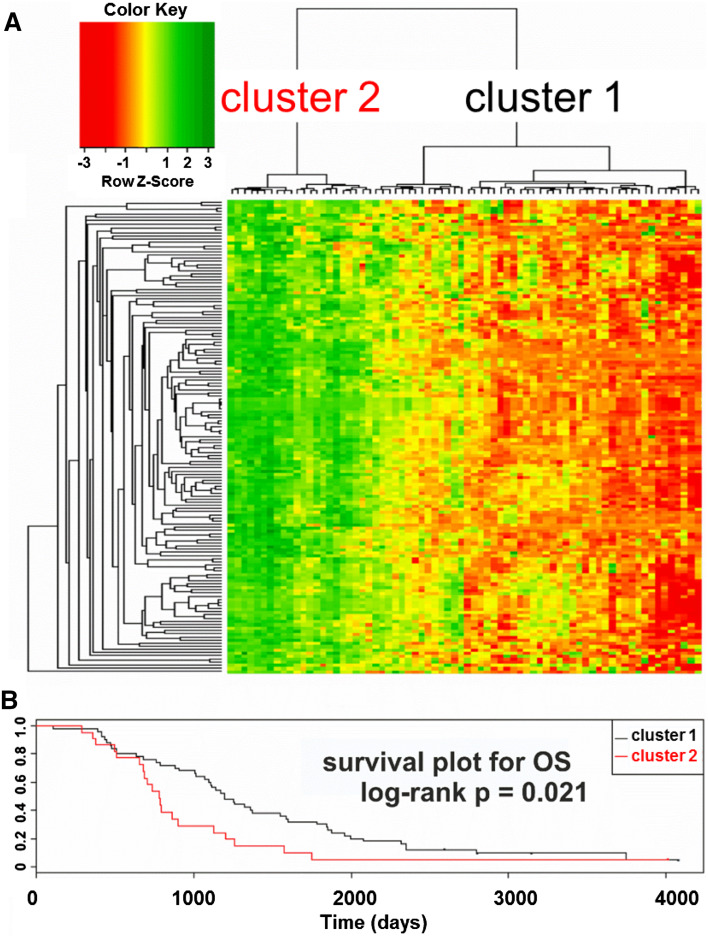
Results: We found that the major factor influencing gene expression in ovarian cancer was tumor histological type. The next major source of variability was traced to a set of genes mainly associated with extracellular matrix, cell motility, adhesion, and immunological response. Hierarchical clustering based on the expression of these genes revealed two clusters of ovarian cancers with different molecular profiles and distinct overall survival (OS). Patients with higher expression of these genes had shorter OS than those with lower expression. The two clusters did not derive from high- versus low-grade serous carcinomas and were unrelated to histological (ovarian vs. fallopian) origin. Interestingly, there was considerable overlap between identified prognostic signature and a recently described invasion-associated signature related to stromal desmoplastic reaction. Several genes from this signature were validated by quantitative PCR; two of them-DSPG3 and LOX-were validated both in the initial and independent sets of samples and were significantly associated with OS and disease-free survival.
Conclusions: We distinguished two molecular subgroups of serous ovarian cancers characterized by distinct OS. Among differentially expressed genes, some may potentially be used as prognostic markers. In our opinion, unsupervised methods of microarray data analysis are more effective than supervised methods in identifying intrinsic, biologically sound sources of variability. Moreover, as histological type of the tumor is the greatest source of variability in ovarian cancer and may interfere with analyses of other features, it seems reasonable to use histologically homogeneous groups of tumors in microarray experiments.
Keywords: Dermatan sulfate proteoglycan 3 (DSPG3); Gene expression analysis; Lysyl oxidase (LOX); Ovarian cancer; Prognostic biomarkers; Singular value decomposition (SVD).
Conflict of interest statement
The authors have no conflicts of interest.
Figures


References
-
- Barber HRSSC, Synder R, Kwon TH (1975) Histologic and nuclear grading and stromal reactions as indices for prognosis in ovarian cancer. Am J Obstet Gynecol 121:795–807 - PubMed
-
- Bignotti E, Tassi RA, Calza S, Ravaggi A, Bandiera E, Rossi E, Donzelli C, Pasinetti B, Pecorelli S, Santin AD (2007) Gene expression profile of ovarian serous papillary carcinomas: identification of metastasis-associated genes. Am J Obstet Gynecol 196:245.e1–245.e11 - PubMed
-
- Chan A, Gilks B, Kwon J, Tinker AV (2012) New insights into the pathogenesis of ovarian carcinoma: time to rethink ovarian cancer screening. Obstet Gynecol 120:935–940 - PubMed
-
- Cheon DJ, Tong Y, Sim MS, Dering J, Berel D, Cui X, Lester J, Beach JA, Tighiouart M, Walts AE, Karlan BY, Orsulic S (2014) A collagen-remodeling gene signature regulated by TGF-beta signaling is associated with metastasis and poor survival in serous ovarian cancer. Clin Cancer Res 20:711–723 - PMC - PubMed
-
- Dansonka-Mieszkowska A, Ludwig AH, Kraszewska E, Kupryjanczyk J (2006) Geographical variations in TP53 mutational spectrum in ovarian carcinomas. Ann Hum Genet 70:594–604 - PubMed
MeSH terms
LinkOut - more resources
Full Text Sources
Other Literature Sources
Medical
Molecular Biology Databases
