

Single-Molecule Chemo-Mechanical Spectroscopy Provides Structural Identity of Folding Intermediates
- PMID: 27028638
- PMCID: PMC4816687
- DOI: 10.1016/j.bpj.2015.12.042
Single-Molecule Chemo-Mechanical Spectroscopy Provides Structural Identity of Folding Intermediates
Abstract
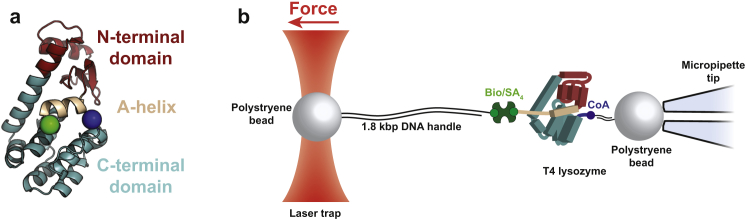
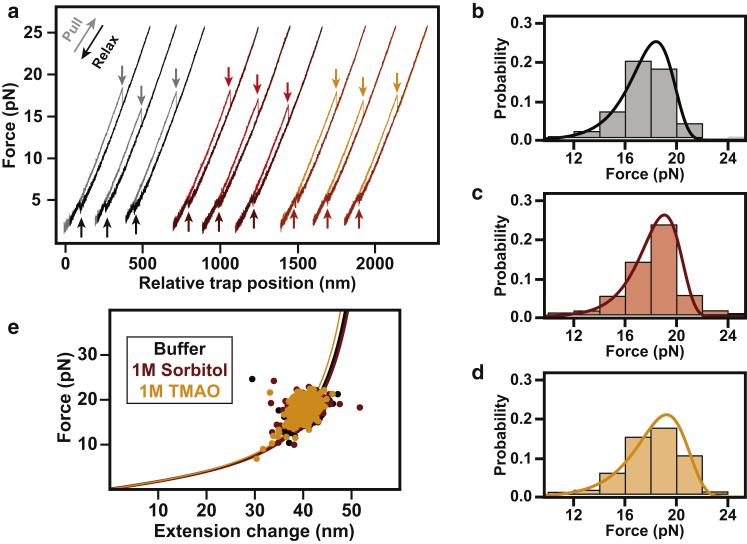
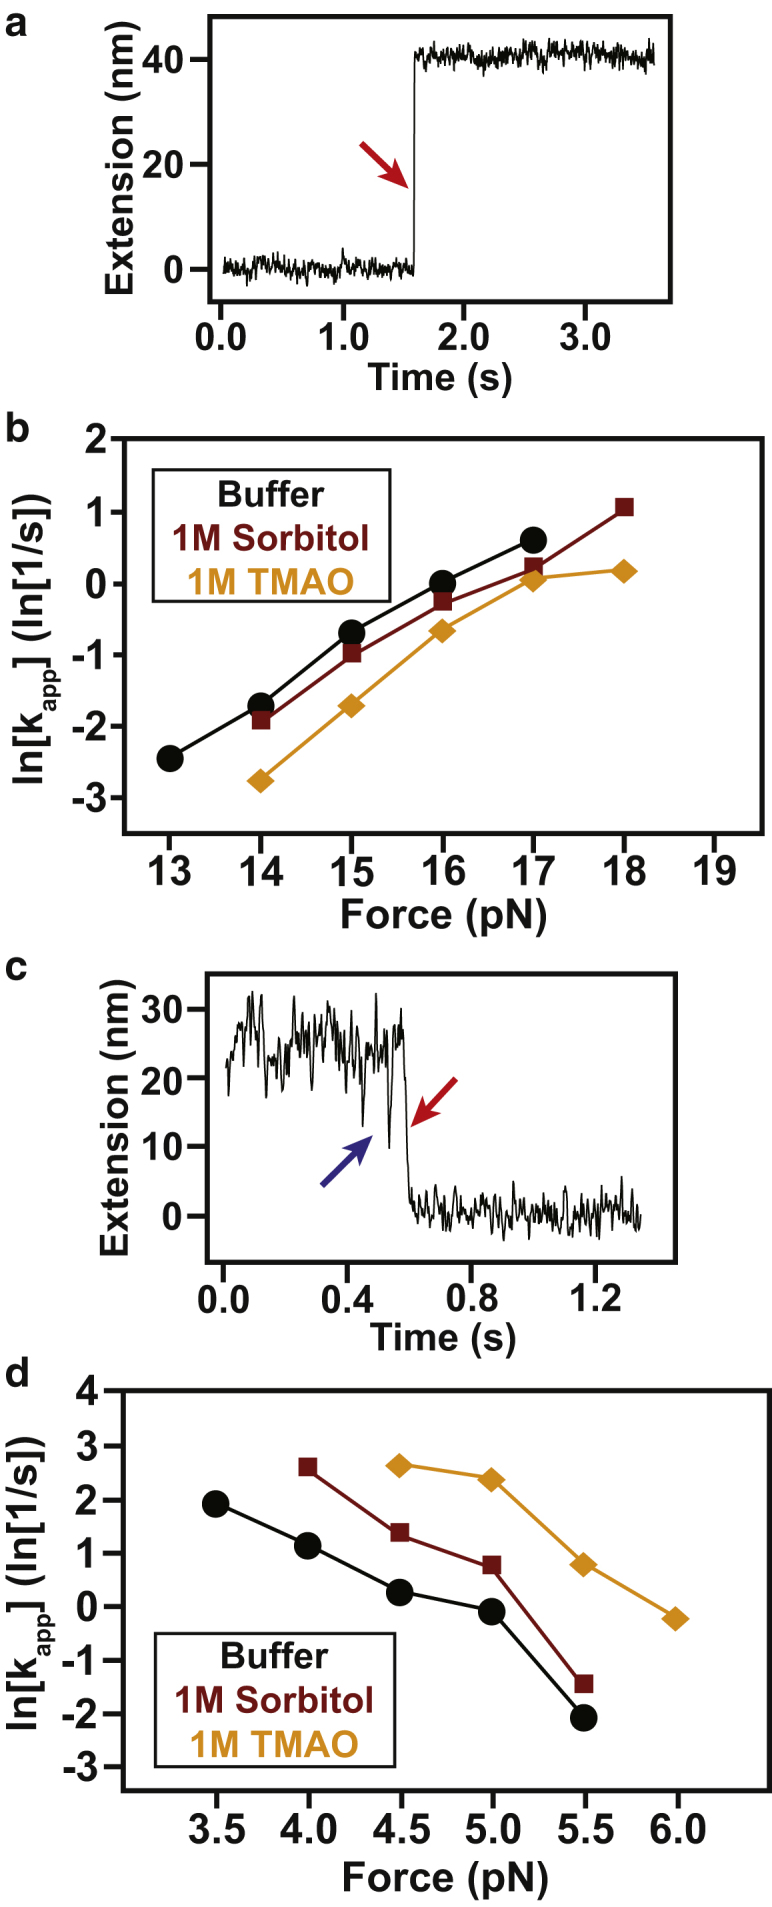
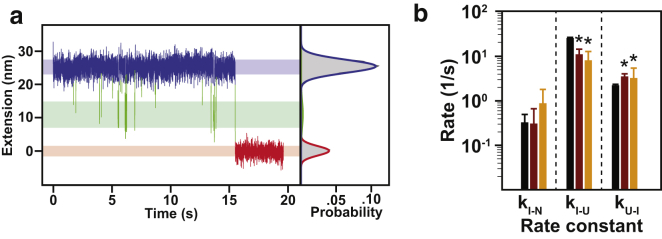
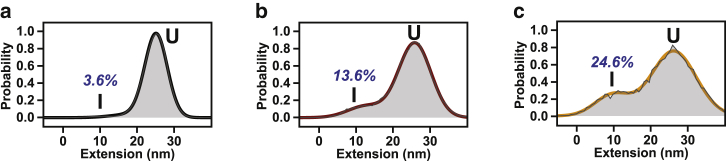
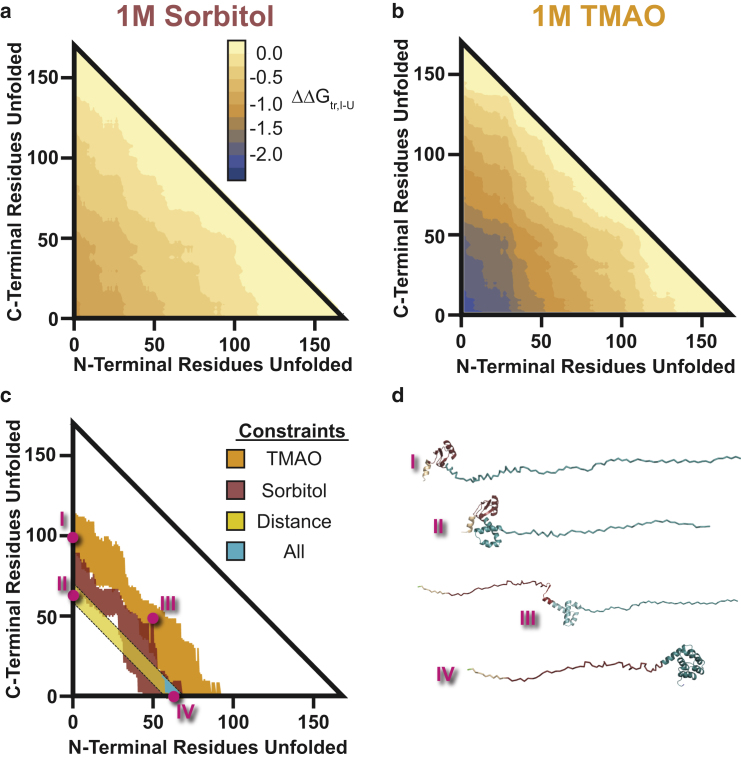
Single-molecule force spectroscopy has emerged as a powerful tool for studying the folding of biological macromolecules. Mechanical manipulation has revealed a wealth of mechanistic information on transient and intermediate states. To date, the majority of state assignment of intermediates has relied on empirical demarcation. However, performing such experiments in the presence of different osmolytes provides an alternative approach that reports on the structural properties of intermediates. Here, we analyze the folding and unfolding of T4 lysozyme with optical tweezers under a chemo-mechanical perturbation by adding osmolytes. We find that two unrelated protective osmolytes, sorbitol and trimethylamine-n-oxide, function by marginally decelerating unfolding rates and specifically modulating early events in the folding process, stabilizing formation of an on-pathway intermediate. The chemo-mechanical perturbation provides access to two independent metrics of the relevant states during folding trajectories, the contour length, and the solvent-accessible surface area. We demonstrate that the dependence of the population of the intermediate in different osmolytes, in conjunction with its measured contour length, provides the ability to discriminate between potential structural models of intermediate states. Our study represents a general strategy that may be employed in the structural modeling of equilibrium intermediate states observed in single-molecule experiments.
Copyright © 2016 Biophysical Society. Published by Elsevier Inc. All rights reserved.
Figures
Comment in
-
Untangling a Structurally Resolved Protein Folding Intermediate.Biophys J. 2016 Mar 29;110(6):1205-6. doi: 10.1016/j.bpj.2016.01.028. Biophys J. 2016. PMID: 27028629 Free PMC article. No abstract available.
Similar articles
-
Using Single-Molecule Chemo-Mechanical Unfolding to Simultaneously Probe Multiple Structural Parameters in Protein Folding.Methods Protoc. 2019 Apr 20;2(2):32. doi: 10.3390/mps2020032. Methods Protoc. 2019. PMID: 31164612 Free PMC article.
-
Exploring subdomain cooperativity in T4 lysozyme II: uncovering the C-terminal subdomain as a hidden intermediate in the kinetic folding pathway.Protein Sci. 2007 May;16(5):852-62. doi: 10.1110/ps.062632807. Epub 2007 Mar 30. Protein Sci. 2007. PMID: 17400925 Free PMC article.
-
An integrated kinetic analysis of intermediates and transition states in protein folding reactions.J Mol Biol. 1995 Nov 10;253(5):771-86. doi: 10.1006/jmbi.1995.0590. J Mol Biol. 1995. PMID: 7473751
-
Probing invisible, low-populated States of protein molecules by relaxation dispersion NMR spectroscopy: an application to protein folding.Acc Chem Res. 2008 Mar;41(3):442-51. doi: 10.1021/ar700189y. Epub 2008 Feb 15. Acc Chem Res. 2008. PMID: 18275162 Review.
-
On-pathway versus off-pathway folding intermediates.Fold Des. 1996;1(1):R1-8. doi: 10.1016/S1359-0278(96)00003-X. Fold Des. 1996. PMID: 9079355 Review.
Cited by
-
Protons Are Fast and Smart; Proteins Are Slow and Dumb: On the Relationship of Electrospray Ionization Charge States and Conformations.J Am Soc Mass Spectrom. 2021 Jul 7;32(7):1553-1561. doi: 10.1021/jasms.1c00100. Epub 2021 Jun 21. J Am Soc Mass Spectrom. 2021. PMID: 34151568 Free PMC article.
-
The Ensemble Basis of Allostery and Function: Insights from Models of Local Unfolding.J Mol Biol. 2025 Jun 9:169287. doi: 10.1016/j.jmb.2025.169287. Online ahead of print. J Mol Biol. 2025. PMID: 40499749 Review.
-
Using Single-Molecule Chemo-Mechanical Unfolding to Simultaneously Probe Multiple Structural Parameters in Protein Folding.Methods Protoc. 2019 Apr 20;2(2):32. doi: 10.3390/mps2020032. Methods Protoc. 2019. PMID: 31164612 Free PMC article.
-
The ribosome destabilizes native and non-native structures in a nascent multidomain protein.Protein Sci. 2017 Jul;26(7):1439-1451. doi: 10.1002/pro.3189. Epub 2017 May 19. Protein Sci. 2017. PMID: 28474852 Free PMC article.
-
Single-Molecule Studies of Protein Folding with Optical Tweezers.Annu Rev Biochem. 2020 Jun 20;89:443-470. doi: 10.1146/annurev-biochem-013118-111442. Annu Rev Biochem. 2020. PMID: 32569525 Free PMC article. Review.
References
-
- Cecconi C., Shank E.A., Marqusee S. Direct observation of the three-state folding of a single protein molecule. Science. 2005;309:2057–2060. - PubMed
Publication types
MeSH terms
Substances
Grants and funding
LinkOut - more resources
Full Text Sources
Other Literature Sources
