. 2016 Jul 1;594(13):3589-607.
doi: 10.1113/JP272122. Epub 2016 May 10.

Murine startle mutant Nmf11 affects the structural stability of the glycine receptor and increases deactivation

Affiliations

Murine startle mutant Nmf11 affects the structural stability of the glycine receptor and increases deactivation

Megan E Wilkins et al. J Physiol. .

Abstract

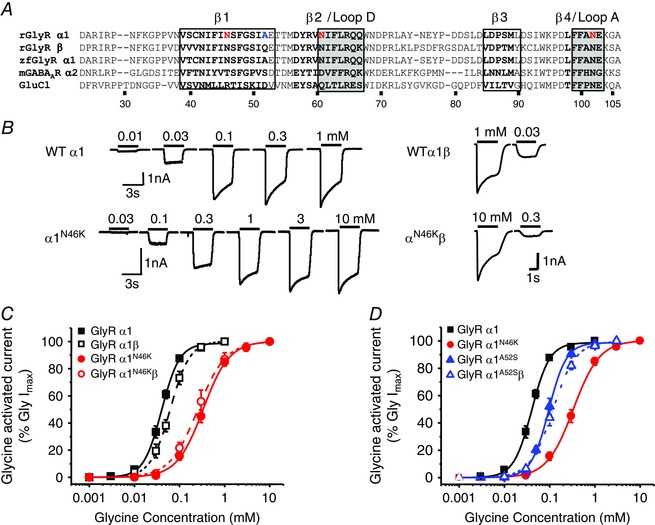
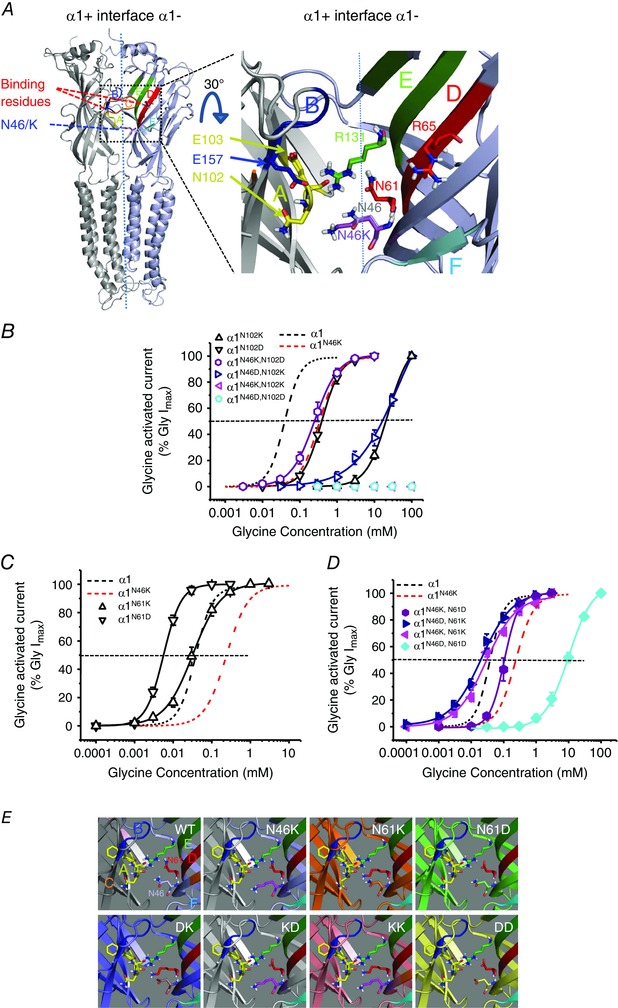
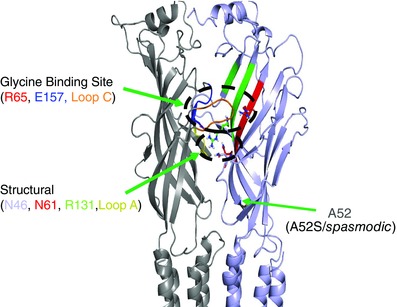
Key points: Hyperekplexia or startle disease is a serious neurological condition affecting newborn children and usually involves dysfunctional glycinergic neurotransmission. Glycine receptors (GlyRs) are major mediators of inhibition in the spinal cord and brainstem. A missense mutation, replacing asparagine (N) with lysine (K), at position 46 in the GlyR α1 subunit induced hyperekplexia following a reduction in the potency of the transmitter glycine; this resulted from a rapid deactivation of the agonist current at mutant GlyRs. These effects of N46K were rescued by mutating a juxtaposed residue, N61 on binding Loop D, suggesting these two asparagines may interact. Asparagine 46 is considered to be important for the structural stability of the subunit interface and glycine binding site, and its mutation represents a new mechanism by which GlyR dysfunction induces startle disease.

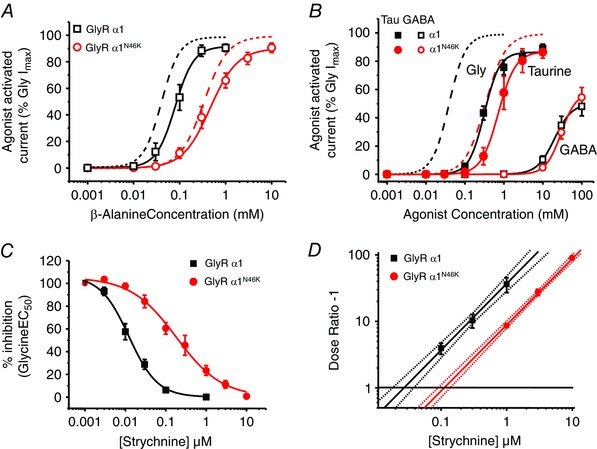
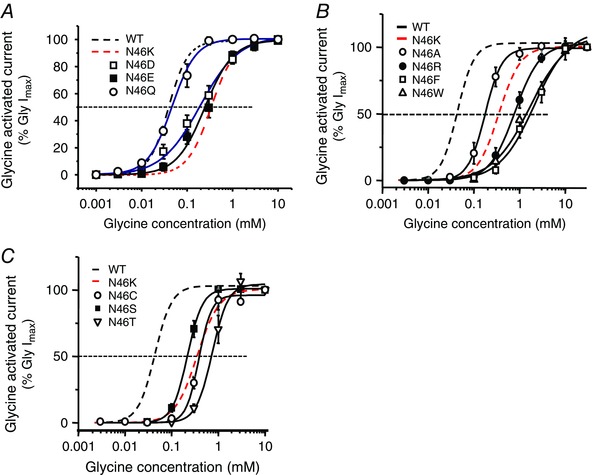
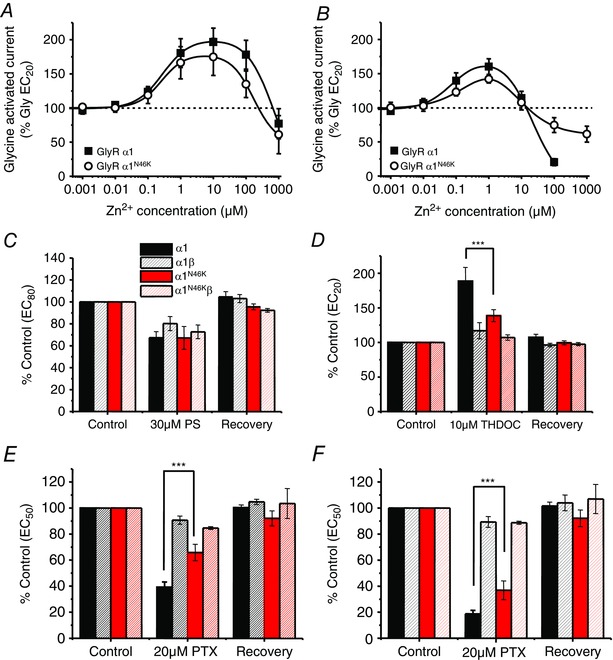
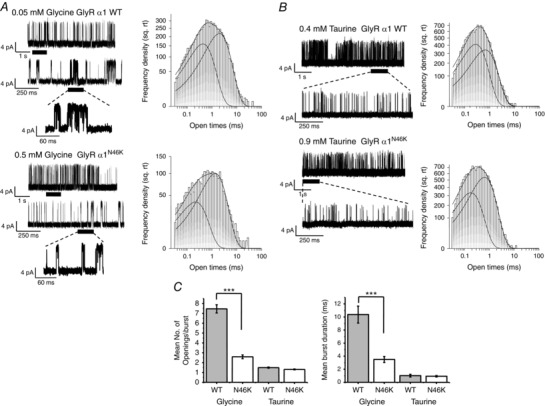
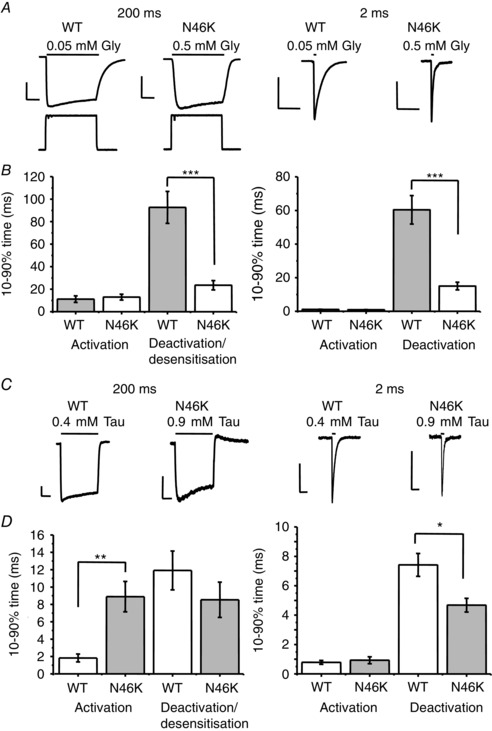
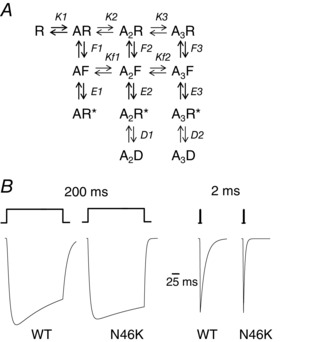
Abstract: Dysfunctional glycinergic inhibitory transmission underlies the debilitating neurological condition, hyperekplexia, which is characterised by exaggerated startle reflexes, muscle hypertonia and apnoea. Here we investigated the N46K missense mutation in the GlyR α1 subunit gene found in the ethylnitrosourea (ENU) murine mutant, Nmf11, which causes reduced body size, evoked tremor, seizures, muscle stiffness, and morbidity by postnatal day 21. Introducing the N46K mutation into recombinant GlyR α1 homomeric receptors, expressed in HEK cells, reduced the potencies of glycine, β-alanine and taurine by 9-, 6- and 3-fold respectively, and that of the competitive antagonist strychnine by 15-fold. Replacing N46 with hydrophobic, charged or polar residues revealed that the amide moiety of asparagine was crucial for GlyR activation. Co-mutating N61, located on a neighbouring β loop to N46, rescued the wild-type phenotype depending on the amino acid charge. Single-channel recording identified that burst length for the N46K mutant was reduced and fast agonist application revealed faster glycine deactivation times for the N46K mutant compared with the WT receptor. Overall, these data are consistent with N46 ensuring correct alignment of the α1 subunit interface by interaction with juxtaposed residues to preserve the structural integrity of the glycine binding site. This represents a new mechanism by which GlyR dysfunction induces startle disease.


Figures

Figure 1
Figure 1. N46K GlyR is less sensitive to glycine
A, primary sequence alignment comparing rat (r) and zebrafish (zf) GlyR α1 and β subunits to other pentameric ligand‐gated ion channel (pLGIC) family members: mouse (m) GABAAR α2 and C. elegans GluCl. The amino acid numbering refers to the mature rGlyR α1. The red highlighted residues indicate those mutated in this study. The black bold residues form β sheets, whilst those residues that form ligand binding loops and interspersed β loops are boxed. B, sample whole‐cell currents activated by 0.01, 0.03, 0.1, 0.3 and 1 mm glycine for WT α1 (upper left) and 0.03, 0.1, 0.3, 1, 3 and 10 mm glycine for α1N46K (lower left). Right panels show EC20 and maximal glycine‐activated currents for HEK cells expressing heteromeric WT and N46K GlyRs. Bars indicate the durations of glycine application. C, concentration–response curves normalised to the maximal glycine‐activated response for homomeric α1 and heteromeric α1β wild‐type (WT) and N46K GlyRs. In all figures, the symbols represent means ± SEM. D, comparing concentration–response curves for glycine at WT, N46K and A52S mutant GlyRα1. The A52S homomeric and heteromeric GlyR EC50s of 101 ± 10 μm (n = 9) and 118 ± 4 μm (n = 6) are significantly lower than that for the N46K GlyR (P < 0.05).
Figure 2
Figure 2. N46K reduces partial agonist potency and strychnine affinity
A, β‐alanine concentration–response curves for WT and N46K GlyRs, normalised to the maximal glycine‐activated current for each cell. Glycine curves taken from Fig. 1 C are shown as dashed lines. The β‐alanine EC50s are: 90 ± 16 μm (WT; n = 7) and 552 ± 151 μm (N46K, n = 9) and relative maximum responses are WT = 92 ± 3%; N46K = 90 ± 3%. B, taurine and GABA concentration–response curves for activating homomeric WT and N46K GlyRs normalised to the maximum glycine‐activated current for each cell. Dashed lines are the curves for glycine activation of homomeric WT and N46K receptors from Fig. 1 C for comparison. C, inhibition concentration–response curves for strychnine antagonism of an EC50 glycine response for WT (IC50: 12.2 ± 2.2 nm; n = 8) and N46K (IC50: 193.4 ± 52.3 nm; n = 10). D, Schild plot analysis of competitive antagonism by strychnine of EC50 responses to glycine for WT and N46K GlyRs. Points represent mean dose‐ratios (DRs) from all cells examined at each antagonist concentration. The lines are fitted by linear regression and generated by the Schild equation with a constrained slope = 1. The dotted lines depict the upper and lower 95% confidence intervals. The intercepts with the line at DR ˗ 1 = 1, reveal the antagonist equilibrium constants.
Figure 3
Figure 3. Analysing the functional impact of residue 46 side‐chain
A, glycine concentration–response curves for GlyRs with conservative or charged N46 mutations. B, glycine concentration–response curves for mutations substituting N46 for alanine, phenylalanine, tryptophan or arginine. C, glycine concentration–response curves for N46 mutations with smaller polar side‐chain residues, lacking an amide group, including cysteine, serine and threonine. See Table 1 for EC50 values.
Figure 4
Figure 4. Structure–function analyses of N46
A, left panel, homology model of two adjacent GlyR α1 subunits. Right panel, expanded 30o tilted view of the α1 subunit–subunit interface. The locations for N46 (grey) and K46 (purple) are shown, as well as two key glycine binding residues: R65 (red, loop D) and E157 (blue, loop B); and relative side‐chain orientations for N61 (red) and R131 (green) at the complementary (˗) subunit interface, and N102/E103 (yellow) located on the principal side (+) of the interface. The glycine binding loops are: A (yellow), B (blue), C (orange; removed for clarity), D (red), E (green) and F (cyan). B, glycine concentration–response curves for reverse charge mutations at N102 and N46. Single mutations of N102 to lysine or aspartate shifted the glycine curves to the right. Note substitutions of N46 and N102 with reverse charges (N46K‐N102D: EC50 0.29 ± 0.07 mm; n = 7, N46D‐N102K; EC50 41 ± 9 mm; n = 6) did not restore WT GlyR sensitivity to glycine. Substitution of both N46 and N102 with the same charged residues abolished sensitivity to glycine. C, the glycine curve for N61K overlays the WT curve, whilst N61D caused a shift to the left. D, glycine concentration–response curves for paired N46 and N61 mutant GlyRs. Exchanging N46 and N61 with reverse charge mutants regained some (N46K‐N61D) or all (N46D‐N61K) of the sensitivity to glycine. Substitution of N46 and N61 with the same charge, either recovered (N46K‐N61K) or reduced (N46D‐N61D) the sensitivity to glycine compared to N46K GlyRs. E, homology models for N46 and N61 mutations in relation to the surrounding residues in the same plane. Binding loops that are involved in the orthosteric binding site of pLGICs are shown colour‐coded: loop A (yellow), loop B (blue), loop C (orange; removed for clarity), loop D (red), loop E (green) and loop F (cyan). DK – N46D, N61K; KD – N46K, N61D; KK – N46K, N61K; DD – N46D, N61D.
Figure 5
Figure 5. Allosteric modulation at WT and N46K GlyRs
A, Zn2+ concentration modulation curves for the glycine EC20 response on WT and N46K GlyRα1. By co‐applying Zn2+ with EC20 glycine, there was no significant change in the potentiation or inhibition of the glycine‐activated peak current on WT compared with N46K GlyRα1. B, modulation of glycine EC20 responses following pre‐ and co‐application of Zn2+ (n = 5). C, effect of the neurosteroid, pregnenolone sulphate (PS; 30 μm; n = 5–9) on peak glycine EC80 currents for α1, α1β, α1N46K and α1N46Kβ GlyRs. D, effect of the neurosteroid THDOC (10 μm; n = 4–11) on peak glycine EC20 currents for α1, α1β, α1N46K and α1N46Kβ GlyRs. E, effect of picrotoxin (20 μm), a GlyR channel blocker, on peak EC50 glycine‐activated currents for α1, α1β, α1N46K and α1N46Kβ GlyRs (n = 4–6; ***P < 0.0001). F, effect of picrotoxin (20 μm), a GlyR channel blocker, on steady‐state EC50 glycine‐activated currents for α1, α1β, α1N46K and α1N46Kβ GlyRs (n = 4–6; ***P < 0.0001).
Figure 6
Figure 6. Glycine and taurine single‐channel currents for WT and N46K GlyRs
A, left, cell‐attached recordings of single‐channel currents evoked by EC60 concentrations of glycine on HEK cells expressing homomeric WT and N46K GlyRs. Right, dwell time distributions for open states. Individual exponential density functions required to fit components of the open time distributions are shown, including the overall fit. B, left, cell‐attached recordings of single‐channel currents evoked by EC60 concentrations of taurine on WT and N46K GlyRs. Right, open time distributions for taurine currents fitted with exponential density functions. C, the mean number of openings per burst (left panel) and mean burst durations (right panel) were determined for WT and N46K in the presence of glycine and taurine. See Table 3 for values (***P < 0.0001).
Figure 7
Figure 7. Glycine currents deactivate faster for N46K compared to WT GlyRs
A, glycine currents recorded from outside‐out macropatches evoked by applying EC60 concentrations of glycine (Gly) for either 200 ms (left panel) or 2 ms (right panel) on HEK cells expressing WT GlyRs and N46K GlyRs. Open tip responses are shown in response to a pulse of 50% physiological salt solution/H2O. Calibration bars are 50 ms and 200 pA. B, bar graphs quantify the 10–90% glycine activation and deactivation/desensitisation rates (n = 6–9; ***P < 0.0001). C, recordings from outside‐out macropatches evoked by EC60 concentrations of taurine (Tau) for 200 ms (left panel) or 2 ms (right panel) on HEK cells expressing WT GlyRs (0.4 mm) and N46K GlyRs (0.9 mm). Calibration bars are 50 ms and 50 pA. D, bar graphs report the taurine 10–90% activation rates and also the deactivation/ desensitisation rates (n = 6–9; *P < 0.05; **P < 0.005).
Figure 8
Figure 8. Simulations of glycine currents at WT and N46K GlyRα1
A, a kinetic model of the GlyR depicting 4 shut states (R, AR, A2R and A3R), with 3 of these bound with up to 3 molecules of glycine (A). Once agonist is bound, the AR, A2R and A3R states can undergo pre‐activation conformational transitions to states AF, A2F and A3F, which are still shut states. These states can then undergo a gating reaction to form AR*, A2R* and A3R*, which are open conducting states. Two of these, A2R* and A3R* can enter into agonist‐bound desensitised states (A2D and A3D) when exposed to higher agonist concentrations. Here, K is the agonist dissociation constant (unbinding/binding rate = k ˗ 1/k1) taking account of statistical factors for agonist binding and unbinding; Kf is the agonist dissociation constant (k f‐/k f+) for the pre‐activation states; F is the pre‐activation conformation constant, = f 1/f ‐1; E is the gating constant, (= β/α); and D represents the desensitisation constant (= δ1‐1; F, E and D = forward/backward rates). B, predicted matched glycine‐activated currents for WT (left, 50 μm) and N46K GlyRs (right, 500 μm) using the model described in A. Glycine was applied for either 2 or 200 ms. Note the faster deactivations for N46K which largely result from increases in K and particularly in Kf for the transition, A2F ↔ A3F. See text for details.
Figure 9
Figure 9. Structural model of the GlyR
Model showing a side‐view of the GlyRα1 subunit interface highlighting the important structural residues, N46, N61 and R131, all residing in the same plane as loop A and positioned below the orthosteric glycine binding site, involving residues: R65, E157 and loop C.

References

    1. Arunlakshana O & Schild HO (1959). Some quantitative uses of drug antagonists. Br J Pharmacol Chemother 14, 48–58. - PMC - PubMed
    1. Belelli D, Pistis M, Peters JA & Lambert JJ (1999). The interaction of general anaesthetics and neurosteroids with GABAA and glycine receptors. Neurochem Int 34, 447–452. - PubMed
    1. Bloomenthal AB, Goldwater E, Pritchett DB & Harrison NL (1994). Biphasic modulation of the strychnine‐sensitive glycine receptor by Zn2+ . Mol Pharmacol 46, 1156–1159. - PubMed
    1. Brams M, Pandya A, Kuzmin D, van ER, Krijnen L, Yakel JL, Tsetlin V, Smit AB & Ulens C (2011). A structural and mutagenic blueprint for molecular recognition of strychnine and d‐tubocurarine by different cys‐loop receptors. PLoS Biol 9, e1001034. - PMC - PubMed
    1. Brejc K, van Dijk WJ, Smit AB & Sixma TK (2002). The 2.7 A structure of AChBP, homologue of the ligand‐binding domain of the nicotinic acetylcholine receptor. Novartis Found Symp 245, 22–29. - PubMed