

Strong Selection Significantly Increases Epistatic Interactions in the Long-Term Evolution of a Protein
- PMID: 27028897
- PMCID: PMC4814079
- DOI: 10.1371/journal.pgen.1005960
Strong Selection Significantly Increases Epistatic Interactions in the Long-Term Evolution of a Protein
Abstract
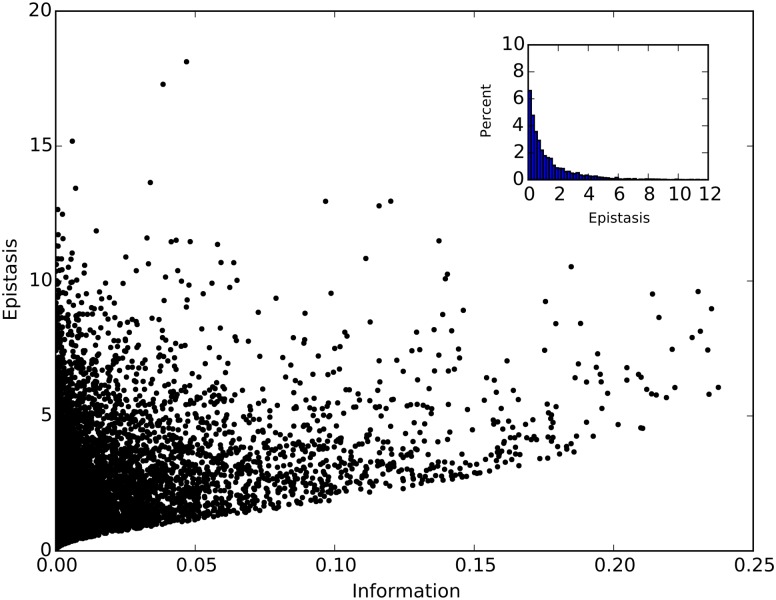
Epistatic interactions between residues determine a protein's adaptability and shape its evolutionary trajectory. When a protein experiences a changed environment, it is under strong selection to find a peak in the new fitness landscape. It has been shown that strong selection increases epistatic interactions as well as the ruggedness of the fitness landscape, but little is known about how the epistatic interactions change under selection in the long-term evolution of a protein. Here we analyze the evolution of epistasis in the protease of the human immunodeficiency virus type 1 (HIV-1) using protease sequences collected for almost a decade from both treated and untreated patients, to understand how epistasis changes and how those changes impact the long-term evolvability of a protein. We use an information-theoretic proxy for epistasis that quantifies the co-variation between sites, and show that positive information is a necessary (but not sufficient) condition that detects epistasis in most cases. We analyze the "fossils" of the evolutionary trajectories of the protein contained in the sequence data, and show that epistasis continues to enrich under strong selection, but not for proteins whose environment is unchanged. The increase in epistasis compensates for the information loss due to sequence variability brought about by treatment, and facilitates adaptation in the increasingly rugged fitness landscape of treatment. While epistasis is thought to enhance evolvability via valley-crossing early-on in adaptation, it can hinder adaptation later when the landscape has turned rugged. However, we find no evidence that the HIV-1 protease has reached its potential for evolution after 9 years of adapting to a drug environment that itself is constantly changing. We suggest that the mechanism of encoding new information into pairwise interactions is central to protein evolution not just in HIV-1 protease, but for any protein adapting to a changing environment.
Conflict of interest statement
The authors have declared that no competing interests exist.
Figures
Comment in
-
Shared Information between Residues Is Sufficient to Detect Pairwise Epistasis in a Protein.PLoS Genet. 2016 Dec 22;12(12):e1006471. doi: 10.1371/journal.pgen.1006471. eCollection 2016 Dec. PLoS Genet. 2016. PMID: 28005913 Free PMC article. No abstract available.
Similar articles
-
Limits to detecting epistasis in the fitness landscape of HIV.PLoS One. 2022 Jan 18;17(1):e0262314. doi: 10.1371/journal.pone.0262314. eCollection 2022. PLoS One. 2022. PMID: 35041711 Free PMC article.
-
Shifting Fitness and Epistatic Landscapes Reflect Trade-offs along an Evolutionary Pathway.J Mol Biol. 2016 Jul 3;428(13):2730-43. doi: 10.1016/j.jmb.2016.04.033. Epub 2016 May 10. J Mol Biol. 2016. PMID: 27173379
-
Protein promiscuity: drug resistance and native functions--HIV-1 case.J Biomol Struct Dyn. 2005 Jun;22(6):615-24. doi: 10.1080/07391102.2005.10531228. J Biomol Struct Dyn. 2005. PMID: 15842167
-
Genomic investigations of evolutionary dynamics and epistasis in microbial evolution experiments.Curr Opin Genet Dev. 2015 Dec;35:33-9. doi: 10.1016/j.gde.2015.08.008. Epub 2015 Sep 14. Curr Opin Genet Dev. 2015. PMID: 26370471 Free PMC article. Review.
-
Epistasis in protein evolution.Protein Sci. 2016 Jul;25(7):1204-18. doi: 10.1002/pro.2897. Epub 2016 Feb 28. Protein Sci. 2016. PMID: 26833806 Free PMC article. Review.
Cited by
-
Mutual information networks reveal evolutionary relationships within the influenza A virus polymerase.Virus Evol. 2023 May 27;9(1):vead037. doi: 10.1093/ve/vead037. eCollection 2023. Virus Evol. 2023. PMID: 37325086 Free PMC article.
-
Shared Information between Residues Is Sufficient to Detect Pairwise Epistasis in a Protein.PLoS Genet. 2016 Dec 22;12(12):e1006471. doi: 10.1371/journal.pgen.1006471. eCollection 2016 Dec. PLoS Genet. 2016. PMID: 28005913 Free PMC article. No abstract available.
-
Potts Hamiltonian models of protein co-variation, free energy landscapes, and evolutionary fitness.Curr Opin Struct Biol. 2017 Apr;43:55-62. doi: 10.1016/j.sbi.2016.11.004. Epub 2016 Nov 18. Curr Opin Struct Biol. 2017. PMID: 27870991 Free PMC article. Review.
-
Highly expressed genes evolve under strong epistasis from a proteome-wide scan in E. coli.Sci Rep. 2017 Nov 20;7(1):15844. doi: 10.1038/s41598-017-16030-z. Sci Rep. 2017. PMID: 29158562 Free PMC article.
-
Inferring genetic interactions from comparative fitness data.Elife. 2017 Dec 20;6:e28629. doi: 10.7554/eLife.28629. Elife. 2017. PMID: 29260711 Free PMC article.
References
Publication types
MeSH terms
Substances
LinkOut - more resources
Full Text Sources
Other Literature Sources
