. 2016 Mar 30;12(3):e1005520.
doi: 10.1371/journal.ppat.1005520. eCollection 2016 Mar.

Optimal Combinations of Broadly Neutralizing Antibodies for Prevention and Treatment of HIV-1 Clade C Infection

Affiliations

Optimal Combinations of Broadly Neutralizing Antibodies for Prevention and Treatment of HIV-1 Clade C Infection

Kshitij Wagh et al. PLoS Pathog. .

Abstract

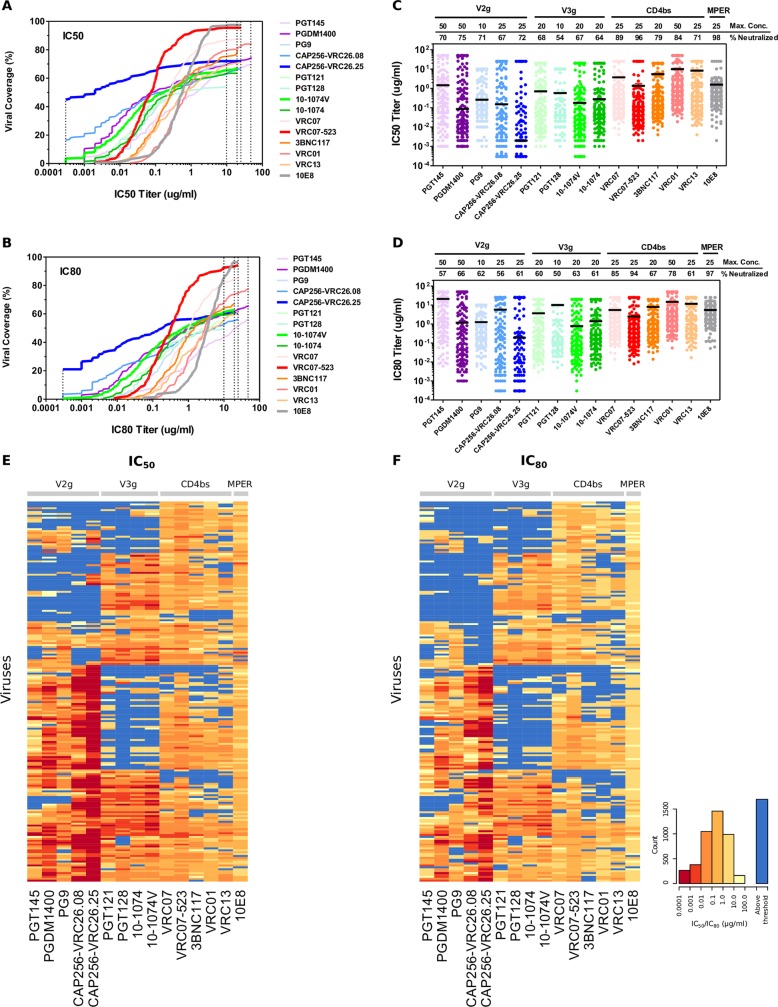
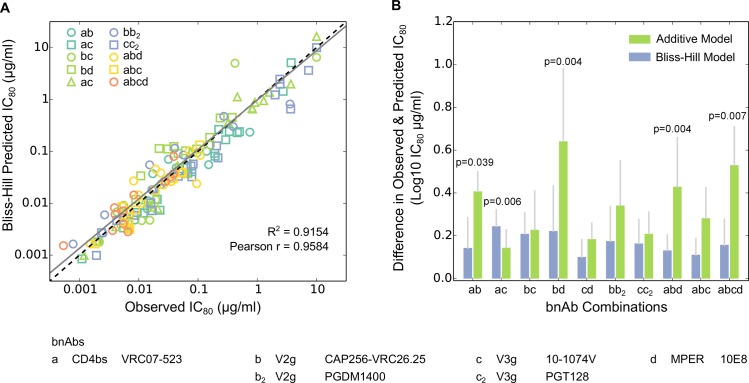
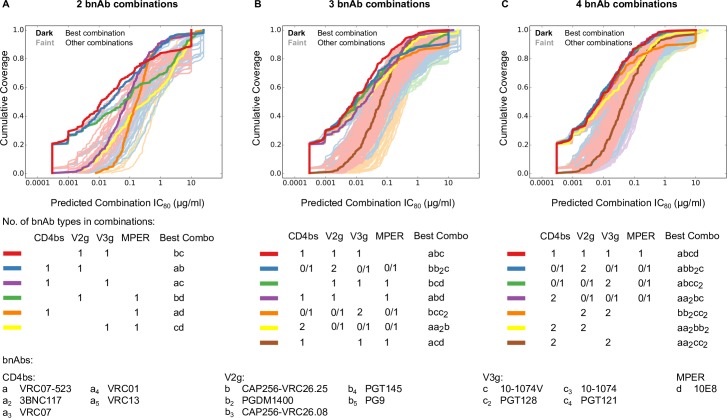
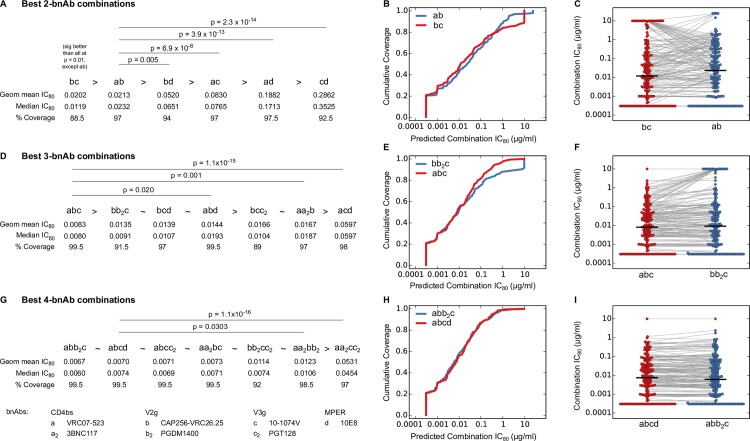
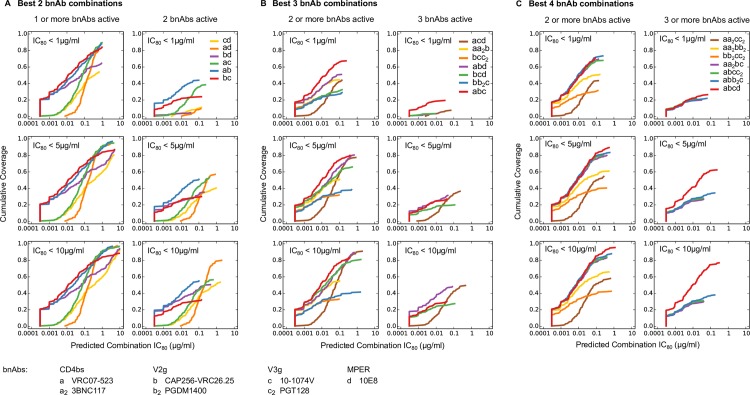
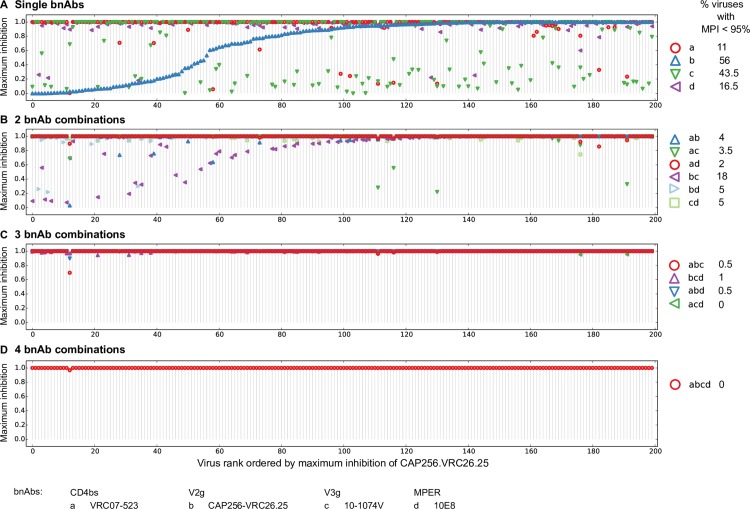
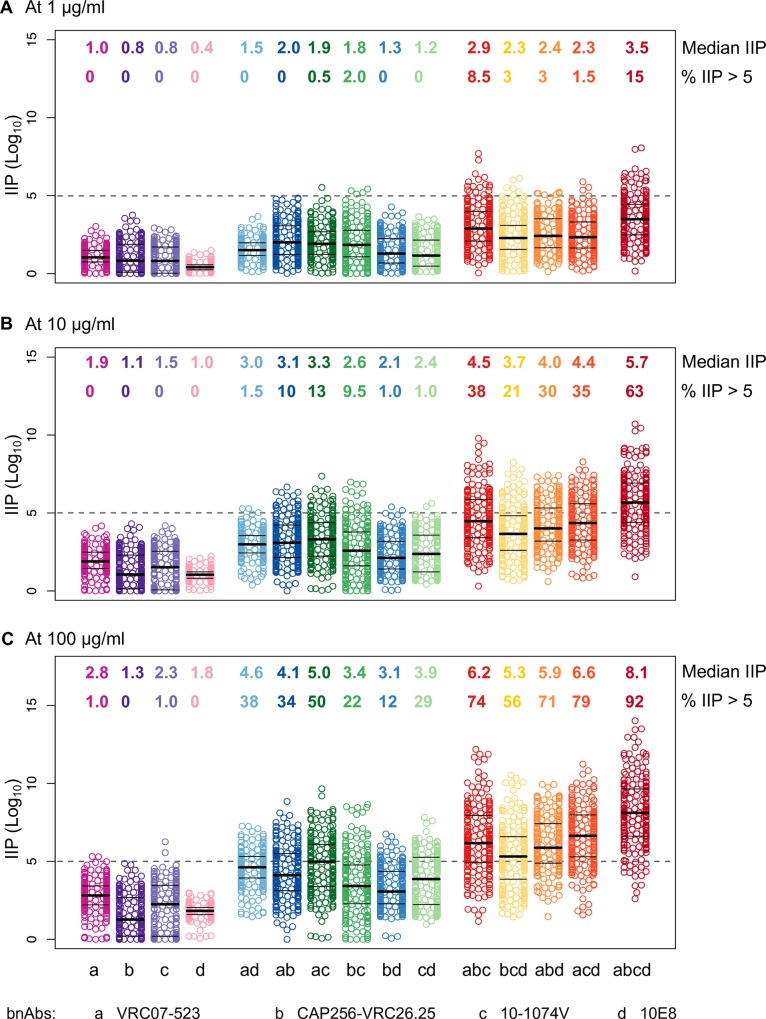
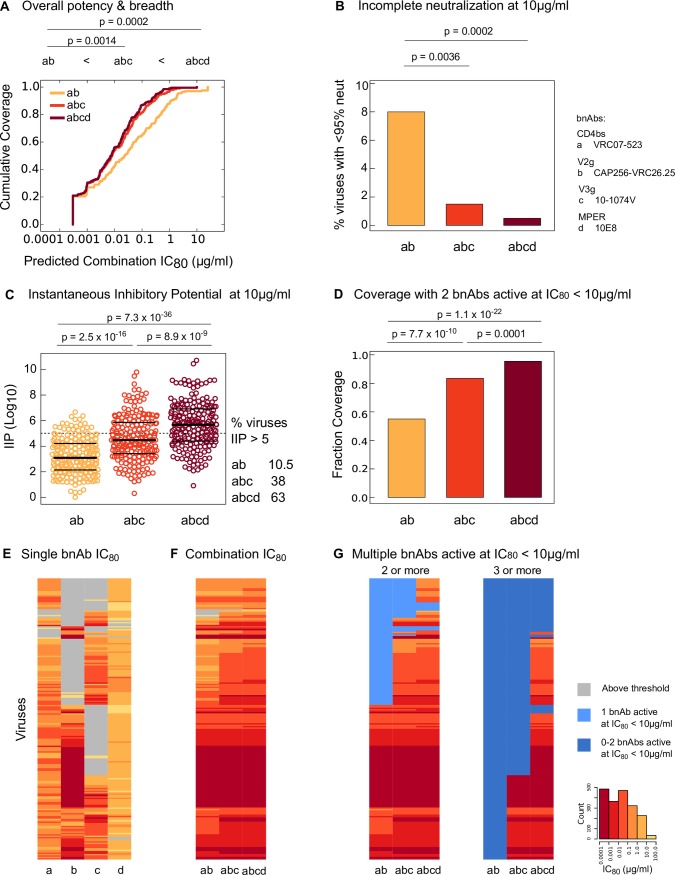
The identification of a new generation of potent broadly neutralizing HIV-1 antibodies (bnAbs) has generated substantial interest in their potential use for the prevention and/or treatment of HIV-1 infection. While combinations of bnAbs targeting distinct epitopes on the viral envelope (Env) will likely be required to overcome the extraordinary diversity of HIV-1, a key outstanding question is which bnAbs, and how many, will be needed to achieve optimal clinical benefit. We assessed the neutralizing activity of 15 bnAbs targeting four distinct epitopes of Env, including the CD4-binding site (CD4bs), the V1/V2-glycan region, the V3-glycan region, and the gp41 membrane proximal external region (MPER), against a panel of 200 acute/early clade C HIV-1 Env pseudoviruses. A mathematical model was developed that predicted neutralization by a subset of experimentally evaluated bnAb combinations with high accuracy. Using this model, we performed a comprehensive and systematic comparison of the predicted neutralizing activity of over 1,600 possible double, triple, and quadruple bnAb combinations. The most promising bnAb combinations were identified based not only on breadth and potency of neutralization, but also other relevant measures, such as the extent of complete neutralization and instantaneous inhibitory potential (IIP). By this set of criteria, triple and quadruple combinations of bnAbs were identified that were significantly more effective than the best double combinations, and further improved the probability of having multiple bnAbs simultaneously active against a given virus, a requirement that may be critical for countering escape in vivo. These results provide a rationale for advancing bnAb combinations with the best in vitro predictors of success into clinical trials for both the prevention and treatment of HIV-1 infection.


Conflict of interest statement

The authors have declared that no competing interests exist.

Figures

Fig 1
Fig 1. Neutralization activity of bnAbs against clade C virus panel.
Potency-breadth curves are presented for both IC50 (A) and IC80 (B) titers. BnAbs are color coded and grouped by target epitopes. Bold lines indicate bnAbs that were best in class for V2-glycan (V2g), V3-glycan (V3g), CD4bs, and MPER epitopes. Dashed vertical lines indicated the lowest and highest concentration tested. Neutralization data are also presented as scatter plots of IC50 (C) and IC80 (D) titers in which each virus is represented by an individual dot. The highest concentration tested for each bnAb and the percentage of viruses neutralized are indicated. Solid bars represent median titers. Heat maps of IC50 (E) and IC80 (F) were generated using the Heatmap tool on the Los Alamos HIV Database. In the heatmaps, rows represent viruses, and columns represent bnAbs. The darker hues indicate more potent neutralization, and blue (for contrast) indicates the virus had IC50 or IC80 above threshold, unable to reach this level of neutralization at the highest concentration of bnAb tested. The order of viruses is same in panels E and F.
Fig 2
Fig 2. Comparison of Additive and Bliss-Hill models for predicting bnAb combination neutralization scores.
Additive and Bliss-Hill models were used to analyze bnAb combination IC80 scores for the Clade C Panel. In (A), BH model predictions are plotted against observed IC80 values for 20 viruses, with different bnAb combinations (n = 10) shown by different colors and/or symbols. (B) For each bnAb combination tested, the absolute difference between the predicted and the observed Log10 IC80 values for each virus was calculated using both BH and additive models (Fig D in S1 Text). Median Log10 differences using BH model are shown as blue bars and using additive model are shown as green bars, with vertical grey bars representing half the interquartile range. Wilcoxon paired rank test was used to determine whether the Bliss Hill model provides a statistically significantly smaller prediction error for this panel of viruses. Fig D in S1 Text illustrates each of the paired model predictions for the Envs and antibody combinations tested. The additive model often slightly underestimates the observed combination potency, while BH model estimates are closer to the observed. Combinations of bnAbs for which the p-value was smaller than the threshold established by a false discovery rate of q<0.1 are indicated. See Figs C and E in S1 Text for equivalent analysis using the Kong et al. dataset [60].
Fig 3
Fig 3. BH predicted IC80 potency-breadth curves scores for all candidate 2, 3 and 4 bnAb combinations against the clade C virus panel.
Potency-breadth curves for all candidate 2 (A), 3 (B) and 4 (C) bnAb combinations are shown for a total of 1,622 bnAb combinations (81 double-, 431 triple-, 1,110 quadruple-bnAb combinations), using BH model predicted IC80 scores. Each combination’s potency-breadth curve is color coded according to the number of bnAbs of different specificities in the combination, e.g. all 4-bnAb combinations that had two V2g bnAbs, and 1 each of other specificities, were assigned to the same category and were color coded blue in (C). The best-in-category bnAb combinations are highlighted in darker colors in A-C, and the others are shown by matched lighter colors. In (B) and (C), “0/1” indicates combinations in which the indicated epitope may or may not have been covered by a representative bnAb. Combinations with a given total number of bnAbs that have 2 bnAbs targeting a single epitope and up to one bnAb targeting other epitopes were grouped together into categories. Such categories are represented as e.g. “2 CD4bs + 0/1 V2g + 0/1V3g + 0/1 MPER” in the figure, which in the case of 4 bnAb combinations, are composed of combination types “2 CD4bs + V2g + V3g”, “2CD4bs + V2g + MPER” and “2CD4bs + V3g + MPER.
Fig 4
Fig 4. Comparison of best-in-category bnAb combinations for potency and breadth of neutralization.
Comparisons of best combinations from each category within the 2- (A-C), 3- (D-F) and 4- (G-I) bnAb combinations are presented. Shown below each combination are its geometric mean and median IC80 titer and the percent viral coverage at IC80 < 10 μg/ml (A, D, G). Combinations are ordered using geometric mean IC80 titers, and a combination is indicated as better than (‘>‘) the proceeding combination when the difference in geometric mean IC80 exceeded 0.001 μg/ml, otherwise it is indicated as similar (‘~’). The distributions of IC80 scores for the best combinations were compared using a Wilcoxon Rank Sum Test, and only those p-values with q-value < 0.1 are shown. Potency-breadth curves (B, E, H) and distributions of IC80 values (C, F, I) for the top 2 combinations are shown. Grey lines in C, F, I connect the predicted IC80 values for the same virus.
Fig 5
Fig 5. Extent of neutralization by multiple active bnAbs from best-in-category combinations.
Modified IC80 potency-breadth curves are shown for best-in-category 2, 3, and 4 bnAb combinations. These modified curves measure the fraction of all 200 viruses that are neutralized at predicted combination IC80 values, but limited by counting only those viruses that were simultaneously neutralized by at least 1, 2 or 3 bnAbs in the combination. Potency-breadth curves are shown for the best 2 bnAb combinations in which at least 1 or 2 bnAbs were required to be simultaneously active at IC80 thresholds of <1 μg/ml, 5 μg/ml or 10 μg/ml (A). Similar potency-breadth curves are shown for the best 3 bnAb (B) or 4 bnAb (C) combinations in which at least 2 or 3 bnAbs were required to be simultaneously active at these IC80 thresholds. The modified potency-breadth curves in this figure do not reach the indicated IC80 thresholds when 2 or more bnAbs are required to be active because the curves are driven by the IC80 value of the more potent active bnAb in the combination, which is often much lower than the activity threshold IC80.
Fig 6
Fig 6. MPI exhibited by single bnAbs and bnAb combinations.
The observed MPI for single bnAbs (A) and predicted MPI values for 2, 3 and 4 bnAb combinations (B-D) are shown. Vertical lines indicate each of the 200 panel viruses and are ordered by MPI values for CAP256-VRC26.25 in all panels. For each virus, the MPI for a bnAb or a bnAb combination is represented by a symbol as shown to the right. The percentage of viruses with MPI <95% for each bnAb and bnAb combination is also indicated.
Fig 7
Fig 7. IIP for bnAbs and bnAb combinations.
IIP values (log10 reduction) are shown for the best-in-class single bnAbs and their combinations at 1 μg/ml (A), 10 μg/ml (B) and 100 μg/ml (C). In each panel, numbers in the top row show median IIP values and in the bottom row show the percentage of viruses with IIP > 5. The dotted horizontal lines are at IIP = 5.
Fig 8
Fig 8. Comparison of best 2, 3 and 4 bnAb combinations.
(A) Potency-breadth curves for the best combinations are shown. IC80 scores for combinations were compared using Wilcoxon rank sum test. (B) Fraction of viruses (total n = 200) predicted to have < 95% neutralization at 10 μg/ml for the best combinations. Fisher’s exact test was used to calculate the statistical significance. (C) IIP calculated at 10 μg/ml for the best combinations against each of the 200 panel viruses. Statistical significance of the difference in IIP values was found using Wilcoxon rank sum test. (D) Fraction of viruses neutralized by at least 2 bnAbs in the best combinations at single bnAb IC80 thresholds of < 10 μg/ml. Fisher’s exact test was used to calculate statistical significance. (E, F, G) show heatmaps of IC80 values for the best single bnAbs and the best bnAb combinations respectively. Rows represent viruses, and columns represent single and combination bnAbs. Same ordering of viruses is used in E-G. Darker hues of red indicate more potent neutralization and grey cells indicate IC80 above threshold. In (G), blue shades indicate viruses that were neutralized by less than 2 bnAbs (left panel) or by less than 3 bnAbs (right panel) at single bnAb at IC80 < 10 μg/ml.

References

    1. Mascola JR, Montefiori DC. The role of antibodies in HIV vaccines. Annu Rev Immunol. 2010;28:413–44. 10.1146/annurev-immunol-030409-101256 . - DOI - PubMed
    1. Kwong PD, Mascola JR. Human antibodies that neutralize HIV-1: identification, structures, and B cell ontogenies. Immunity. 2012;37(3):412–25. 10.1016/j.immuni.2012.08.012 . - DOI - PMC - PubMed
    1. Klein F, Mouquet H, Dosenovic P, Scheid JF, Scharf L, Nussenzweig MC. Antibodies in HIV-1 vaccine development and therapy. Science. 2013;341(6151):1199–204. 10.1126/science.1241144 - DOI - PMC - PubMed
    1. Kwong PD, Mascola JR, Nabel GJ. Broadly neutralizing antibodies and the search for an HIV-1 vaccine: the end of the beginning. Nat Rev Immunol. 2013;13(9):693–701. 10.1038/nri3516 . - DOI - PubMed
    1. Corti D, Langedijk JP, Hinz A, Seaman MS, Vanzetta F, Fernandez-Rodriguez BM, et al. Analysis of memory B cell responses and isolation of novel monoclonal antibodies with neutralizing breadth from HIV-1-infected individuals. PLoS One. 2010;5(1):e8805 10.1371/journal.pone.0008805 - DOI - PMC - PubMed

Publication types

MeSH terms