. 2016 Mar 31:6:23795.
doi: 10.1038/srep23795.

Lipid-laden cells differentially distributed in the aging brain are functionally active and correspond to distinct phenotypes

Affiliations

Lipid-laden cells differentially distributed in the aging brain are functionally active and correspond to distinct phenotypes

Marilia Kimie Shimabukuro et al. Sci Rep. .

Abstract

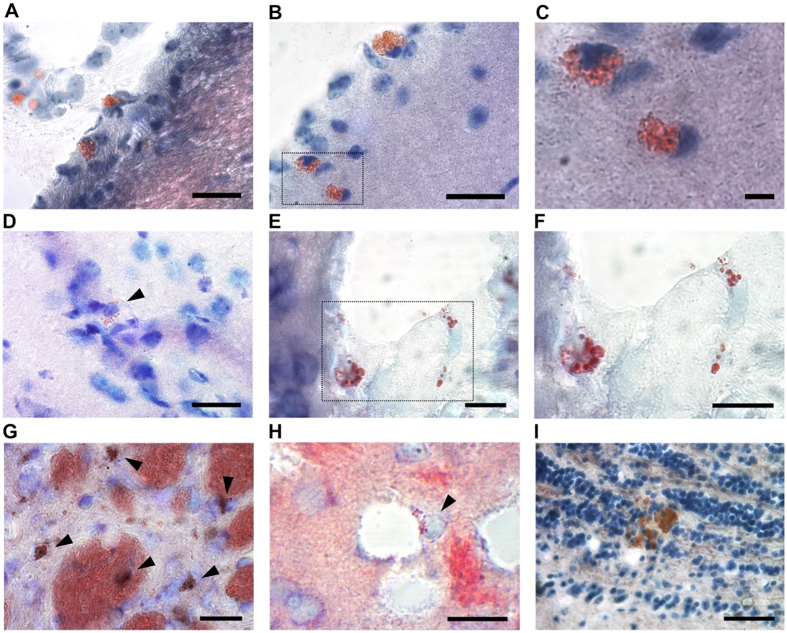
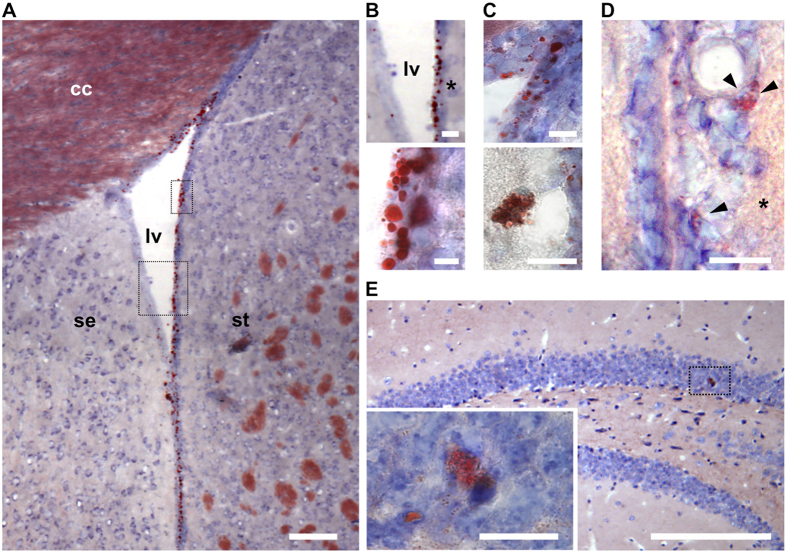
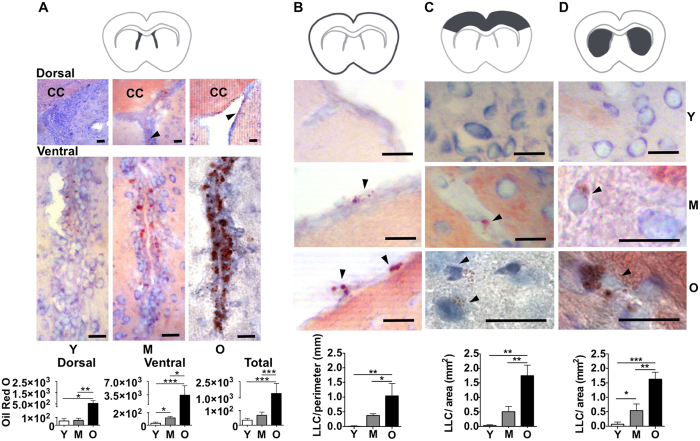
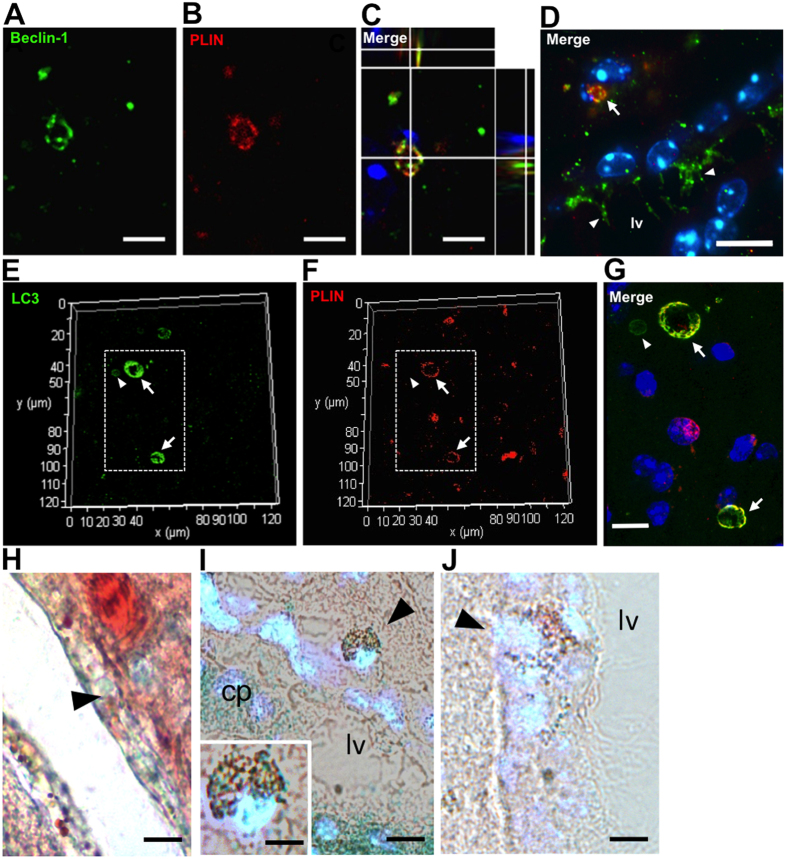
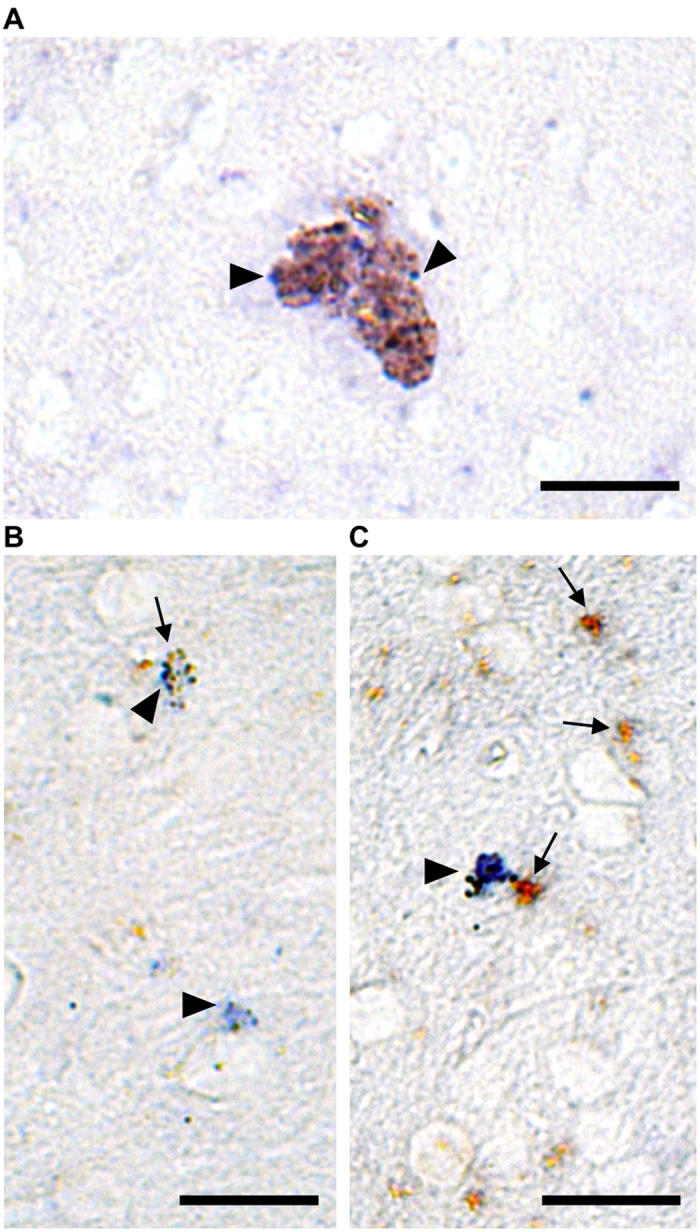
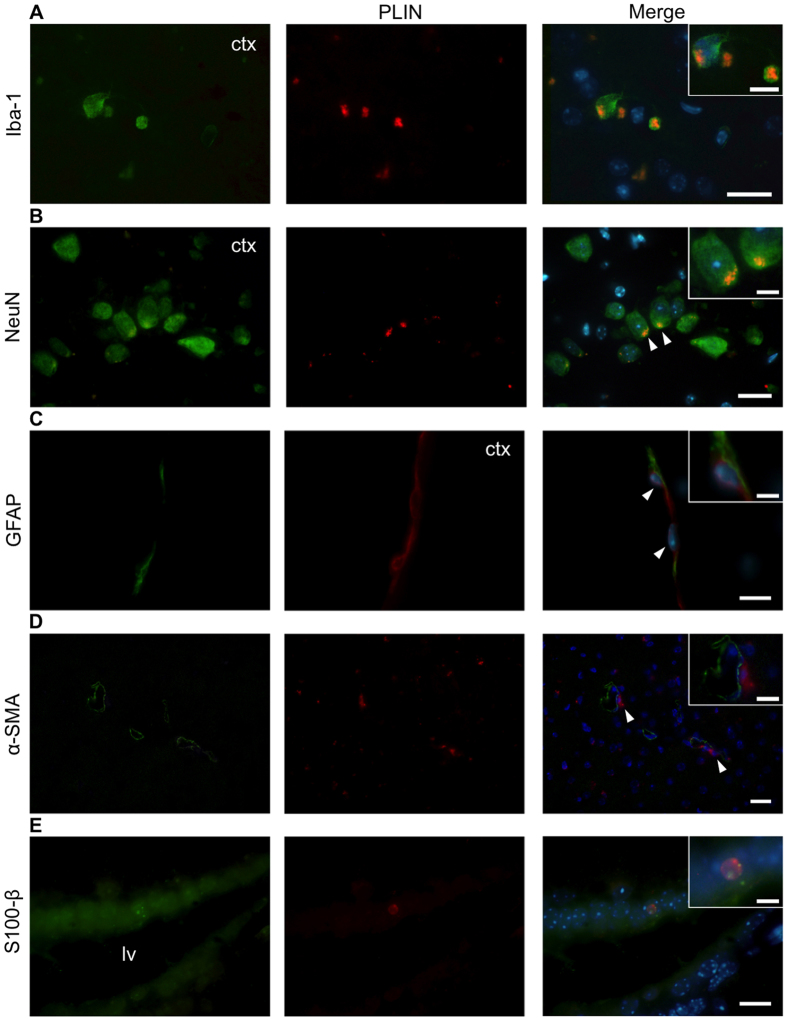
We characterized cerebral Oil Red O-positive lipid-laden cells (LLC) of aging mice evaluating their distribution, morphology, density, functional activities and inflammatory phenotype. We identified LLC in meningeal, cortical and neurogenic brain regions. The density of cerebral LLC increased with age. LLC presenting small lipid droplets were visualized adjacent to blood vessels or deeper in the brain cortical and striatal parenchyma of aging mice. LLC with larger droplets were asymmetrically distributed in the cerebral ventricle walls, mainly located in the lateral wall. We also found that LLC in the subventricular region co-expressed beclin-1 or LC3, markers for autophagosome or autophagolysosome formation, and perilipin (PLIN), a lipid droplet-associated protein, suggesting lipophagic activity. Some cerebral LLC exhibited β galactosidase activity indicating a senescence phenotype. Moreover, we detected production of the pro-inflammatory cytokine TNF-α in cortical PLIN(+) LLC. Some cortical NeuN(+) neurons, GFAP(+) glia limitans astrocytes, Iba-1(+) microglia and S100β(+) ependymal cells expressed PLIN in the aging brain. Our findings suggest that cerebral LLC exhibit distinct cellular phenotypes and may participate in the age-associated neuroinflammatory processes.


Figures

Figure 1
Figure 1. LLC are present in distinct brain regions of old mice.
(A,B) Bright field micrographs show Oil Red O+ LLC in the pia mater (A) and in the pia mater and adjacent cortex (B). (C) Higher magnification of cortical LLC in area delineated in B. (D) Brain cortical LLC containing well-defined lipid droplets. (E) LLC associated with blood vessels in the cortex. (F) Higher magnification of delineated area in E. (G) Oil Red O+ LLC and fiber bundles in the striatum. (H) perivascular striatal LLC. (I) LLC in the olfactory bulb granular cell layer. Coronal brain tissue sections of aged mice were stained with Oil-red O and toluidine blue dyes. Arrowheads indicate Oil red O+ cells. Scale bars: 50 μm (A,B,D,E,G,H,I); 10 μm (C,F).
Figure 2
Figure 2. LLC are present in the lateral ventricle wall and hippocampal dentate gyrus neurogenic regions of old mice brains.
(A) Representative bright field photomicrographs showing Oil-red O+ LLC along the lateral ventricular walls in the brain of an old mouse. (B) Higher magnification of delineated areas in A show differential distribution of Oil-Red O+ LLC between the medial and lateral walls (upper panel) and lipid droplets with variable sizes in cells of the lateral wall of the lateral ventricle (lower panel). (C) Oil-Red O+ LLC in the dorsal corner of the lateral ventricle (upper panel) or in association with blood vessels in the medial wall of the lateral ventricle (lower panel). (D) LLC in the lateral wall of the lateral ventricle subventricular area. (E) LLC in the hippocampal dentate gyrus. Inset shows higher magnification of delineated area with Oil Red O+ LLC. Coronal sections of the brain were stained with Oil-Red O and counterstained with toluidine blue. Asterisks indicate lateral ventricle lateral wall. Cc: corpus callosum; lv: lateral ventricle; se: septum; st: striatum. Scale bars: 100 μm (A,E); 20 μm (B,C upper panel; (D,E); 10 μm (C lower panel).
Figure 3
Figure 3. Quantification of Oil Red O+ LLC in the pia mater and distinct regions of the brain during aging.
(AD)(upper). Dark grey areas in the schema indicate brain regions analyzed in young (~3 month-old), middle age (~12 month-old) or old (>18 month-old) mice. (AD) (middle). Representative photomicrographs of the dorsal and ventral subregions of the lateral ventricles; pia-mater; brain cortex; and striatum of young, middle-aged and old mice, as indicated in the figure. Black arrowheads point Oil Red O+ lipid droplets. Excepting 50 μm scale bar in the image of the lateral ventricle wall dorsal subregion of old mice, scale bars in all other images correspond to 20 μm. (AD) (lower). Graphs show (A) Oil Red O intensity in lipid droplets per mm in dorsal or ventral subregions or in the total area of lateral ventricles;and the number of Oil Red O+ LLC per mm in (B) pia mater or per mm2 in (C) cortex and (D) striatum. Y, young; M, middle-aged; O, old mice. Data are presented as mean ± SEM (n = 3 mice per group). *p < 0.05, **p < 0.01, ***p < 0.001.
Figure 4
Figure 4. Expression of Beclin-1, LC3 or staining for SA-βgal in LLC of the brain lateral ventricle walls of middle-aged and old mice.
(A–D) Representative fluorescence photomicrographs showing co-localization of Beclin-1 with PLIN in LLC in the ventricular medial wall area of middle-aged mice. (D) Beclin-1+ cilia in ependymal cells are indicated by white arrowheads. Cell nuclei were counterstained with Hoechst. Beclin1+PLIN+ LLC is indicated (white arrow) (E–G) Representative fluorescence photomicrographs showing co-localization of LC3 with PLIN in LLC in the ventricular lateral wall area of old mice (white arrows). Dotted lines in (E,F) correspond to merged area shown in higher magnification (G). LC3+ autophagosome in a cell without lipid accumulation is indicated by white arrowheads. (H,I) Bright field photomicrograph of Oil Red-O+ SA-βgal+ LLC (black arrowheads) in the ventricular lateral wall merged with fluorescent Hoechst counterstaining in old and middle-aged mice, respectively. (J) Photomicrograph of Oil Red-O+ SA-βgal LLC (black arrowhead) in the ventricular lateral wall merged with fluorescent Hoechst counterstaining. cp: choroid plexus; lv: lateral ventricle. Scale bars: 2.5 μm (A–C); 10 μm (D–J).
Figure 5
Figure 5. LLC produce TNF-α mRNA in the old mouse brain.
(A–C) Bright field photomicrograph shows brownish PLIN+ LLC expressing TNF-α mRNA (blue) in the cerebral cortex. In situ hybridization for TNF-α mRNA, positively detected using alkaline phosphatase (arrowheads indicate blue staining), was done in combination with immunoperoxidase for PLIN (arrows indicate brown staining) in old brain tissue. Scale bars: 20 μm.
Figure 6
Figure 6. Cellular phenotypes of LLC in the middle-aged mouse brain.
(A) PLIN+ Iba-1+ microglial cells. (B) PLIN+ NeuN+ neurons. (C) PLIN+ GFAP+ glia limitans astrocytes. (D) PLIN+ cells adjacent to α-SMA+ pericytes (white arrowheads) in the brain cortical region. (E) PLIN+ S100β+ ependymal cells in the medial lateral ventricle wall (white arrowheads). Brain tissue samples were analyzed by immunohistochemistry using the lipid droplet specific marker Perilipin (PLIN, in red) in combination with cellular phenotype markers indicated in the figure (in green). Insets show higher magnification of distinct PLIN+ cells. Nuclei were stained with Hoechst (in blue). Bars: 20 μm. Inset bars: 10 μm.

Similar articles

Cited by

References

    1. Franceschi C. et al.. Inflamm-aging. An evolutionary perspective on immunosenescence. Ann. N. Y. Acad. Sci. 908, 244–54 (2000). - PubMed
    1. Cartwright M. J., Tchkonia T. & Kirkland J. L. Aging in adipocytes: potential impact of inherent, depot-specific mechanisms. Exp. Gerontol. 42, 463–471 (2007). - PMC - PubMed
    1. Kirkland J. L., Tchkonia T., Pirtskhalava T., Han J. & Karagiannides I. Adipogenesis and aging: does aging make fat go MAD? Exp. Gerontol. 37, 757–767 (2002). - PubMed
    1. Greenberg A. S. et al.. The role of lipid droplets in metabolic disease in rodents and humans. J. Clin. Invest. 121, 2102–2110 (2011). - PMC - PubMed
    1. Singh R. et al.. Autophagy regulates lipid metabolism. Nature. 458, 1131–1135 (2009). - PMC - PubMed

Publication types

MeSH terms