Review
. 2016;16(2):98-129.
doi: 10.2174/1566523216666160331130040.

Gene Electrotransfer: A Mechanistic Perspective

Affiliations
Review

Gene Electrotransfer: A Mechanistic Perspective

Christelle Rosazza et al. Curr Gene Ther. 2016.

Abstract

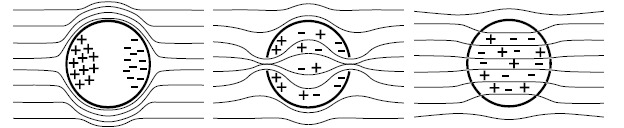
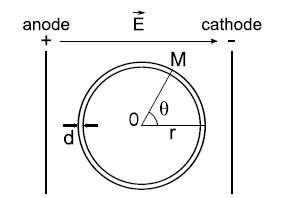
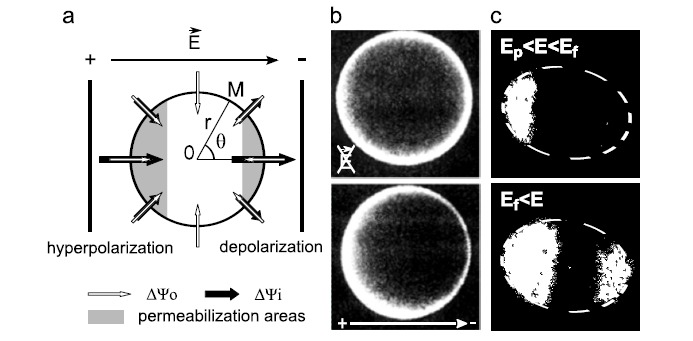
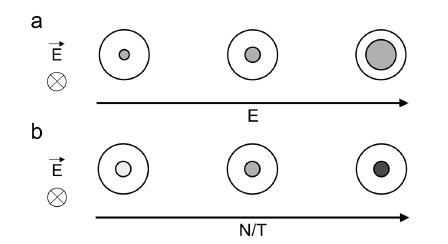
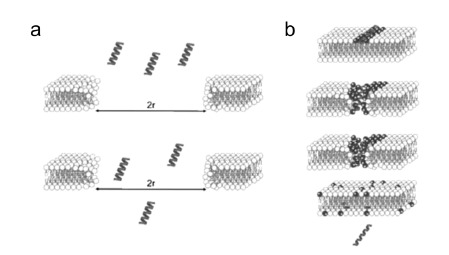
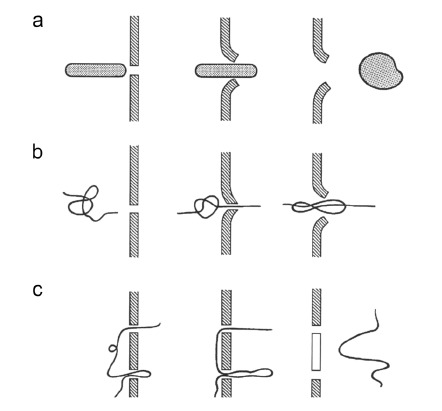
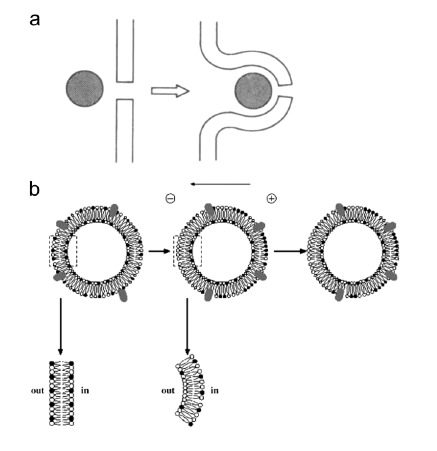
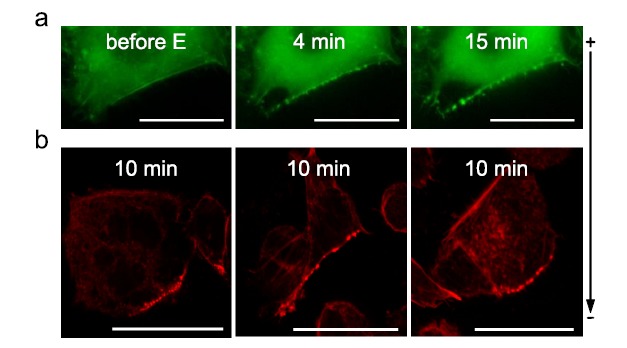
Gene electrotransfer is a powerful method of DNA delivery offering several medical applications, among the most promising of which are DNA vaccination and gene therapy for cancer treatment. Electroporation entails the application of electric fields to cells which then experience a local and transient change of membrane permeability. Although gene electrotransfer has been extensively studied in in vitro and in vivo environments, the mechanisms by which DNA enters and navigates through cells are not fully understood. Here we present a comprehensive review of the body of knowledge concerning gene electrotransfer that has been accumulated over the last three decades. For that purpose, after briefly reviewing the medical applications that gene electrotransfer can provide, we outline membrane electropermeabilization, a key process for the delivery of DNA and smaller molecules. Since gene electrotransfer is a multipart process, we proceed our review in describing step by step our current understanding, with particular emphasis on DNA internalization and intracellular trafficking. Finally, we turn our attention to in vivo testing and methodology for gene electrotransfer.


Figures

Fig. (1)
Fig. (1)
Schematic representation of the electric field lines around or through a spherical cell. The cell membrane conductivity is extremely low. The current flows and the field lines around the spherical cell are distorted. At a certain field value, the membrane allows for the field lines to cross towards the cell interior. Increasing the electric field increases the number of field lines crossing the cell and the cell membrane becomes conductive. Inspired from [86].
Fig. (2)
Fig. (2)
Schematic representation of a cell in a uniform electric field. The cell in suspension is represented as a spherical shell. The thickness d of the membrane is very small compared to the cell radius r. The uniform electric field is obtained by the application of an electric pulse at the extremity of two parallel conductive plates (of infinite length). Inspired from [87].
Fig. (3)
Fig. (3)
Asymmetry of the cell membrane potential and cell permeabilization due to electric fields. (a) Schematic representation of the resting and induced potential difference (resp. ΔΨ0, and ΔΨi) across the cell membrane. Inspired from [91] (b) Membrane potential difference of sea urchin eggs labeled with RH292 and observed using fluorescence microscopy before and during the application of an electric pulse [115] (c) Electropermeabilized areas of NIH3T3 cells labeled with ethidium bromide and observed using fluorescence microscopy after the application of electric fields of different strength [94]. E stands for electric field, Ep for electropermeabilization threshold and Ef for electrofusion threshold. The white dash lines in (c) represent the cell surface.
Fig. (4)
Fig. (4)
Influence of the parameters of the electric field on the surface permeabilization (electric field strength E, pulse duration T and number N). (a) At fixed N and T, the permeabilized area of the cell surface (gray) increases with increasing E. (b) At fixed E, the density of the transient permeable structures (light to dark gray) increases when increasing N and/or T. The electric field direction is perpendicular to the represented cell section. Inspired from [127].
Fig. (5)
Fig. (5)
Life cycle of an electropore. Only water (red) and phospholipid head groups (yellow) are shown. The creation of an electropore starts with the introduction of a water defect inside the lipid bilayer (pore initiation). This engenders a reorganization of the lipids around the defect (pore construction). As long as the electric field is present, this phenomenon expands until the formation of a mature pore (pore maturation). Once the electric field is turned off, pore annihilation begins. At this moment, the pore is quasi-stable (pore destabilization). The size of the pore decreases since water and phospholipid head groups move out of the bilayer interior (pore degradation). The head groups separate again into two distinct layers (pore deconstruction) and water is rapidly removed (pore dissolution) such that the initial structure of the membrane is restored. From [154].
Fig. (6)
Fig. (6)
Schematic graph of cell membrane electropermeabilization and cell viability. Both strongly depend on the electric field strength (E), the number of pulses (N), and the pulse duration (T). The higher values these parameters have, the more cells are permeabilized but the less cells survive. Inspired from [127, 172].
Fig. (7)
Fig. (7)
Asymmetry of the DNA interaction with the membrane on adherent cells. (a) Formation of DNA-membrane complexes only on one side of the cell surface (facing the cathode) under unipolar conditions. (b) Formation of DNA-membrane complexes on both sides of the cell surface in bipolar conditions. From [199].
Fig. (8)
Fig. (8)
Influence of the parameters (E, T, N) of the electric field on the DNA accumulation at the cell surface. (a) At fixed N and T, the area of DNA accumulation or the number of DNA aggregates at the cell surface increases with increasing E. Each experiment was performed separately on different cells. (b) At fixed E, the amount of DNA accumulating in the aggregates increase when increasing N and/or T. The same cell is observed through the experiment. From [196, 200].
Fig. (9)
Fig. (9)
Models of DNA internalization in cells through electropores. (a) Electric pulses induce macropores large enough to let DNA diffusing through them (r represents the radius of the electropore). (b) DNA interacts with cationic lipids (darker grey) at the pore edges and via coalescence of the pores DNA passes through the membrane. From [213].
Fig. (10)
Fig. (10)
Models of DNA internalization in cells via electrophoresis. (a) Non-linear DNA is aligned with the electric field line and is electrophoretically pushed through one pore that becomes wider upon its passage. (b) Linear DNA has one end inserted in the pore and the electrophoretic force drives the DNA through it. (c) Linear DNA has two (or more) insertions in the membrane where the pores are and its electrophoresis cut the membrane between these pores (white part of the membrane). From [183].
Fig. (11)
Fig. (11)
Models of DNA internalization in cells via endocytosis-like mechanism. (a) DNA electrophoresis brings the DNA molecule(s) at the membrane defect (pore) and provides the force to generate membrane invagination that buds off in vesicle containing DNA. From (148) (b) Low electric field conditions induce local segregation of charged membrane components (lipids, black and white circles, and proteins, grey ovals) in the outer leaflet of the cell membrane. This electrophoretic-induced segregation of charged membrane components induces an asymmetrical charge density across the membrane, which promotes spontaneous inward membrane curvature and fission. From (205).
Fig. (12)
Fig. (12)
Actin patches formation after gene electrotransfer. DNA was electrotransferred into CHO cells via the application of 10 electric pulses of 5 ms at 1 Hz and 0.4 kV/cm. (a) Time lapse of EGFP-actin expressing cells electropermeabilized in the presence of DNA. Scale bar: 10 µm (b) Phalloidin-rhodamine labeled cells fixed 10 min after electropermeabilization in the presence of DNA. Scale bar: 20 µm. From [231].
Fig. (13)
Fig. (13)
Colocalization of DNA with several endocytic markers. Transferrin (TF) highlights the involvement of clathrin-mediated endocytosis, cholera toxin B (CTB) the participation of caveolin/raft-mediated endocytosis, and 70 kDa dextran the contribution of fluid-phase endocytosis. DNA was electrotransferred into CHO cells via the application of 10 electric pulses of 5 ms at 1 Hz and 0.4 kV/cm. Images were taken sequentially using wide-field microscopy. Scale bar: 5 µm. From [251].
Fig. (14)
Fig. (14)
Single particle tracking of DNA aggregates in CHO cells after electrotransfer. (a, b) DNA aggregate trajectories in the cytoplasm after gene electrotransfer. (a) overlay between the transmission light image and the fluorescence depicted in (b). The color of the trajectories codes time with blue corresponding to 0 s and white to 35 s. (c-g) Some trajectories of the time series (b), scale bar: 1 µm. Trajectories show long (c, d) or short (e, f) distance excursions or almost immobile aggregates (g). White arrows point at the part of the trajectories exhibiting bidirectional motion. From [230].
Fig. (15)
Fig. (15)
Dual-color SPT of DNA aggregates and endosomal proteins in CHO cells after electroporation. CHO cells separately expressing EGFP-Rab5, Rab11, Rab9 and Lamp1 plasmid constructs were electroporated in the presence of Cy5-labeled DNA. Using quantitative colocalization analysis, the respective movements of the objects are investigated. Correlated trajectories are highlighted in orange (DNA) and light purple (EGFP-markers), colocalized trajectories are drawn in blue (DNA) and pink (EGFP-markers) and the non-correlated and non-colocalized trajectories are in red (DNA) and green (EGFP-markers). (a) DNA in early endosomes (Rab5), (b) DNA in recycling endosomes (Rab11), (c) DNA in late endosomes (Rab9), and (d) DNA in lysosomes (Lamp1). Scale bar: 5 µm. From [251].
Fig. (16)
Fig. (16)
Schematic representation of the mechanism of DNA electrotransfer. During the application of the electric field, (1) the plasma membrane is permeabilized (orange), (2) DNA is electrophoretically pushed onto the cell membrane side facing the cathode, which results in (3) DNA-membrane interactions. DNA aggregates are inserted into the membrane (sites where membrane defects are present or not) and remain there for about ten minutes. After the application of the electric field and resealing of the membrane (yellow), (4) DNA is mainly internalized by endocytosis (macropinocytosis, clathrin-mediated endocytosis (Clathrin-ME), and caveolin/raft-mediated endocytosis (Caveolin/raft-ME). If DNA is internalized by other means than endocytosis, actin participation may take shape of bursts of polymerization. 
(5) While being actively transported in the cytoplasm (actin and tubulin networks, respectively in red and green), DNA aggregates pass through the different endosomal compartments (early endosomes, recycling endosomes, late endosomes, and lysosomes). Free DNA must interact with some adapter protein in order to be transported by motor proteins. For gene expression to occur, (6) DNA must escape from endosomal compartments. Once in the perinuclear region, (7) DNA must cross the nuclear envelope to be finally expressed and (8) yield proteins released into the cytoplasm. Inspired from [230, 251].
Fig. (17)
Fig. (17)
Effect of the diameter of needle electrodes on the electric field intensity and distribution, using the same pulse amplitude and distance between electrodes. (a) Needle diameter 0.3 mm, pulse amplitude 960 V. (b) Needle diameter 0.7 mm, pulse amplitude 960 V. (c) Needle diameter 1.1 mm, pulse amplitude 952 V. From [344].
Fig. (18)
Fig. (18)
Electrodes for in vivo applications. (a) plate electrodes used for tissue on surface (e.g. skin, muscle), (b) needle electrodes for deep-seated target, (c) multiple needle electrodes used for larger targets. Yellow areas represent the epidermis, red areas the dermis, and the grey round mass represent the targeted tissue. From [336].

References

    1. Rogers S. Gene therapy: a potentially invaluable aid to medicine and mankind. Res. Commun. Chem. Pathol. Pharmacol. 1971;2(4):587–600. - PubMed
    1. Cian M.M., Helen O.M. Cancer Gene Therapy – Key Biological Concepts in the Design of Multifunctional Non-Viral Delivery Systems. INTECH Open Access Publisher; 2013.
    1. Greco O, Scott SD, Marples B, et al. Cancer gene therapy: 'delivery, delivery, delivery'. . Front Biosci . 2002. - PubMed
    1. Xiao P.J., Lentz T.B., Samulski R.J. Recombinant adeno-associated virus: clinical application and development as a gene-therapy vector. Ther. Deliv. 2012;3(7):835–856. - PubMed
    1. Bester A.C., Schwartz M., Schmidt M., et al. Fragile sites are preferential targets for integrations of MLV vectors in gene therapy. Gene Ther. 2006;13(13):1057–1059. - PubMed

Publication types