. 2016 Mar 31:6:23836.
doi: 10.1038/srep23836.

pH Induced Conformational Transitions in the Transforming Growth Factor β-Induced Protein (TGFβIp) Associated Corneal Dystrophy Mutants

Affiliations

pH Induced Conformational Transitions in the Transforming Growth Factor β-Induced Protein (TGFβIp) Associated Corneal Dystrophy Mutants

Elavazhagan Murugan et al. Sci Rep. .

Abstract

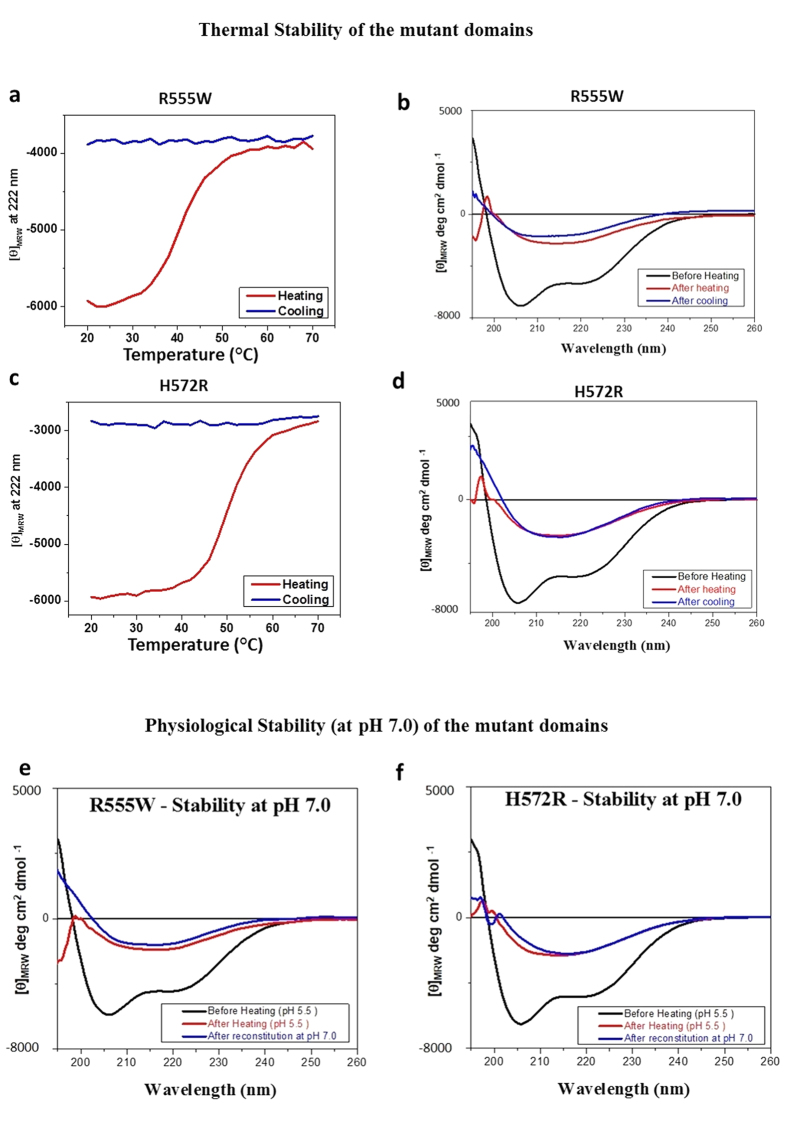
Most stromal corneal dystrophies are associated with aggregation and deposition of the mutated transforming growth factor-β induced protein (TGFβIp). The 4(th)_FAS1 domain of TGFβIp harbors ~80% of the mutations that forms amyloidogenic and non-amyloidogenic aggregates. To understand the mechanism of aggregation and the differences between the amyloidogenic and non-amyloidogenic phenotypes, we expressed the 4(th)_FAS1 domains of TGFβIp carrying the mutations R555W (non-amyloidogenic) and H572R (amyloidogenic) along with the wild-type (WT). R555W was more susceptible to acidic pH compared to H572R and displayed varying chemical stabilities with decreasing pH. Thermal denaturation studies at acidic pH showed that while WT did not undergo any conformational transition, the mutants exhibited a clear pH-dependent irreversible conversion from αβ conformation to β-sheet oligomers. The β-oligomers of both mutants were stable at physiological temperature and pH. Electron microscopy and dynamic light scattering studies showed that β-oligomers of H572R were larger compared to R555W. The β-oligomers of both mutants were cytotoxic to primary human corneal stromal fibroblast (pHCSF) cells. The β-oligomers of both mutants exhibit variations in their morphologies, sizes, thermal and chemical stabilities, aggregation patterns and cytotoxicities.


Figures

Figure 1
Figure 1. Biochemical and biophysical properties of the native 4th_FAS1 domains of the wild-type and mutant TGFβIp.
(a) Schematic representation of the domain arrangement and boundaries of the full-length TGFβIp and 4th_FAS1 domains of the wild-type, non-amyloidogenic (R555W) and amyloidogenic (H572R) mutants used in the study. (b) SDS-PAGE gel showing the purified fractions of the 4th_FAS1 domains of the WT, R555W and H572R mutants. (c–e) Far UV CD spectra of the 4th_FAS1 domains of WT (d), R555W (e) and H572R (f) incubated for 16 hours at acidic pH conditions (pH 3, 4.5, 5.5 and 7). The R555W mutant displayed clear changes in the CD spectra at 222 nm and 207 nm with decrease in pH (f). The CD intensity at 222 nm decreased with decrease in pH confirming the unfolding of the secondary structures. The CD spectra for the WT (c) and H572R (e) mutant remained almost unchanged. Plotting the intensities at 222 nm at varying pH (g) showed that the non-amyloidogenic phenotype, R555W, was more sensitive to pH and the amyloidogenic phenotype, H572R, remained more stable to pH changes at room temperature.
Figure 2
Figure 2. Thermal denaturation of the 4th_FAS1 domains of the WT and mutants at neutral and basic pH.
(a,b) Far UV CD spectra of the 4th_FAS1 domain of WT at pH 7.0 and pH 8.0 before heating (black), after heating to 70 °C (red) and cooling back to 20 °C (blue). (c,d) Far UV CD spectra of the 4th_FAS1 domains of R555W at pH 7 (c) and pH 8 (d) before heating (black) and after heating to 70 °C (red) and cooling back to 20 °C (blue). (e,f) Far UV CD spectra of the 4th_FAS1 domains of H572R a pH 7.0 (e) and pH 8.0 (f) before heating (black) and after heating to 70 °C (red) and cooling back to 20 °C (blue). The WT and the mutants did not display any significant changes in structure at pH 7.0 and pH 8.0.
Figure 3
Figure 3. Thermal denaturation of the 4th_FAS1 domains of the WT and mutants at acidic pH.
(ac) Far UV CD spectra of the 4th_FAS1 domain of WT at pH 3.0 (a), pH 4.5 (b) and pH 5.5 (c) before heating (black) and after heating to 70 °C (red) and cooling back to 20 °C (blue). (df) Far UV CD spectra of the 4th_FAS1 domain of R555W at pH 3 (d), pH 4.5 (e) and pH 5.5 (f) before heating (black) and after heating to 70 °C (red) and cooling back to 20 °C (blue). (gi) Far UV CD spectra of the 4th_FAS1 domain of H572R at pH 3.0 (g), pH 4.5 (h) and pH 5.5 (i) before heating (black) and after heating to 70 °C (red) and cooling back to 20 °C (blue). While the WT did not show any changes in structure, both the mutants displayed a very clear transition to β-sheet under acidic conditions.
Figure 4
Figure 4. Difference in thermal denaturation induced transition between non-amyloidogenic and amyloidogenic mutants at acidic pH.
(ae) Variable temperature CD curves at 222 nm of WT (black), R555W (red) and H572R (blue) proteins heated from 20 °C to 70 °C at various pH (3.0 [a], 4.5 [b], 5.5 [c], 7.0 [d] and 8.0 [e]) and the CD intensities at 222 nm were plotted as a function of temperature. The baseline subtracted curves of the WT (black), R555W (red) and H572R (blue) proteins show that while there was no transition observed in the WT in all the conditions as observed from the unchanged straight line in black, little or no changes were seen in pH 7 and pH 8 for the mutants. However, clear transitions to β-sheet were observed at acidic pH (pH 3, pH 4.5 and pH 5.5) for both the mutants. In all cases, we observe transition (Tt) is higher for R555W compared to H572R. A clear shift in their thermal denaturation curves between the mutants at acidic pH (pH 3.0, 4.5 and 5.5) is observed. A difference in Tt of 5–12 °C is observed at various pH conditions.
Figure 5
Figure 5. pH sensitivity and stability of the non-amyloidogenic (R555W) phenotype.
(a) Fluorescence emission spectra of R555W with decrease in pH. There was a clear decrease in emission maximum at 332 nm with decrease in pH (indicated by the black arrow). (be) Fluorescence emission spectra of R555W showing the reversibility to folded state after removal of urea. The R555W mutant was incubated with increasing concentrations of urea from 0.25 M to 8 M at various acidic conditions (pH 3, pH 4.5, pH 5.5) and pH 7 and the emission fluorescence before and after urea incubation was measured. The emission spectra before urea incubation 332 nm (black), after incubating with 8 M urea (red) and after removing urea by buffer exchange (blue). Unfolding of the protein is seen by the shifting of peaks (black arrow) from 332 nm to ~ 352 nm. The refolding of the protein after removal of urea is seen by the return of the emission maximum to ~332 nm (green arrow). (fi) Investigation of the stability the non-amyloidogenic phenotype using urea denaturation studies. The R555W mutant was incubated with increasing concentrations of Urea from 0.25 M to 8 M at various acidic pH (pH 3, pH 4.5, pH 5.5) and pH 7, and the emission fluorescence was measured. The denaturation plots of ‘fraction unfolded vs urea concentration’ were plotted and fit into a two state model, with the parameters calculated as described in the methods section.
Figure 6
Figure 6. Characterization amyloidogenic and non-amyloidogenic β-oligomers.
(ab) Transmission Electron Microscopy. TEM images of the β-oligomers of the 4th_FAS1 domains of R555W (a) and H572R (b) mutants were acquired with a JEOL JEM-1010 transmission electron microscope using Digital Micrograph™ 1.81.78 for GMS 1.8.0. The β-oligomers of the amyloidogenic phenotype were larger measuring between 10–40 nm, mean size ~19.1 nm ± 4.9 nm (a) compared to the non-amyloidogenic β-oligomers that measured 4–8 nm, with a mean size ~5.1 nm ± 1.79 nm (b). Inset figures – particle size distribution of the β-oligomers. While the amyloidogenic β-oligomers were larger and displayed rugged edges and varying diameters, the non-amyloidogenic β-oligomers were smaller in size with smoother edges and were more homogenous. (c) ThT assay. Emission fluorescence intensities at 485 nm recorded after incubating the WT TGFβIp and the β-oligomers of R555W and H572R with ThT dye. An amyloid forming peptide (611-633aa - pN622K) of TGFβIp was used as the positive control. The β-oligomers of the amyloidogenic mutant H572R showed significant fluorescence intensity (**P < 0.01) almost 3 times more fluorescence compared to the non-amyloidogenic R555W. (d) DLS. %intensity plots plotted against the apparent hydrodynamic radii (RH). The RH values calculated from the distribution curves for R555W (~39.58 nm|pH 3.0, ~51.9 nm|pH 4.5 and ~68.2 nm|pH 5.5) and H572R (~89.95 nm|pH 3.0, ~69 nm|pH 4.5 and ~155 nm|pH 5.5) show that H572R b-oligomers are larger in size and slightly more heterogeneous. (e,f) Mass Spectrometric analyses - Identification of the aggregation hotspots in the mutants and β-oligomers. (d) Peptide map generated following the insilico trypsin digestion of TGFβIp displaying a series of peptides. (e) The β-oligomers formed from the mutant 4th_FAS1 domains were digested with trypsin and the resulting fragments were analyzed by LC–MS/MS. The regions inaccessible for trypsin digestion have been underlined in red. It is clearly seen that the non-amyloidogenic R555W shows more regions inaccessible for trypsin digestion.
Figure 7
Figure 7. Stability of the β-oligomers at physiological conditions.
(ad) Thermal stability. Variable temperature CD values at 222 nm of the 4th_FAS1 domains of R555W (a) and H572R (c) in buffer at pH 5.5 when heated from 20 °C to 70 °C. Far UV CD spectra of the 4th_FAS1 domains of R555W (b) and H572R (d) after heating (red) to 70 °C and cooling (blue) back to 20 °C. (e,f) Stability at physiological pH. Far UV CD spectra of the 4th_FAS1 domains (black) of R555W (e) and H572R (f) at pH 5.5 under native conditions (black), after heating to 70 °C (red) and after reconstituting in buffer at pH 7.0 (blue) after incubation at room temperature for 4 weeks.
Figure 8
Figure 8. Cytotoxicity.
(a) The growth and proliferation of the pHCSF cells following the treatment with the β-oligomers and the mutant 4th_FAS1 domains monitored for 48 hours in an xCELLigence system. (b) The cell survival after treatment for 24 hours plotted as area under the curve (AUC). While the WT and R555W show low cytotoxicity, almost similar to the media control, the amyloidogenic H572R mutant was cytotoxic compared to the control (**P < 0.01). Interestingly, the β-oligomers of both the amyloidogenic and non-amyloidogenic mutants showed high cytotoxicity (**P < 0.01) with the approximately 7 times more for the non-amyloidogenic mutant and 12 times more for the amyloidogenic mutant. To obtain detailed information on the cytotoxicity of the soluble and insoluble fractions, β-oligomers of the two mutants were prepared at various acidic pH conditions (pH 3.0, pH 4.5, pH 5.5) and their cytotoxicity were examined on pHCSFs from 3 different donors (n = 3) using xCELLigence (c) and MTT assays (d). (c) xCELLigence assay. The WT shows low cytotoxicity, almost similar to the control. The soluble β-oligomers of both the mutants showed high cytotoxicity (**P < 0.01) compared to the controls. The insoluble β-oligomers were relatively less cytotoxic compared to the soluble β-oligomers. (d) MTT assay. The cytotoxicity of the β-oligomers was also tested using an MTT assay. Similar to xCELLigence, we could see that soluble β-oligomers derived from both the mutants displayed potent cytotoxic effect (**P < 0.01) compared to the controls and insoluble aggregates. Though the insoluble oligomers were relatively less cytotoxic than the soluble oligomers, they displayed cytotoxicity compared to the controls.

Similar articles

Cited by

References

    1. Weiss J. S. et al. The IC3D classification of the corneal dystrophies. Cornea 27 (Suppl. 2) S1–S83 (2008). - PMC - PubMed
    1. Klintworth G. K. Corneal dystrophies. Orphanet J. Rare Dis. 4, 7 (2009). - PMC - PubMed
    1. Surguchev A. & Surguchov A. Conformational diseases: looking into the eyes. Brain Res. Bull 81, 12–24 (2010). - PubMed
    1. Lakshminarayanan R. et al. Biochemical properties and aggregation propensity of transforming growth factor-induced protein (TGFβIp) and the amyloid forming mutants. Ocul Surf. 13(1), 9–25 (2015). - PubMed
    1. Kitahama S. et al. Expression of fibrillins and other microfibril-associated proteins in human bone and osteoblast-like cells. Bone 27, 61–67 (2000). - PubMed

Publication types

MeSH terms