

Model-based reconstruction of an epidemic using multiple datasets: understanding influenza A/H1N1 pandemic dynamics in Israel
- PMID: 27030041
- PMCID: PMC4843683
- DOI: 10.1098/rsif.2016.0099
Model-based reconstruction of an epidemic using multiple datasets: understanding influenza A/H1N1 pandemic dynamics in Israel
Abstract
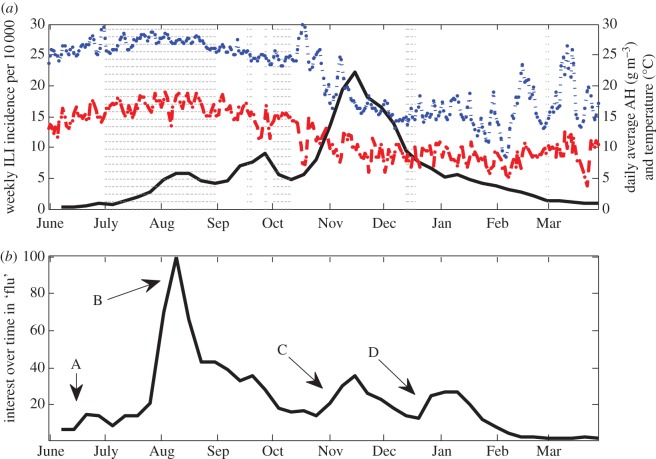
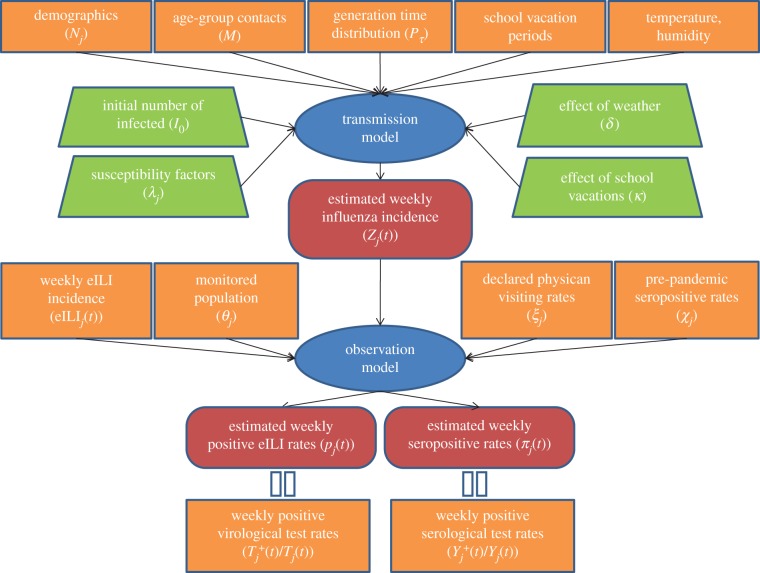
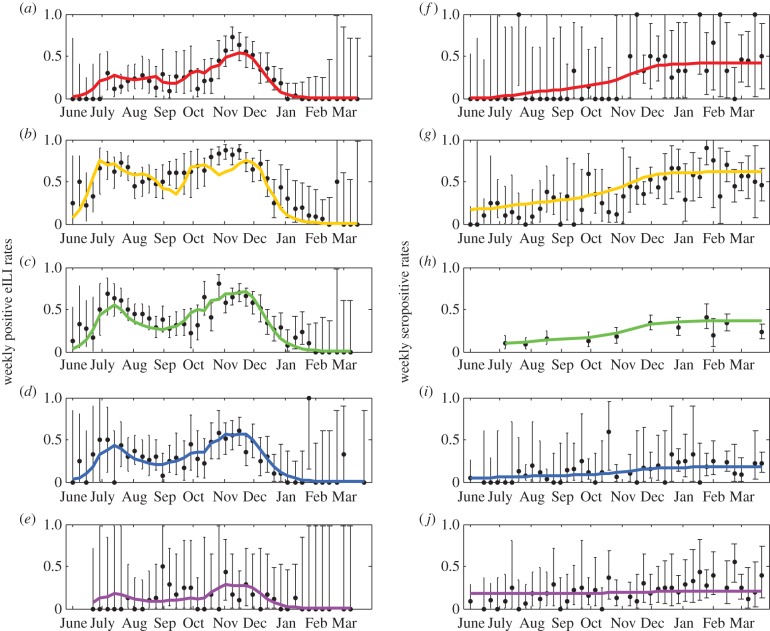
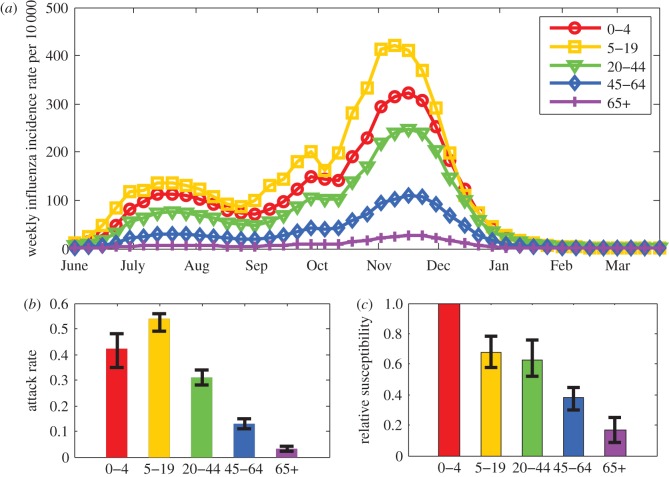
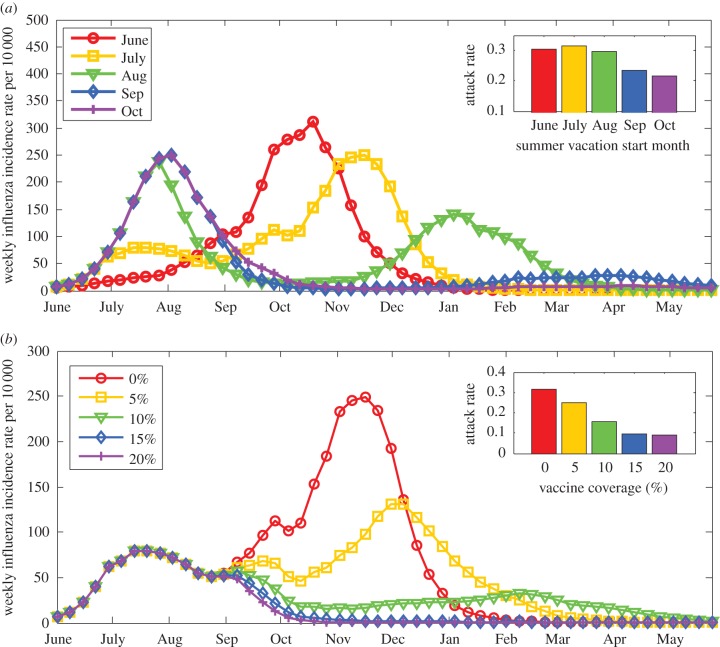
Intensified surveillance during the 2009 A/H1N1 influenza pandemic in Israel resulted in large virological and serological datasets, presenting a unique opportunity for investigating the pandemic dynamics. We employ a conditional likelihood approach for fitting a disease transmission model to virological and serological data, conditional on clinical data. The model is used to reconstruct the temporal pattern of the pandemic in Israel in five age-groups and evaluate the factors that shaped it. We estimate the reproductive number at the beginning of the pandemic to beR= 1.4. We find that the combined effect of varying absolute humidity conditions and school vacations (SVs) is responsible for the infection pattern, characterized by three epidemic waves. Overall attack rate is estimated at 32% (28-35%) with a large variation among the age-groups: the highest attack rates within school children and the lowest within the elderly. This pattern of infection is explained by a combination of the age-group contact structure and increasing immunity with age. We assess that SVs increased the overall attack rates by prolonging the pandemic into the winter. Vaccinating school children would have been the optimal strategy for minimizing infection rates in all age-groups.
Keywords: absolute humidity; age structure; disease transmission model; school vacations; serology; vaccine allocation.
© 2016 The Author(s).
Figures

Similar articles
-
Assessment of baseline age-specific antibody prevalence and incidence of infection to novel influenza A/H1N1 2009.Health Technol Assess. 2010 Dec;14(55):115-92. doi: 10.3310/hta14550-03. Health Technol Assess. 2010. PMID: 21208549
-
Spatial and temporal characteristics of the 2009 A/H1N1 influenza pandemic in Peru.PLoS One. 2011;6(6):e21287. doi: 10.1371/journal.pone.0021287. Epub 2011 Jun 21. PLoS One. 2011. PMID: 21712984 Free PMC article.
-
Serological study of the 2009 pandemic due to influenza A H1N1 in the metropolitan French population.Clin Microbiol Infect. 2012 Feb;18(2):177-83. doi: 10.1111/j.1469-0691.2011.03545.x. Epub 2011 Jun 2. Clin Microbiol Infect. 2012. PMID: 21635661
-
Effectiveness of vaccine against pandemic influenza A/H1N1 among people with underlying chronic diseases: cohort study, Denmark, 2009-10.BMJ. 2011 Jan 25;344:d7901. doi: 10.1136/bmj.d7901. BMJ. 2011. PMID: 22277542
-
Ten lessons for the next influenza pandemic-an English perspective: a personal reflection based on community surveillance data.Hum Vaccin Immunother. 2012 Jan;8(1):138-45. doi: 10.4161/hv.8.1.18808. Epub 2012 Jan 1. Hum Vaccin Immunother. 2012. PMID: 22251996 Review.
Cited by
-
Optimal vaccination at high reproductive numbers: sharp transitions and counterintuitive allocations.Proc Biol Sci. 2022 Sep 28;289(1983):20221525. doi: 10.1098/rspb.2022.1525. Epub 2022 Sep 28. Proc Biol Sci. 2022. PMID: 36168762 Free PMC article.
-
Vaccination Strategies against Seasonal Influenza in Long Term Care Setting: Lessons from a Mathematical Modelling Study.Vaccines (Basel). 2022 Dec 23;11(1):32. doi: 10.3390/vaccines11010032. Vaccines (Basel). 2022. PMID: 36679877 Free PMC article.
-
Evidence Synthesis for Stochastic Epidemic Models.Stat Sci. 2018;33(1):34-43. doi: 10.1214/17-STS631. Stat Sci. 2018. PMID: 31975746 Free PMC article.
-
Modelling and parameter inference of predator-prey dynamics in heterogeneous environments using the direct integral approach.J R Soc Interface. 2017 Jan;14(126):20160525. doi: 10.1098/rsif.2016.0525. J R Soc Interface. 2017. PMID: 28053112 Free PMC article.
References
Publication types
MeSH terms
LinkOut - more resources
Full Text Sources
Other Literature Sources
Medical
