

Do community-weighted mean functional traits reflect optimal strategies?
- PMID: 27030412
- PMCID: PMC4822452
- DOI: 10.1098/rspb.2015.2434
Do community-weighted mean functional traits reflect optimal strategies?
Abstract
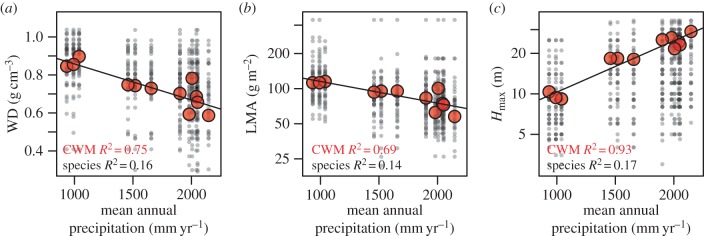
The notion that relationships between community-weighted mean (CWM) traits (i.e. plot-level trait values weighted by species abundances) and environmental conditions reflect selection towards locally optimal phenotypes is challenged by the large amount of interspecific trait variation typically found within ecological communities. Reconciling these contrasting patterns is a key to advancing predictive theories of functional community ecology. We combined data on geographical distributions and three traits (wood density, leaf mass per area and maximum height) of 173 tree species in Puerto Rico. We tested the hypothesis that species are more likely to occur where their trait values are more similar to the local CWM trait values (the'CWM-optimality' hypothesis) by comparing species occurrence patterns (as a proxy for fitness) with the functional composition of forest plots across a precipitation gradient. While 70% of the species supported CWM-optimality for at least one trait, nearly 25% significantly opposed it for at least one trait, thereby contributing to local functional diversity. The majority (85%) of species that opposed CWM-optimality did so only for one trait and few species opposed CWM-optimality in multivariate trait space. Our study suggests that constraints to local functional variation act more strongly on multivariate phenotypes than on univariate traits.
Keywords: ecological niche models; functional diversity; leaf mass per area; maximum height; tropical forests; wood density.
© 2016 The Author(s).
Figures


Similar articles
-
Community-weighted mean of leaf traits and divergence of wood traits predict aboveground biomass in secondary subtropical forests.Sci Total Environ. 2017 Jan 1;574:654-662. doi: 10.1016/j.scitotenv.2016.09.022. Epub 2016 Oct 14. Sci Total Environ. 2017. PMID: 27657991
-
Decomposing functional trait associations in a Chinese subtropical forest.PLoS One. 2017 Apr 18;12(4):e0175727. doi: 10.1371/journal.pone.0175727. eCollection 2017. PLoS One. 2017. PMID: 28419169 Free PMC article.
-
Using Plant Functional Traits and Phylogenies to Understand Patterns of Plant Community Assembly in a Seasonal Tropical Forest in Lao PDR.PLoS One. 2015 Jun 26;10(6):e0130151. doi: 10.1371/journal.pone.0130151. eCollection 2015. PLoS One. 2015. PMID: 26115369 Free PMC article.
-
Can evolutionary constraints explain the rarity of nitrogen-fixing trees in high-latitude forests?New Phytol. 2016 Sep;211(4):1195-201. doi: 10.1111/nph.14080. Epub 2016 Jul 13. New Phytol. 2016. PMID: 27411210 Review.
-
Towards multivariate functional trait syndromes: Predicting foliar water uptake in trees.Ecology. 2023 Aug;104(8):e4112. doi: 10.1002/ecy.4112. Epub 2023 Jun 13. Ecology. 2023. PMID: 37252804 Review.
Cited by
-
The impact of trait number and correlation on functional diversity metrics in real-world ecosystems.PLoS One. 2024 Sep 23;19(9):e0306342. doi: 10.1371/journal.pone.0306342. eCollection 2024. PLoS One. 2024. PMID: 39312525 Free PMC article.
-
Drought of early time in growing season decreases community aboveground biomass, but increases belowground biomass in a desert steppe.BMC Ecol Evol. 2021 Jun 1;21(1):106. doi: 10.1186/s12862-021-01842-5. BMC Ecol Evol. 2021. PMID: 34074246 Free PMC article.
-
Intraspecific variation in traits and tree growth along an elevational gradient in a subtropical forest.Oecologia. 2019 Sep;191(1):153-164. doi: 10.1007/s00442-019-04453-6. Epub 2019 Jul 31. Oecologia. 2019. PMID: 31367911
-
Episodic herbivory, plant density dependence, and stimulation of aboveground plant production.Ecol Evol. 2020 Apr 24;10(12):5302-5314. doi: 10.1002/ece3.6274. eCollection 2020 Jun. Ecol Evol. 2020. PMID: 32607153 Free PMC article.
-
C:N:P stoichiometric variations of herbs and its relationships with soil properties and species relative abundance along the Xiaokai River irrigation in the Yellow River Delta, China.Front Plant Sci. 2023 Jan 30;14:1130477. doi: 10.3389/fpls.2023.1130477. eCollection 2023. Front Plant Sci. 2023. PMID: 36794217 Free PMC article.
References
-
- Violle C, Navas ML, Vile D, Kazakou E, Fortunel C, Hummel I, Garnier E. 2007. Let the concept of trait be functional! Oikos 116, 882–892. (10.1111/j.0030-1299.2007.15559.x) - DOI
Publication types
MeSH terms
Associated data
LinkOut - more resources
Full Text Sources
Other Literature Sources
