. 2016 Mar 30;8(332):332ra44.
doi: 10.1126/scitranslmed.aad3650.

Neuronal heparan sulfates promote amyloid pathology by modulating brain amyloid-β clearance and aggregation in Alzheimer's disease

Affiliations

Neuronal heparan sulfates promote amyloid pathology by modulating brain amyloid-β clearance and aggregation in Alzheimer's disease

Chia-Chen Liu et al. Sci Transl Med. .

Abstract

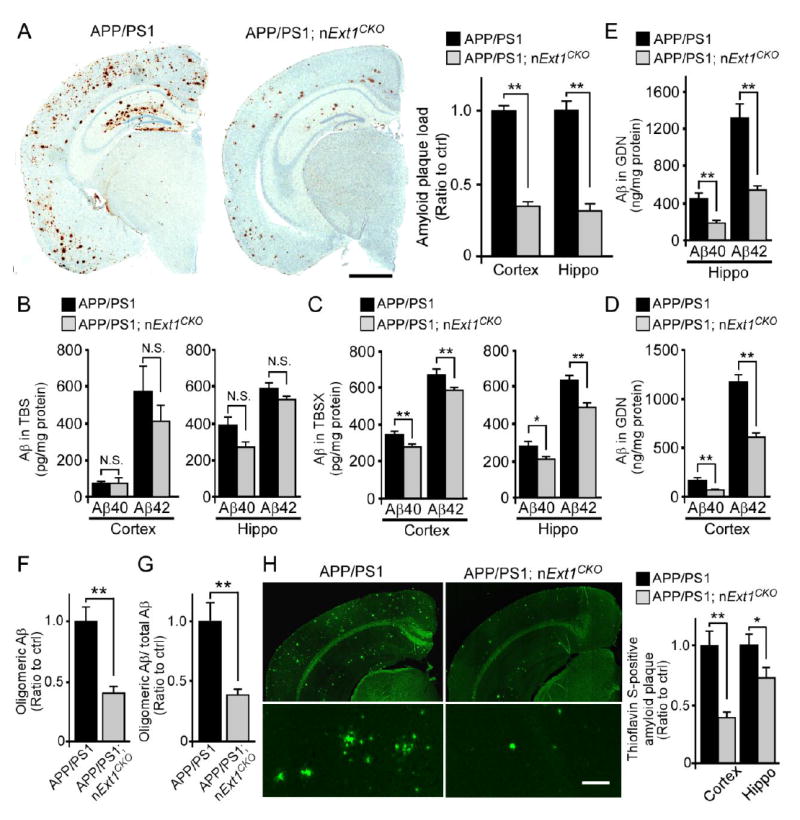
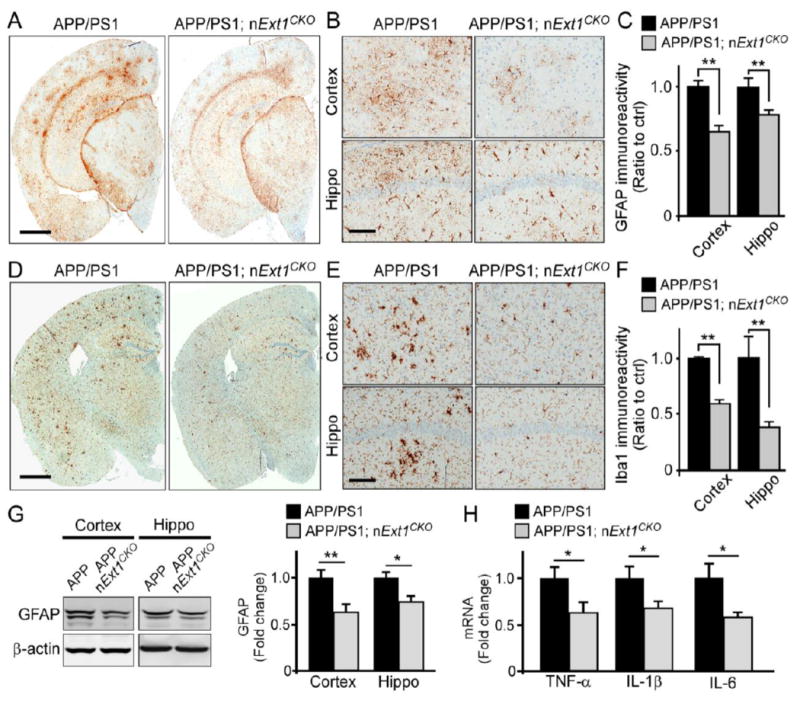
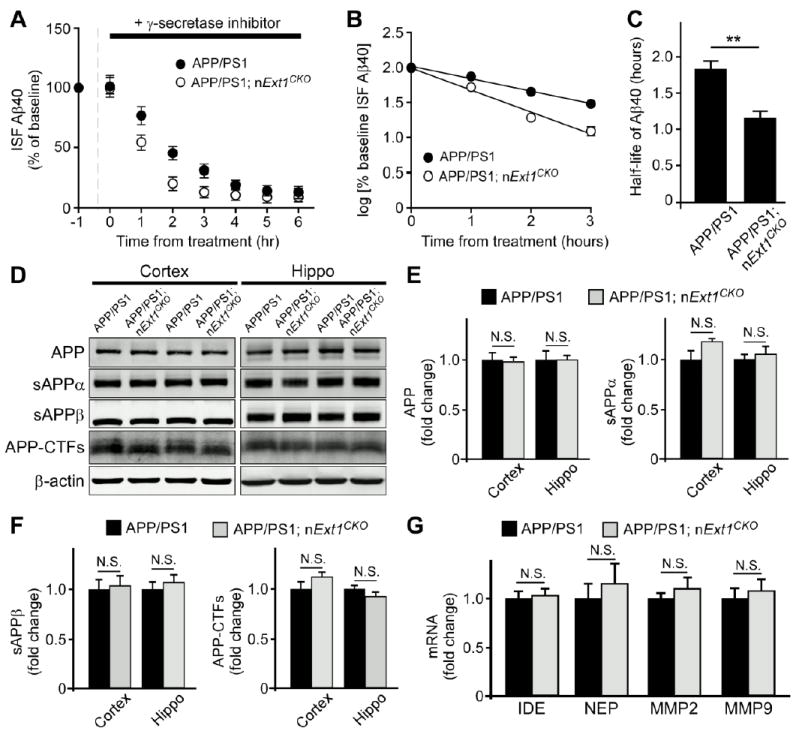
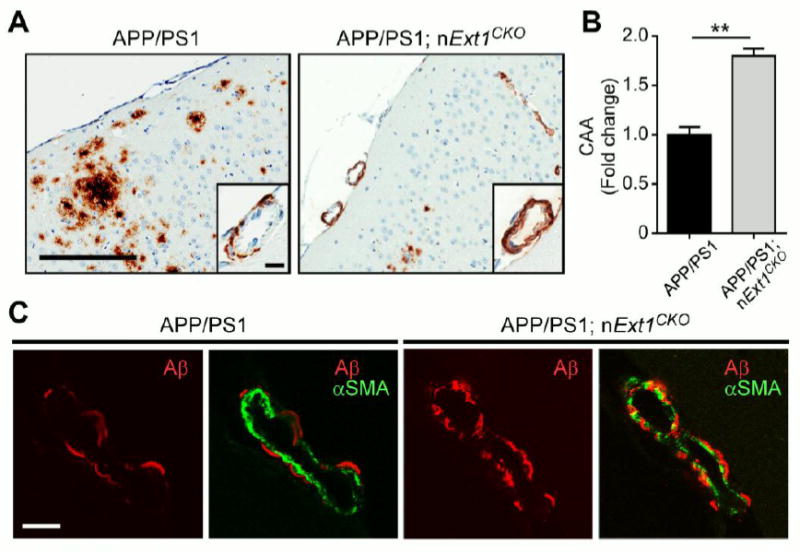
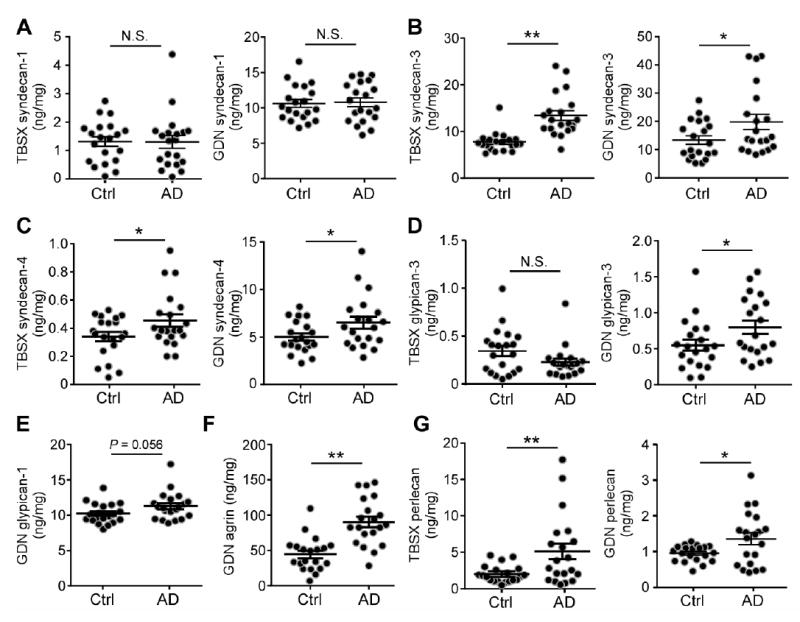
Accumulation of amyloid-β (Aβ) peptide in the brain is the first critical step in the pathogenesis of Alzheimer's disease (AD). Studies in humans suggest that Aβ clearance from the brain is frequently impaired in late-onset AD. Aβ accumulation leads to the formation of Aβ aggregates, which injure synapses and contribute to eventual neurodegeneration. Cell surface heparan sulfates (HSs), expressed on all cell types including neurons, have been implicated in several features in the pathogenesis of AD including its colocalization with amyloid plaques and modulatory role in Aβ aggregation. We show that removal of neuronal HS by conditional deletion of the Ext1 gene, which encodes an essential glycosyltransferase for HS biosynthesis, in postnatal neurons of amyloid model APP/PS1 mice led to a reduction in both Aβ oligomerization and the deposition of amyloid plaques. In vivo microdialysis experiments also detected an accelerated rate of Aβ clearance in the brain interstitial fluid, suggesting that neuronal HS either inhibited or represented an inefficient pathway for Aβ clearance. We found that the amounts of various HS proteoglycans (HSPGs) were increased in postmortem human brain tissues from AD patients, suggesting that this pathway may contribute directly to amyloid pathogenesis. Our findings have implications for AD pathogenesis and provide insight into therapeutic interventions targeting Aβ-HSPG interactions.


Conflict of interest statement

Competing interests: DH is on the scientific advisory boards of Genentech, AstraZeneca, Neurophage, and Denali, and has consulted for Eli Lilly, AbbVie, Novartis, Ono Pharma. DH is a cofounder of C2N Diagnostics LLC and has equity in the company. The other authors declare no competing interests.

Figures

Fig. 1
Fig. 1
Neuronal HS deficiency reduces amyloid deposition. (A) Brain sections from control (APP/PS1) and neuronal HS-deficient (APP/PS1; nExt1CKO) mice (n=6-10/group) at 12 months of age were immunostained with a pan-Aβ antibody. Scale bar, 1 mm. The percentage of area covered by plaques was quantified, and the plaque load was normalized to that of APP/PS1 mice. (B to E) The cortical and hippocampal brain tissues of APP/PS1 and APP/PS1; nExt1CKO mice (n=7-12/group) at 12 months of age were fractionated into TBS-soluble, detergent-soluble (TBSX), and insoluble (guanidine-HCl, GDN) fractions. The amount of Aβ40 and Aβ42 in TBS (B), TBSX (C), and GDN (D to E) fractions was quantified by ELISA. (F) Soluble oligomeric Aβ in the cortex of APP/PS1 and APP/PS1; nExt1CKO mice (n=10-12/group). (G) The ratio of soluble oligomeric Aβ versus total Aβ in the TBS-soluble fraction in the cortex of APP/PS1 and APP/PS1; nExt1CKO mice (n=10-12/group). (H) Quantification of Thioflavin S-positive amyloid plaques in the cortex and hippocampus of APP/PS1 and APP/PS1; nExt1CKO mice (n=13/group) at 12 months of age. Scale bar, 100 μm. Values represent means ± SEM. N.S., not significant; *P < 0.05; **P < 0.01. Statistical analysis was performed using Student’s t test.
Fig. 2
Fig. 2
Deficiency of neuronal HS leads to reduced neuroinflammation. (A to C) Brain sections from APP/PS1 and APP/PS1; nExt1CKO mice at 12 months of age were immunostained with GFAP antibody. Scale bar, 1 mm. (B) Representative images of GFAP staining in the cortex and hippocampal CA1 region are shown. Scale bar, 1 mm. (C) Stained sections were scanned on the Aperio slide scanner and analyzed using the ImageScope software. The percentage of areas covered by GFAP staining in cortex (n=11-13/group) and hippocampus (n=7-10/group) were quantified. (D to F) Brain sections from APP/PS1 and APP/PS1; nExt1CKO mice at 12 months of age were immunostained with Iba1 antibody. Scale bar, 1 mm. (E) Representative images of Iba1 staining in the cortex and hippocampal CA1 region are shown. Scale bar, 100 m. (F) The percentage of area covered by Iba1 staining was quantified (n=4/group). (G) The amount of GFAP in the cortex (n= 9/group) and hippocampus (n= 8-9/group) of APP/PS1 and APP/PS1; nExt1CKO mice examined by Western blot. (H) The amounts of TNF-α, IL-1β and IL-6 in the cortex of APP/PS1 and APP/PS1; nExt1CKO mice (n=6-8/group) evaluated by real-time PCR. Data represent mean ± SEM. *P < 0.05; **P < 0.01. Statistical analysis was performed using Student’s t test.
Fig. 3
Fig. 3
Deficiency of neuronal HS increases ISF Aβ clearance in the hippocampus of APP/PS1 mice. (A to C) APP/PS1 and APP/PS1; nExt1CKO mice (n= 8/group) were analyzed at the age of 3-4 months. To assess Aβ40 half-life, the mice were treated with a γ-secretase inhibitor, and the hippocampal ISF Aβ40 was monitored. ISF Aβ concentration during the hours of 9-16 after probe implantation were averaged and served as the basal amount of Aβ (shown as -1~0 hr) prior to γ-secretase injection (A). The common logarithm of percentage baseline ISF Aβ40 concentrations versus time was plotted (B). Data represent mean ± SEM. The slope from the individual linear regressions from log (% ISF Aβ40) versus time for each mouse was used to calculate the mean half-life (t1/2) of elimination for Aβ from the ISF (C). Data represent mean ± SEM. **P < 0.01. (D to F) Full-length APP, sAPPα, sAPPβ, CTF and β-actin were analyzed by Western blots in APP/PS1 and APP/PS1; nExt1CKO mice (n= 7-10/group) at 12 months of age. Densitometric quantification is expressed as mean ± SEM. (G) The mRNA of insulin degrading enzyme (IDE), neprilysin (NEP), MMP2 and MMP9 in the cortex of APP/PS1 and APP/PS1; nExt1CKO mice (n=8/group) evaluated by real-time PCR. N.S., not significant. Statistical analysis was performed using Student’s t test.
Fig. 4
Fig. 4
Deletion of neuronal HS increases the abundance of CAA along the cerebral vasculature. (A, B) Aβ deposition in brain sections from control APP/PS1 and APP/PS1; nExt1CKO mice at 12 months of age was immunostained with a pan-Aβ antibody. Scale bar, 200 μm. (Inset) Immunostaining of Aβ deposition along leptomeningeal arteries as CAA in control APP/PS1 and APP/PS1; nExt1CKO mice. Scale bar, 10 μm. (B) The burden of CAA formation in leptomeningeal arteries in control APP/PS1 and APP/PS1; nExt1CKO mice (10 arteries/mouse; 10 mice/genotype) was quantified after scanning Aβ immunostaining by the Positive Pixel Count program (Aperio Technologies). Data represent mean ± SEM. **P < 0.01. Statistical analysis was performed using Student’s t test. (C) Co-immunofluorescence staining of leptomeningeal arteries with αSMA (green) and Aβ (red) antibodies. Scale bar, 10 μm.
Fig. 5
Fig. 5
Several classes of HSPGs are elevated in human AD brain tissues. Human temporal lobe brain tissues from control (n=20) and AD (n=20) groups were lysed and fractionated through sequential extraction with TBS, TBSX, and GDN. (A-C) Transmembrane HSPGs, including syndecan-1, syndecan-3 and syndecan-4, in TBSX and GDN fractions of control and AD brain tissues were quantified by specific ELISAs. (D, E) The amounts of the GPI-anchored HSPGs glypican-1 and glypican-3 in TBSX and GDN fractions of control and AD brain tissue were quantified by specific ELISAs. (F, G) The amounts of two major extracellular matrix HSPGs agrin and perlecan in GDN fractions of control and AD brains were quantified by specific ELISAs. Results are presented as means ± SEM. N.S., not significant; *P < 0.05; **P < 0.01.

Comment in

Similar articles

Cited by

References

    1. Hardy J, Selkoe DJ. The amyloid hypothesis of Alzheimer’s disease: progress and problems on the road to therapeutics. Science. 2002;297:353–356. - PubMed
    1. Selkoe DJ. Deciphering the genesis and fate of amyloid beta-protein yields novel therapies for Alzheimer disease. J Clin Invest. 2002;110:1375–1381. - PMC - PubMed
    1. Vassar R, Bennett BD, Babu-Khan S, Kahn S, Mendiaz EA, Denis P, Teplow DB, Ross S, Amarante P, Loeloff R, Luo Y, Fisher S, Fuller J, Edenson S, Lile J, Jarosinski MA, Biere AL, Curran E, Burgess T, Louis JC, Collins F, Treanor J, Rogers G, Citron M. Beta-secretase cleavage of Alzheimer’s amyloid precursor protein by the transmembrane aspartic protease BACE. Science. 1999;286:735–741. - PubMed
    1. Kimberly WT, LaVoie MJ, Ostaszewski BL, Ye W, Wolfe MS, Selkoe DJ. Gamma-secretase is a membrane protein complex comprised of presenilin, nicastrin, Aph-1, and Pen-2. Proc Natl Acad Sci U S A. 2003;100:6382–6387. - PMC - PubMed
    1. Goate A. Segregation of a missense mutation in the amyloid beta-protein precursor gene with familial Alzheimer’s disease. J Alzheimers Dis. 2006;9:341–347. - PubMed

Publication types