

Differences in electrophysiological properties of functionally identified nociceptive sensory neurons in an animal model of cancer-induced bone pain
- PMID: 27030711
- PMCID: PMC4994860
- DOI: 10.1177/1744806916628778
Differences in electrophysiological properties of functionally identified nociceptive sensory neurons in an animal model of cancer-induced bone pain
Abstract
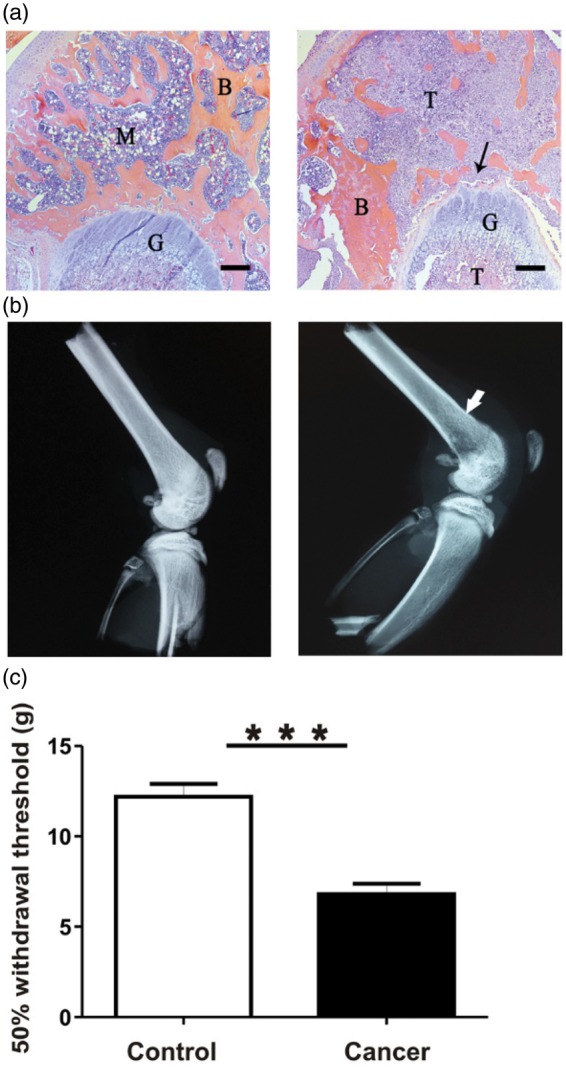
Background: Bone cancer pain is often severe, yet little is known about mechanisms generating this type of chronic pain. While previous studies have identified functional alterations in peripheral sensory neurons that correlate with bone tumours, none has provided direct evidence correlating behavioural nociceptive responses with properties of sensory neurons in an intact bone cancer model.
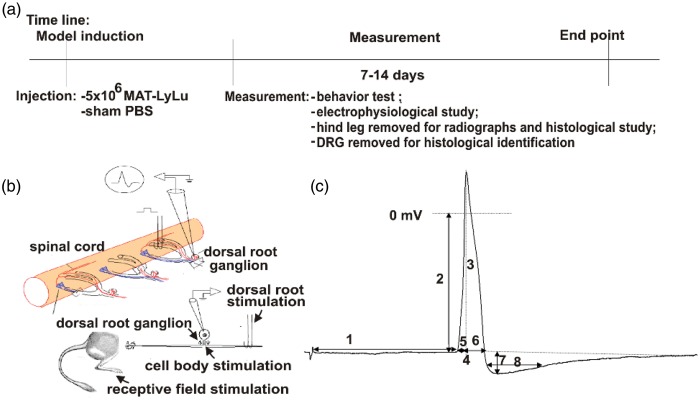
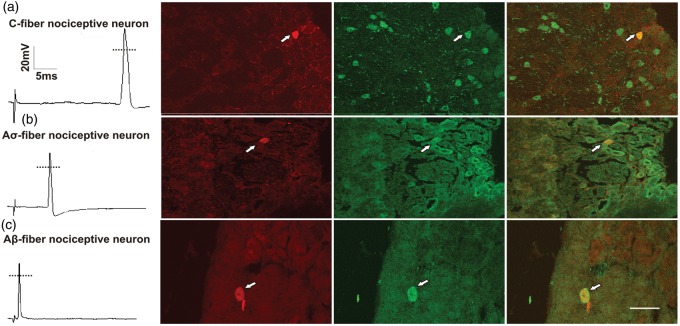
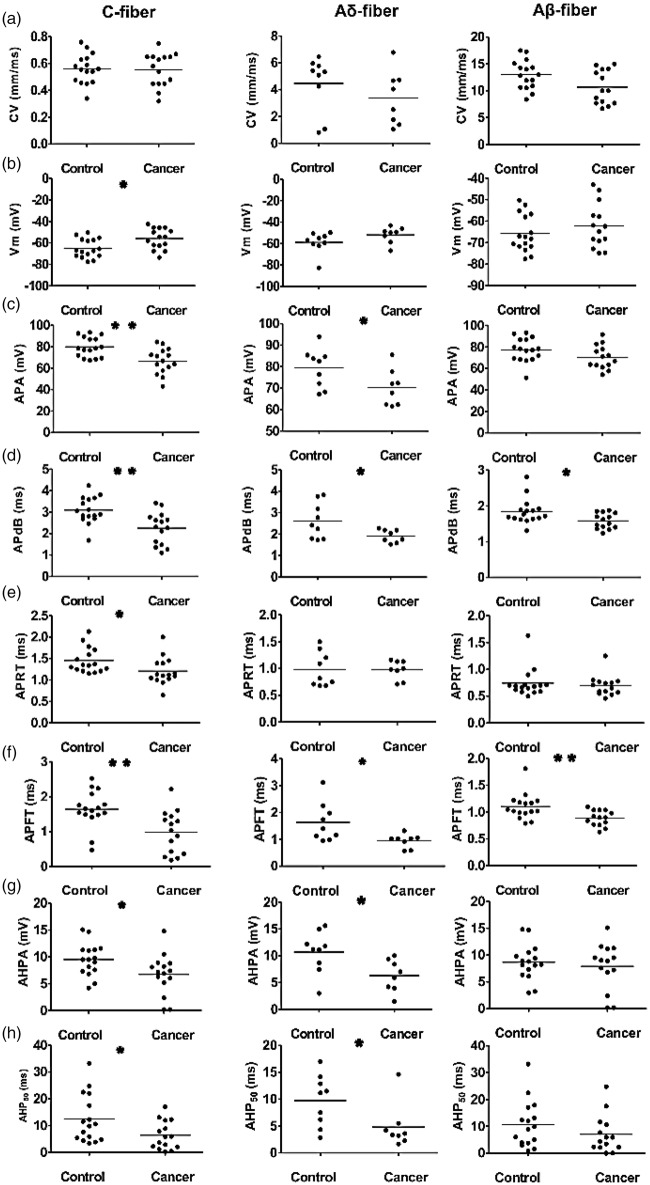
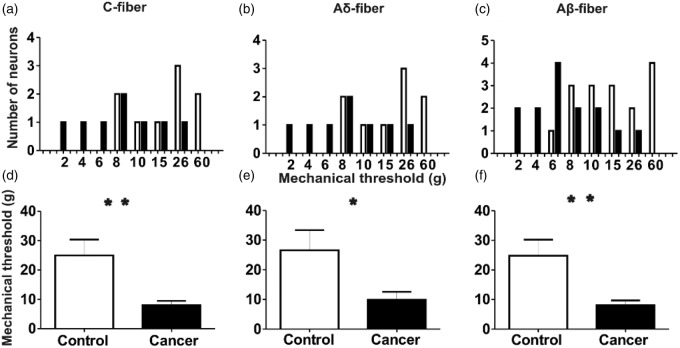
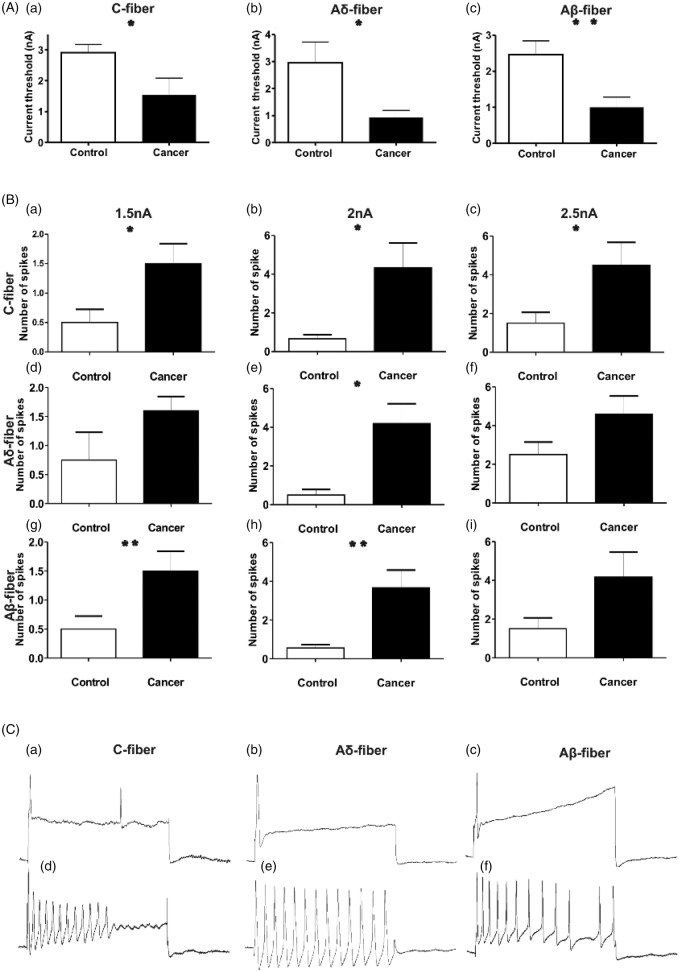
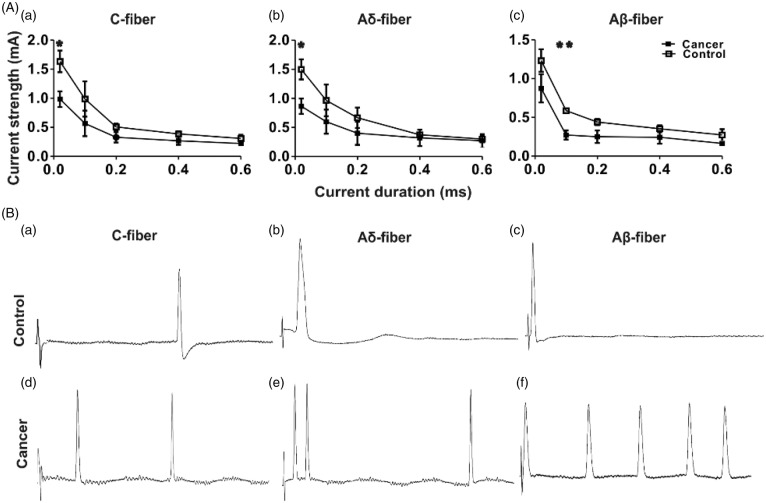
Results: In a rat model of prostate cancer-induced bone pain, we confirmed tactile hypersensitivity using the von Frey test. Subsequently, we recorded intracellularly from dorsal root ganglion neurons in vivo in anesthetized animals. Neurons remained connected to their peripheral receptive terminals and were classified on the basis of action potential properties, responses to dorsal root stimulation, and to mechanical stimulation of the respective peripheral receptive fields. Neurons included C-, Aδ-, and Aβ-fibre nociceptors, identified by their expression of substance P. We suggest that bone tumour may induce phenotypic changes in peripheral nociceptors and that these could contribute to bone cancer pain.
Conclusions: This work represents a significant technical and conceptual advance in the study of peripheral nociceptor functions in the development of cancer-induced bone pain. This is the first study to report that changes in sensitivity and excitability of dorsal root ganglion primary afferents directly correspond to mechanical allodynia and hyperalgesia behaviours following prostate cancer cell injection into the femur of rats. Furthermore, our unique combination of techniques has allowed us to follow, in a single neuron, mechanical pain-related behaviours, electrophysiological changes in action potential properties, and dorsal root substance P expression. These data provide a more complete understanding of this unique pain state at the cellular level that may allow for future development of mechanism-based treatments for cancer-induced bone pain.
Keywords: Bone cancer; behaviour; dorsal root ganglion; electrophysiology; pain; primary afferent; prostate cancer.
© The Author(s) 2016.
Figures
Similar articles
-
Excitability of Aβ sensory neurons is altered in an animal model of peripheral neuropathy.BMC Neurosci. 2012 Jan 30;13:15. doi: 10.1186/1471-2202-13-15. BMC Neurosci. 2012. PMID: 22289651 Free PMC article.
-
Cancer pain and neuropathic pain are associated with A β sensory neuronal plasticity in dorsal root ganglia and abnormal sprouting in lumbar spinal cord.Mol Pain. 2018 Jan-Dec;14:1744806918810099. doi: 10.1177/1744806918810099. Epub 2018 Oct 16. Mol Pain. 2018. PMID: 30324862 Free PMC article.
-
L5 spinal nerve axotomy induces sensitization of cutaneous L4 Aβ-nociceptive dorsal root ganglion neurons in the rat in vivo.Neurosci Lett. 2016 Jun 15;624:72-7. doi: 10.1016/j.neulet.2016.05.008. Epub 2016 May 9. Neurosci Lett. 2016. PMID: 27173166
-
Abeta-fiber nociceptive primary afferent neurons: a review of incidence and properties in relation to other afferent A-fiber neurons in mammals.Brain Res Brain Res Rev. 2004 Oct;46(2):131-45. doi: 10.1016/j.brainresrev.2004.07.015. Brain Res Brain Res Rev. 2004. PMID: 15464202 Review.
-
Dissociation of dorsal root ganglion neurons into afferent and efferent-like neurons.Neuroscience. 1998 Sep;86(2):389-98. doi: 10.1016/s0306-4522(98)00047-5. Neuroscience. 1998. PMID: 9881854 Review.
Cited by
-
Activation of the P2X7 receptor in midbrain periaqueductal gray participates in the analgesic effect of tramadol in bone cancer pain rats.Mol Pain. 2018 Jan-Dec;14:1744806918803039. doi: 10.1177/1744806918803039. Epub 2018 Sep 10. Mol Pain. 2018. PMID: 30198382 Free PMC article.
-
Evaluating the efficacy of cannabidiol to manage surgically induced neuropathic pain in a preclinical rat model: Are T cells a sexually dimorphic target?Can J Pain. 2019 Jul 30;3(2):44-48. doi: 10.1080/24740527.2019.1612235. eCollection 2019. Can J Pain. 2019. PMID: 35005418 Free PMC article.
-
Bone cancer-induced pain is associated with glutamate signalling in peripheral sensory neurons.Mol Pain. 2020 Jan-Dec;16:1744806920911536. doi: 10.1177/1744806920911536. Mol Pain. 2020. PMID: 32133928 Free PMC article.
-
Emerging Molecular and Synaptic Targets for the Management of Chronic Pain Caused by Systemic Lupus Erythematosus.Int J Mol Sci. 2024 Mar 22;25(7):3602. doi: 10.3390/ijms25073602. Int J Mol Sci. 2024. PMID: 38612414 Free PMC article. Review.
-
Upregulation of Spinal Voltage-Dependent Anion Channel 1 Contributes to Bone Cancer Pain Hypersensitivity in Rats.Neurosci Bull. 2017 Dec;33(6):711-721. doi: 10.1007/s12264-017-0195-1. Epub 2017 Dec 1. Neurosci Bull. 2017. PMID: 29196874 Free PMC article.
References
-
- Cleeland CS, Bennett GJ, Dantzer R, et al. Are the symptoms of cancer and cancer treatment due to a shared biologic mechanism? A cytokine-immunologic model of cancer symptoms. Cancer 2003; 97: 2919–2925. - PubMed
-
- Krishnasamy M. Fatigue in advanced cancer—meaning before measurement? Int J Nurs Stud 2000; 37: 401–414. - PubMed
-
- Mercadante S. Malignant bone pain: pathophysiology and treatment. Pain 1997; 69: 1–18. - PubMed
-
- Nijs J, Van de Velde B, De Meirleir K. Pain in patients with chronic fatigue syndrome: does nitric oxide trigger central sensitisation? Med Hypotheses 2005; 64: 558–562. - PubMed
-
- Sabino MA, Ghilardi JR, Jongen JL, et al. Simultaneous reduction in cancer pain, bone destruction, and tumor growth by selective inhibition of cyclooxygenase-2. Cancer Res 2002; 62: 7343–7349. - PubMed
Publication types
MeSH terms
Grants and funding
LinkOut - more resources
Full Text Sources
Other Literature Sources
Medical
