Impact of similarity threshold on the topology of molecular similarity networks and clustering outcomes
- PMID: 27030802
- PMCID: PMC4812625
- DOI: 10.1186/s13321-016-0127-5
Impact of similarity threshold on the topology of molecular similarity networks and clustering outcomes
Erratum in
-
Erratum to: Impact of similarity threshold on the topology of molecular similarity networks and clustering outcomes.J Cheminform. 2016 May 20;8:28. doi: 10.1186/s13321-016-0140-8. eCollection 2016. J Cheminform. 2016. PMID: 27213018 Free PMC article.
Abstract
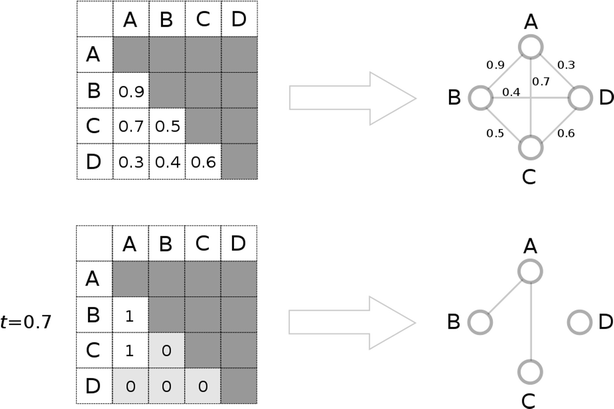
Background: Complex network theory based methods and the emergence of "Big Data" have reshaped the terrain of investigating structure-activity relationships of molecules. This change gave rise to new methods which need to face an important challenge, namely: how to restructure a large molecular dataset into a network that best serves the purpose of the subsequent analyses. With special focus on network clustering, our study addresses this open question by proposing a data transformation method and a clustering framework.
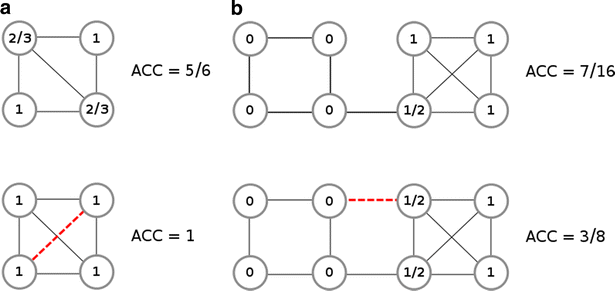
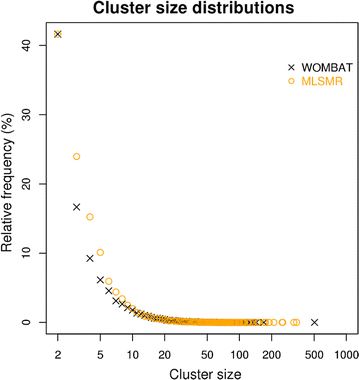
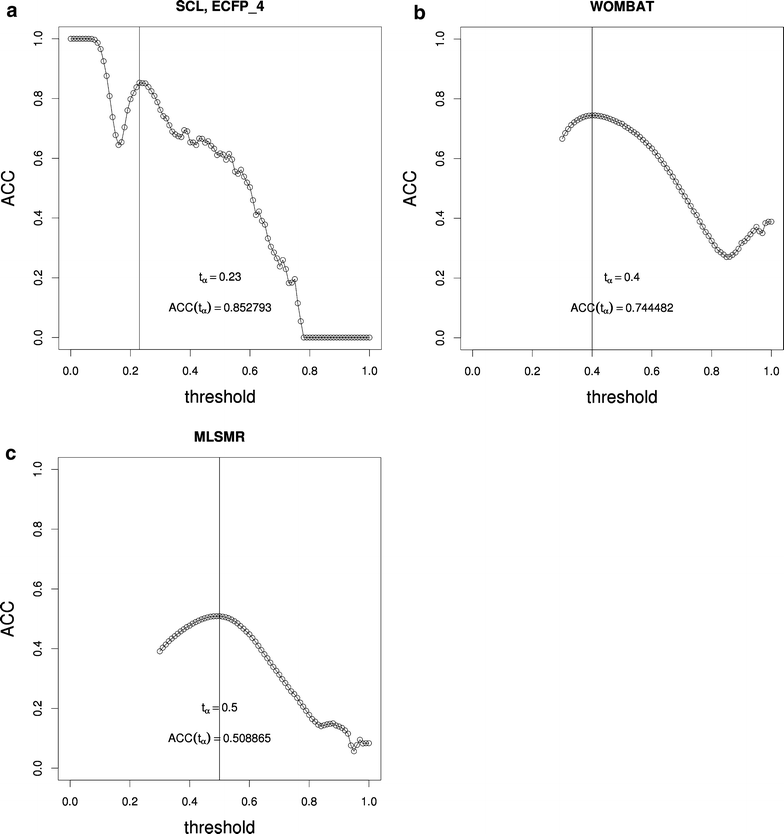
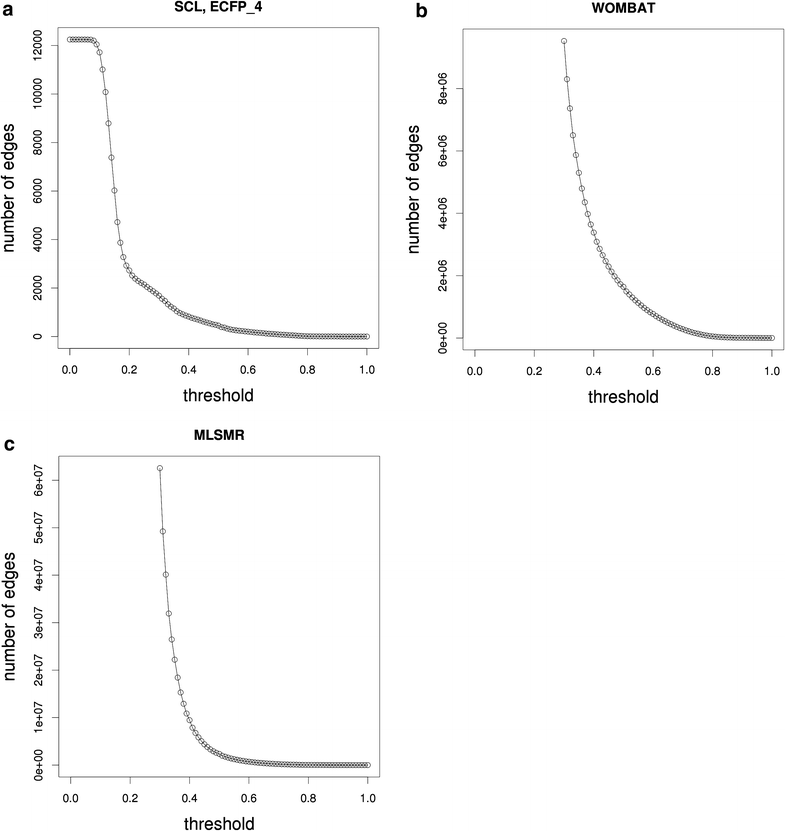
Results: Using the WOMBAT and PubChem MLSMR datasets we investigated the relation between varying the similarity threshold applied on the similarity matrix and the average clustering coefficient of the emerging similarity-based networks. These similarity networks were then clustered with the InfoMap algorithm. We devised a systematic method to generate so-called "pseudo-reference" clustering datasets which compensate for the lack of large-scale reference datasets. With help from the clustering framework we were able to observe the effects of varying the similarity threshold and its consequence on the average clustering coefficient and the clustering performance.
Conclusions: We observed that the average clustering coefficient versus similarity threshold function can be characterized by the presence of a peak that covers a range of similarity threshold values. This peak is preceded by a steep decline in the number of edges of the similarity network. The maximum of this peak is well aligned with the best clustering outcome. Thus, if no reference set is available, choosing the similarity threshold associated with this peak would be a near-ideal setting for the subsequent network cluster analysis. The proposed method can be used as a general approach to determine the appropriate similarity threshold to generate the similarity network of large-scale molecular datasets.
Figures

Similar articles
-
CASS: A distributed network clustering algorithm based on structure similarity for large-scale network.PLoS One. 2018 Oct 10;13(10):e0203670. doi: 10.1371/journal.pone.0203670. eCollection 2018. PLoS One. 2018. PMID: 30303961 Free PMC article.
-
A nearest-neighbors network model for sequence data reveals new insight into genotype distribution of a pathogen.BMC Bioinformatics. 2018 Dec 12;19(1):475. doi: 10.1186/s12859-018-2453-2. BMC Bioinformatics. 2018. PMID: 30541438 Free PMC article.
-
GO functional similarity clustering depends on similarity measure, clustering method, and annotation completeness.BMC Bioinformatics. 2019 Mar 27;20(1):155. doi: 10.1186/s12859-019-2752-2. BMC Bioinformatics. 2019. PMID: 30917779 Free PMC article.
-
Comparison of topological clustering within protein networks using edge metrics that evaluate full sequence, full structure, and active site microenvironment similarity.Protein Sci. 2015 Sep;24(9):1423-39. doi: 10.1002/pro.2724. Epub 2015 Aug 18. Protein Sci. 2015. PMID: 26073648 Free PMC article.
-
Semiautomatic robust regression clustering of international trade data.Stat Methods Appt. 2021;30(3):863-894. doi: 10.1007/s10260-021-00569-3. Epub 2021 Jun 11. Stat Methods Appt. 2021. PMID: 34131421 Free PMC article. Review.
Cited by
-
Efficient clustering of large molecular libraries.bioRxiv [Preprint]. 2024 Aug 10:2024.08.10.607459. doi: 10.1101/2024.08.10.607459. bioRxiv. 2024. Update in: Digit Discov. 2025 Mar 13;4(4):1042-1051. doi: 10.1039/d5dd00030k. PMID: 39149242 Free PMC article. Updated. Preprint.
-
DeepGraphMolGen, a multi-objective, computational strategy for generating molecules with desirable properties: a graph convolution and reinforcement learning approach.J Cheminform. 2020 Sep 4;12(1):53. doi: 10.1186/s13321-020-00454-3. J Cheminform. 2020. PMID: 33431037 Free PMC article.
-
Modulation of Triple Artemisinin-Based Combination Therapy Pharmacodynamics by Plasmodium falciparum Genotype.ACS Pharmacol Transl Sci. 2020 Nov 2;3(6):1144-1157. doi: 10.1021/acsptsci.0c00110. eCollection 2020 Dec 11. ACS Pharmacol Transl Sci. 2020. PMID: 33344893 Free PMC article.
-
SmartGraph: a network pharmacology investigation platform.J Cheminform. 2020 Jan 21;12(1):5. doi: 10.1186/s13321-020-0409-9. J Cheminform. 2020. PMID: 33430980 Free PMC article.
-
Network-based piecewise linear regression for QSAR modelling.J Comput Aided Mol Des. 2019 Sep;33(9):831-844. doi: 10.1007/s10822-019-00228-6. Epub 2019 Oct 18. J Comput Aided Mol Des. 2019. PMID: 31628660 Free PMC article.
References
Grants and funding
LinkOut - more resources
Full Text Sources
Other Literature Sources

