

Defining Molecular Basis for Longevity Traits in Natural Yeast Isolates
- PMID: 27030810
- PMCID: PMC4807016
- DOI: 10.1038/npjamd.2015.1
Defining Molecular Basis for Longevity Traits in Natural Yeast Isolates
Abstract
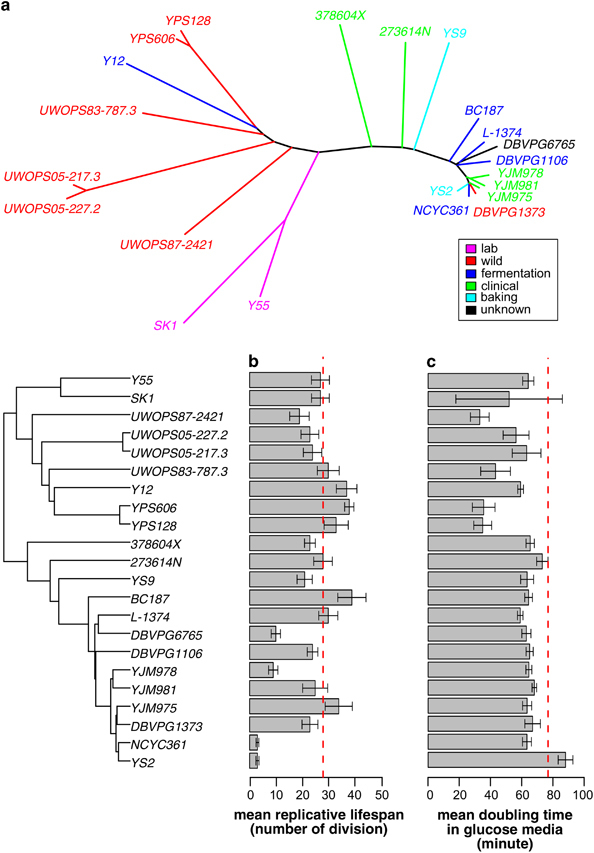
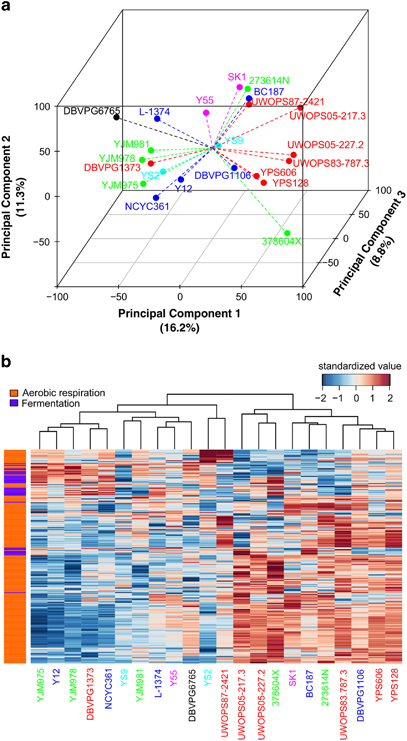
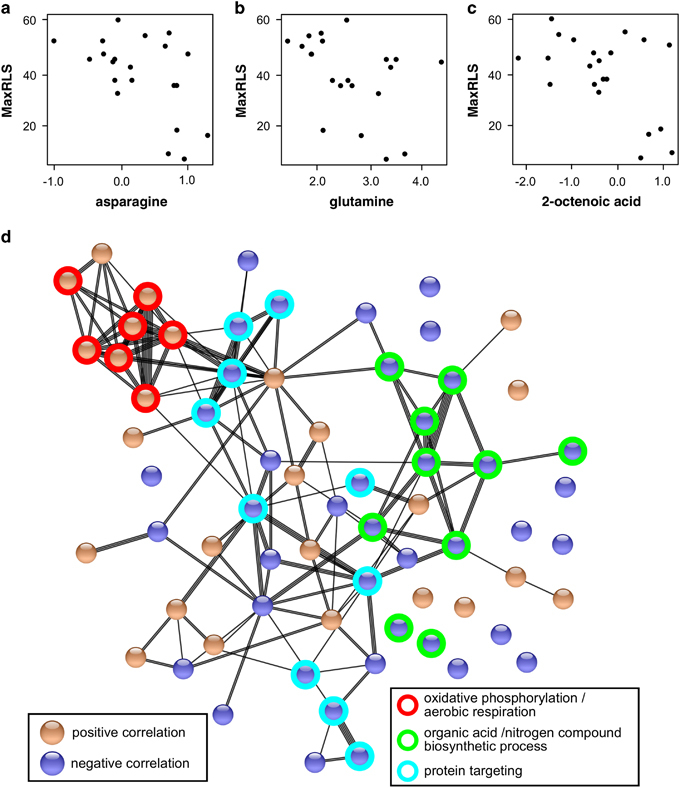
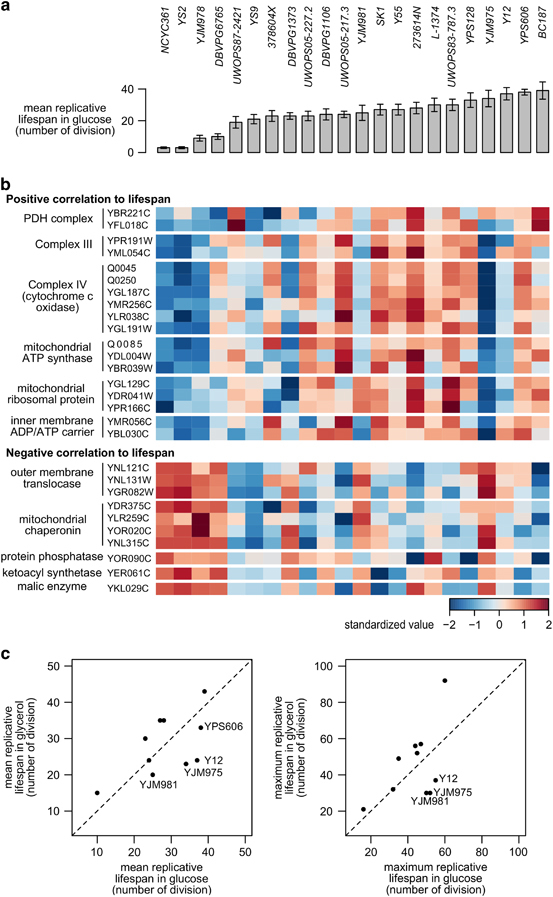
The budding yeast has served as a useful model organism in aging studies, leading to the identification of genetic determinants of longevity, many of which are conserved in higher eukaryotes. However, factors that promote longevity in laboratory setting often have severe fitness disadvantage in the wild. Here, to obtain an unbiased view on longevity regulation we analyzed how replicative lifespan is shaped by transcriptional, translational, metabolic, and morphological factors across 22 wild-type Saccharomyces cerevisiae isolates. We observed significant differences in lifespan across these strains and found that their longevity is strongly associated with up-regulation of oxidative phosphorylation and respiration and down-regulation of amino acid and nitrogen compound biosynthesis. Since calorie restriction and TOR signaling also extend lifespan by adjusting many of the identified pathways, the data suggest that natural plasticity of yeast lifespan is shaped by processes that not only do not impose cost on fitness, but are amenable to dietary intervention.
Conflict of interest statement
The authors declare no conflict of interest.
Figures
Similar articles
-
Evolution of natural lifespan variation and molecular strategies of extended lifespan in yeast.Elife. 2021 Nov 9;10:e64860. doi: 10.7554/eLife.64860. Elife. 2021. PMID: 34751131 Free PMC article.
-
Pterocarpus marsupium extract extends replicative lifespan in budding yeast.Geroscience. 2021 Oct;43(5):2595-2609. doi: 10.1007/s11357-021-00418-x. Epub 2021 Jul 23. Geroscience. 2021. PMID: 34297314 Free PMC article.
-
Proteomic analysis of dietary restriction in yeast reveals a role for Hsp26 in replicative lifespan extension.Biochem J. 2021 Dec 22;478(24):4153-4167. doi: 10.1042/BCJ20210432. Biochem J. 2021. PMID: 34661239 Free PMC article.
-
Yeast replicative aging: a paradigm for defining conserved longevity interventions.FEMS Yeast Res. 2014 Feb;14(1):148-59. doi: 10.1111/1567-1364.12104. Epub 2013 Oct 30. FEMS Yeast Res. 2014. PMID: 24119093 Free PMC article. Review.
-
Is Gcn4-induced autophagy the ultimate downstream mechanism by which hormesis extends yeast replicative lifespan?Curr Genet. 2019 Jun;65(3):717-720. doi: 10.1007/s00294-019-00936-4. Epub 2019 Jan 23. Curr Genet. 2019. PMID: 30673825 Free PMC article. Review.
Cited by
-
Gene expression signatures of human cell and tissue longevity.NPJ Aging Mech Dis. 2016 Jul 7;2:16014. doi: 10.1038/npjamd.2016.14. eCollection 2016. NPJ Aging Mech Dis. 2016. PMID: 28721269 Free PMC article.
-
Intragenic repeat expansion in the cell wall protein gene HPF1 controls yeast chronological aging.Genome Res. 2020 May;30(5):697-710. doi: 10.1101/gr.253351.119. Epub 2020 Apr 10. Genome Res. 2020. PMID: 32277013 Free PMC article.
-
Effects of an unusual poison identify a lifespan role for Topoisomerase 2 in Saccharomyces cerevisiae.Aging (Albany NY). 2017 Jan 5;9(1):68-97. doi: 10.18632/aging.101114. Aging (Albany NY). 2017. PMID: 28077781 Free PMC article.
-
Iron Supplementation Delays Aging and Extends Cellular Lifespan through Potentiation of Mitochondrial Function.Cells. 2022 Mar 2;11(5):862. doi: 10.3390/cells11050862. Cells. 2022. PMID: 35269484 Free PMC article.
-
Mitochondrial-nuclear coadaptation revealed through mtDNA replacements in Saccharomyces cerevisiae.BMC Evol Biol. 2020 Sep 25;20(1):128. doi: 10.1186/s12862-020-01685-6. BMC Evol Biol. 2020. PMID: 32977769 Free PMC article.
References
-
- Finch CE , Ruvkun G . The genetics of aging. Ann Rev Genomics Hum Genet 2001; 2: 435–462. - PubMed
-
- Kenyon CJ . The genetics of ageing. Nature 2010; 464: 504–512. - PubMed
-
- McCay CM , Crowell MF , Maynard LA . The effect of retarded growth upon the length of life span and upon the ultimate body size. 1935. Nutrition 1989; 5: 155–171. - PubMed
Grants and funding
LinkOut - more resources
Full Text Sources
Other Literature Sources
Molecular Biology Databases
