. 2016 Mar 31;11(3):e0152745.
doi: 10.1371/journal.pone.0152745. eCollection 2016.

Investigating the Proton Donor in the NO Reductase from Paracoccus denitrificans

Affiliations

Investigating the Proton Donor in the NO Reductase from Paracoccus denitrificans

Josy ter Beek et al. PLoS One. .

Erratum in

Abstract

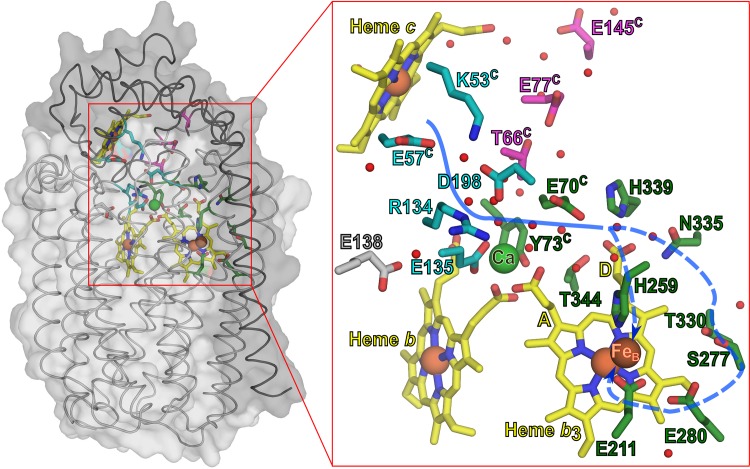
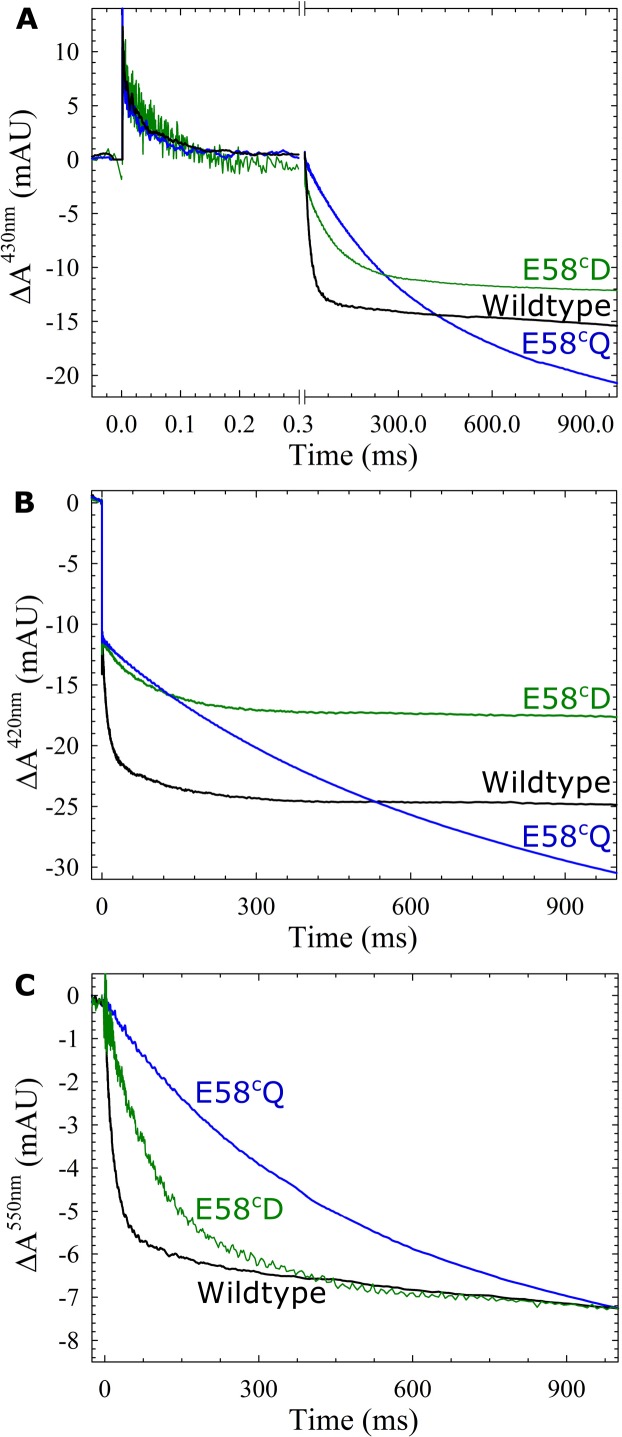
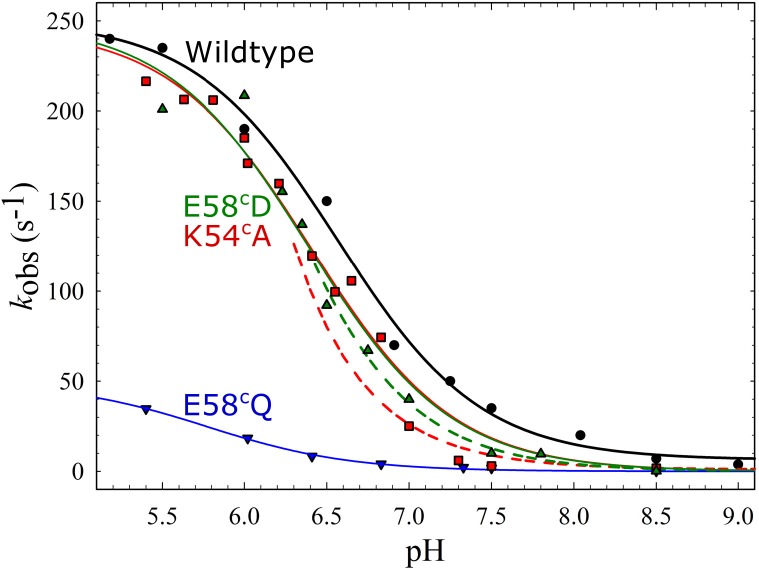
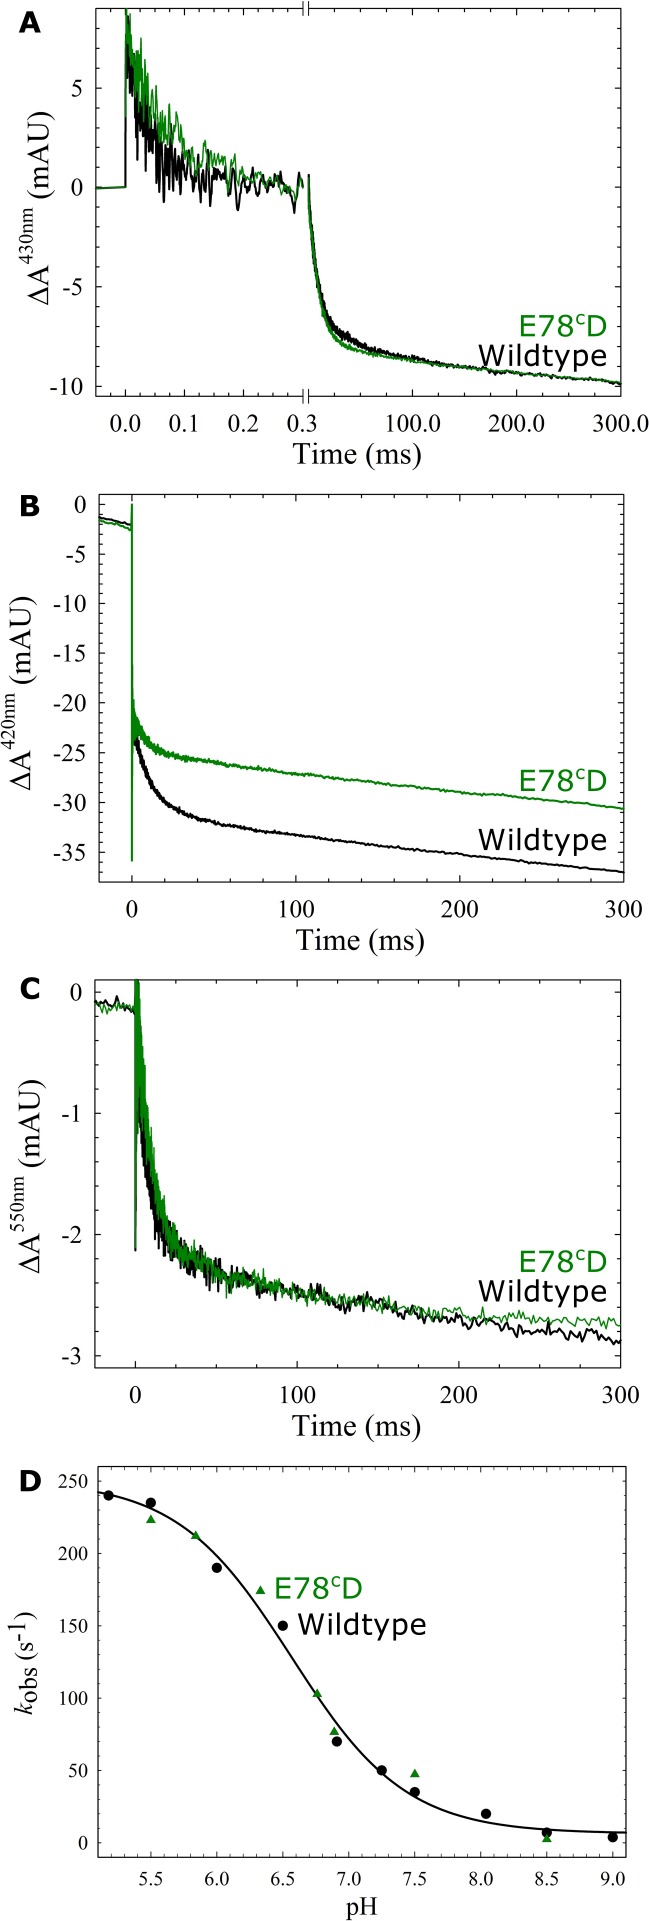
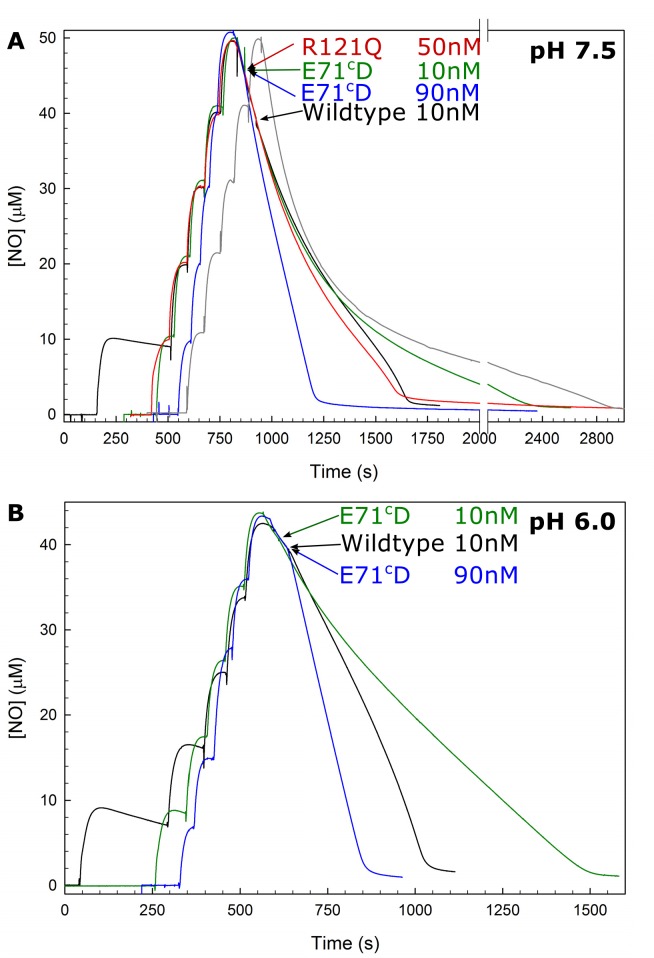
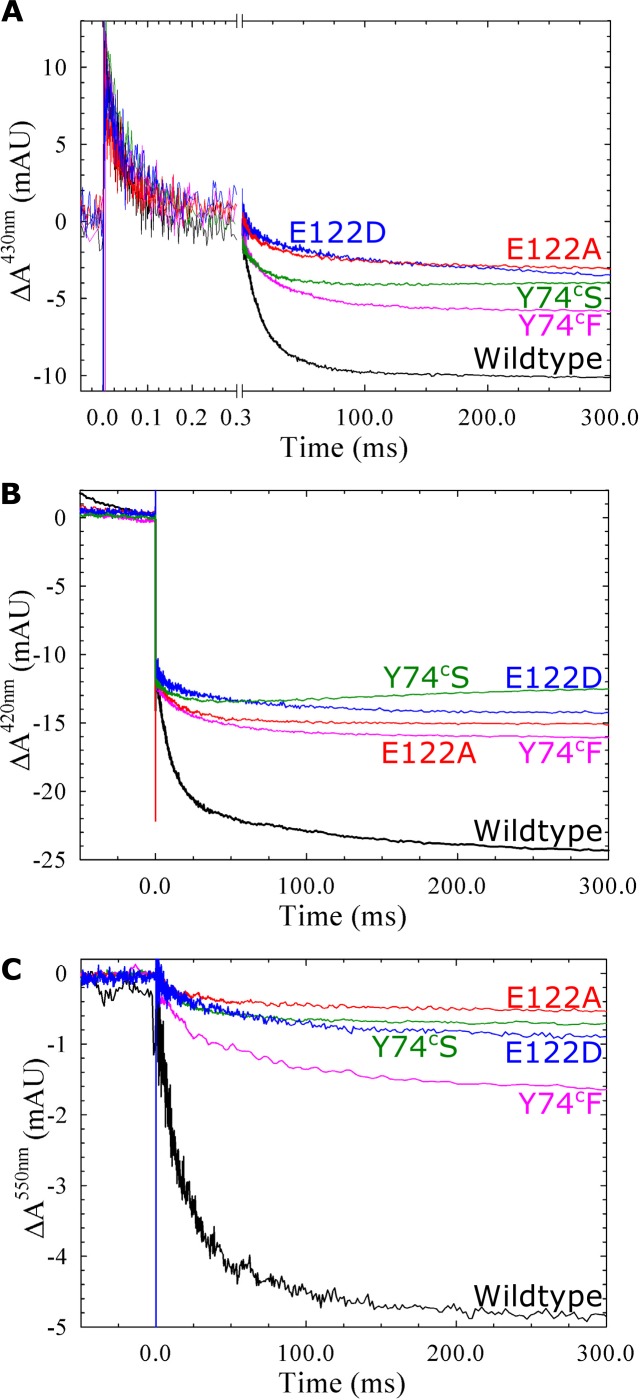
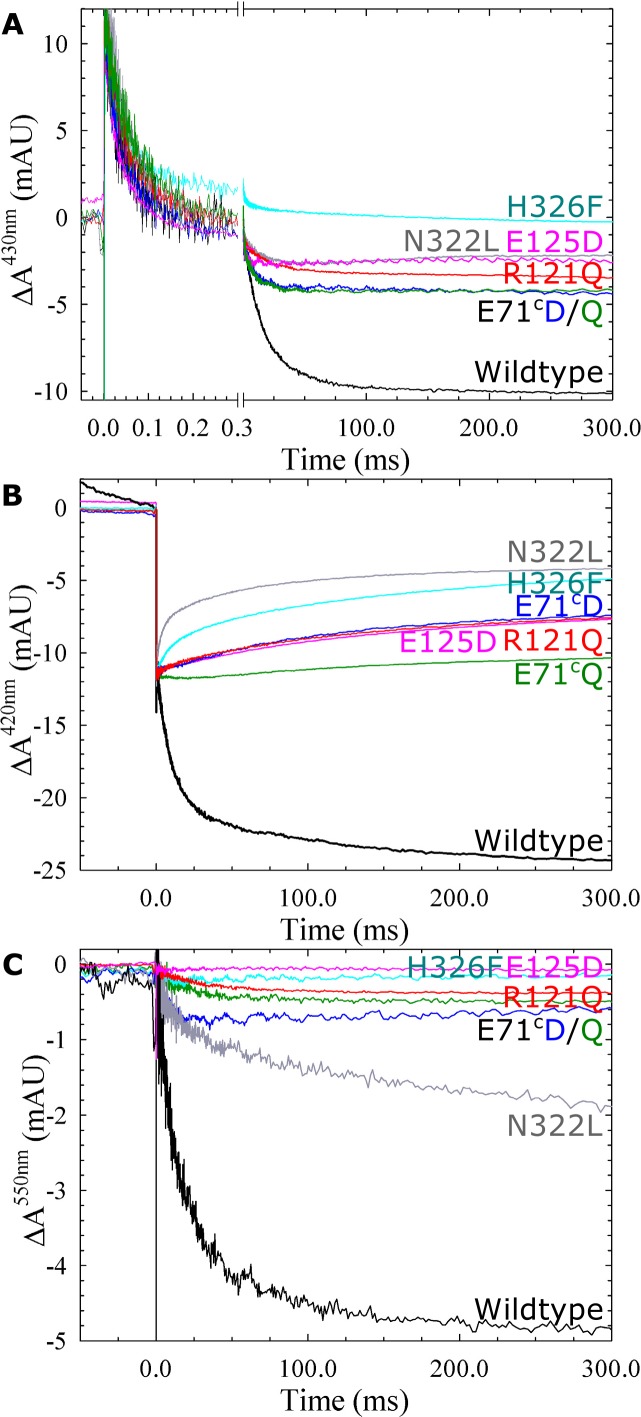
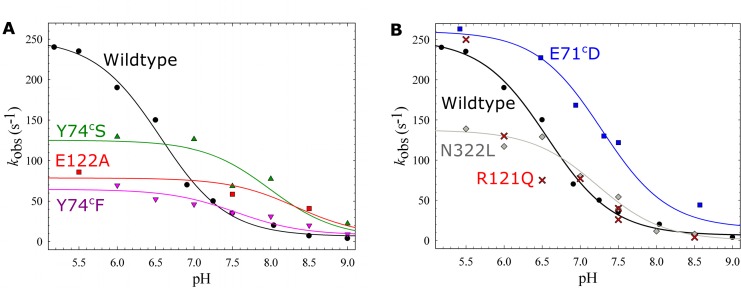
Variant nomenclature: the variants were made in the NorB subunit if not indicated by the superscript c, which are variants in the NorC subunit (e.g. E122A = exchange of Glu-122 in NorB for an Ala, E71cD; exchange of Glu-71 in NorC for an Asp). Bacterial NO reductases (NORs) are integral membrane proteins from the heme-copper oxidase superfamily. Most heme-copper oxidases are proton-pumping enzymes that reduce O2 as the last step in the respiratory chain. With electrons from cytochrome c, NO reductase (cNOR) from Paracoccus (P.) denitrificans reduces NO to N2O via the following reaction: 2NO+2e-+2H+→N2O+H2O. Although this reaction is as exergonic as O2-reduction, cNOR does not contribute to the electrochemical gradient over the membrane. This means that cNOR does not pump protons and that the protons needed for the reaction are taken from the periplasmic side of the membrane (since the electrons are donated from this side). We previously showed that the P. denitrificans cNOR uses a single defined proton pathway with residues Glu-58 and Lys-54 from the NorC subunit at the entrance. Here we further strengthened the evidence in support of this pathway. Our further aim was to define the continuation of the pathway and the immediate proton donor for the active site. To this end, we investigated the region around the calcium-binding site and both propionates of heme b3 by site directed mutagenesis. Changing single amino acids in these areas often had severe effects on cNOR function, with many variants having a perturbed active site, making detailed analysis of proton transfer properties difficult. Our data does however indicate that the calcium ligation sphere and the region around the heme b3 propionates are important for proton transfer and presumably contain the proton donor. The possible evolutionary link between the area for the immediate donor in cNOR and the proton loading site (PLS) for pumped protons in oxygen-reducing heme-copper oxidases is discussed.


Conflict of interest statement

Competing Interests: The authors have declared that no competing interests exist.

Figures

Fig 1
Fig 1. cNOR structure with the suggested proton pathway and the investigated residues.
Structure of cNOR from Ps. aeruginosa (Proton Data Bank code 3O0R [5]). The NorB (light grey) and NorC (dark grey) subunits are shown in surface and cartoon representation on the left. Hemes and side-chains of the discussed residues are shown in stick representation. All Fe3+ and Ca2+ ions are shown as spheres. The residues of proton pathway 1 are shown in cyan, the investigated residues of pathway 2 are shown in pink. The residues that are predicted to lead the proton to the active site are shown in dark green. Small red spheres indicate crystallographic waters within 3.5 Å of the shown residues, heme propionates and metal sites. The A and D-propionate of the b3 heme are also indicated. Blue (dotted) lines indicate the suggested proton pathway.
Fig 2
Fig 2. The reaction between fully reduced cNOR and O2, showing the effect of changing the glutamate at the entrance of pathway 1.
Fully reduced cNOR wildtype (black), E58cD (green) or E58cQ (blue) reacting with oxygen at pH 7.5. Traces show the absorbance change of cNOR as a function of time (with the laser flash dissociating CO at t = 0) at 430 nm (A), 420 nm (B) and 550 nm (C, reporting on the heme c). For clarity, the laser artefact at t = 0 has been truncated. At 420 nm and 430 nm the traces were normalized to the ΔACO,off step (variations occur in the amplitude of the ETPT, as observed before [7]). At 550 nm, the amplitudes at t = 1s were normalized to the same value in order to emphasize the changes in rate constants (the amplitude of E58cD was ~80% of wildtype). The data from wildtype and E58cQ are added for comparison from Ref. [7]. Experimental conditions: ~1 μM cNOR in 50 mM HEPES, pH 7.5, 50 mM KCl, and 0.05% (w/v) DDM, [O2] = 1 mM, T = 295K.
Fig 3
Fig 3. pH dependence of the proton-coupled electron transfer (ETPT) in the reaction between O2 and fully reduced cNOR variants at the entrance of proton transfer pathway 1.
The rate constants of the ETPT plotted as a function of pH: wild type (black circles), K54cA (red squares), E58cQ (blue triangles down), E58cD (green triangles up). The data from E58cQ, K54cA and wildtype are from Ref. [7,8] (added for comparison). The data for wildtype was fitted to a pKa ~6.6 and a kmax (maximal rate at low pH) of ~250 s-1 (black line). The data for E58cQ was fitted to a pKa of ~5.8 and a kmax of ~50 s-1 (blue line, data and fit from from Ref. [7]). The data for K54cA was fitted to a pKa of ~6.4 and a kmax of ~250 s-1 (red line, data and fit from Ref. [7]) and for E58cD to a pKa of ~6.4 and a kmax of ~250 s-1 (green line). Note that data points for K54cA as well as the E58cD do not follow the fit around pH 7–7.5, and also plotted (see text) are two theoretical diffusion rate constants (kdiff*[H+]) as a function of pH (= -log[H+]), assuming a kdiff of 2.5*108 M-1 s-1 in K54cA (red dashed line) and 3.5*108 M-1 s-1 in E58cD(green dashed line).
Fig 4
Fig 4. The reaction between fully reduced wildtype (black) or E78cD (green) cNOR and oxygen.
Traces show the absorbance change of cNOR in time (with the laser flash at t = 0) at 430 nm (A), 420 nm (B) and 550 nm (C) at pH 7.5. Normalization as in Fig 2. The laser artefact at t = 0 is truncated for clarity. D) Rate constants of the proton-coupled electron transfer (ETPT) are shown as a function of pH. Rate constants for the E78cD variant are shown as green triangles. Wildtype rate constants (black circles) and fit (black line) are from Ref. [7,8]. A-C) Experimental conditions as in Fig 2.
Fig 5
Fig 5. Multiple turnover activity of cNOR variant E71cD with NO is not sigmoidal.
The NO reduction by the E71cD variant is shown at two concentrations: 10 nM (green line) and 90 nM (blue line) at pH 7.5 (A), and at pH 6.0 (B). For comparison data for 10 nM wildtype (black line), 50 nM R121Q (red line, only in A), and background consumption (no enzyme added, grey line in A) is also shown. R121Q has a lower multiple turnover activity, but is still sigmoidal. Experimental conditions: T = 295K, NO-saturated water (2 mM NO) was added in five steps of 5 μl (10 μM/addition) to a deoxygenated solution of 50 mM HEPES, pH 7.5, 50 mM KCl, 0.05% (w/v) DDM, 30 mM glucose, 20 units/ml catalase, 1 unit/ml glucose oxidase, 500 μM TMPD, and 20 μM horse heart cytochrome c. Then 3 mM ascorbate was added (giving some background NO reduction), followed by cNOR addition (as indicated by arrow and label). Note that the background trace shown in A was recorded at 303K, whereas the traces with cNOR were recorded at 295K, which explains the high background consumption at high [NO].
Fig 6
Fig 6. Reaction between oxygen and fully reduced cNOR wildtype or variants of calcium ligands E122 and Y74c.
Traces show the absorbance change of cNOR in time (with the laser flash at t = 0, which gives a short artefact) at 430 nm (A), 420 nm (B) and 550 nm (C, reporting on the heme c). At 420 nm and 430 nm the traces were normalized to the ΔA(COoff), at 550 nm the traces were normalized as at 420 nm. Experimental conditions as in Fig 2.
Fig 7
Fig 7. Reaction between fully reduced cNOR wildtype and variants with oxygen.
The variants have changes around the calcium site (R121Q, E125D, E71cQ, E71cD) or around the D-propionate of heme b3 (N322L and H326F). Traces show the absorbance change of cNOR in time (with the laser flash at t = 0, which gives an artefact) at 430 nm (A), 420 nm (B) and 550 nm (C, reporting on the heme c). Traces normalized as in Fig 6, experimental conditions as in Fig 2.
Fig 8
Fig 8. pH dependence of the ETPT for cNOR variants in and around the Ca2+ binding site and heme propionate region.
A) Variants in the calcium ligands E122 and Y74c compared to wildtype (black circles). Y74cS (green triangles up), Y74cF (pink triangles down), E122A (red squares). Shown are also the fits described in the text: Y74cS (green line, pKa~8.0), Y74cF (pink line, pKa~7.5), E122A (red line, pKa~8.3). B) ETPT rate constants tentatively determined for variants with small amplitudes of ETPT, compared to wildtype (black circles). N322L (grey diamonds) and R121Q (approximate fits shown by red crosses) and E71cD (blue squares). Shown are also the fits described in the text; E71cD (blue line, pKa~7.3), N322L (grey line, pKa~7.2). A,B) The WT data (from [7,8]) was fitted to a pKa of ~6.6 (black line).

Similar articles

Cited by

References

    1. Hendriks JHM, Jasaitis A, Saraste M, Verkhovsky MI. Proton and Electron Pathways in the Bacterial Nitric Oxide Reductase. Biochemistry. 2002;41: 2331–2340. 10.1021/bi0121050 - DOI - PubMed
    1. Reimann J, Flock U, Lepp H, Honigmann A, Ädelroth P. A pathway for protons in nitric oxide reductase from Paracoccus denitrificans. Biochimica et Biophysica Acta (BBA)—Bioenergetics. 2007;1767: 362–373. 10.1016/j.bbabio.2007.03.006 - DOI - PubMed
    1. Thorndycroft FH, Butland G, Richardson DJ, Watmough NJ. A new assay for nitric oxide reductase reveals two conserved glutamate residues form the entrance to a proton-conducting channel in the bacterial enzyme. Biochem J. 2007;401: 111–119. 10.1042/BJ20060856 - DOI - PMC - PubMed
    1. Wraight CA. Chance and design—Proton transfer in water, channels and bioenergetic proteins. Biochimica et Biophysica Acta (BBA)—Bioenergetics. 2006;1757: 886–912. 10.1016/j.bbabio.2006.06.017 - DOI - PubMed
    1. Hino T, Matsumoto Y, Nagano S, Sugimoto H, Fukumori Y, Murata T, et al. Structural Basis of Biological N2O Generation by Bacterial Nitric Oxide Reductase. Science. 2010;330: 1666–1670. 10.1126/science.1195591 - DOI - PubMed

Publication types

MeSH terms

LinkOut - more resources