

Temporal Patterns of Influenza A and B in Tropical and Temperate Countries: What Are the Lessons for Influenza Vaccination?
- PMID: 27031105
- PMCID: PMC4816507
- DOI: 10.1371/journal.pone.0152310
Temporal Patterns of Influenza A and B in Tropical and Temperate Countries: What Are the Lessons for Influenza Vaccination?
Erratum in
-
Correction: Temporal Patterns of Influenza A and B in Tropical and Temperate Countries: What Are the Lessons for Influenza Vaccination?PLoS One. 2016 May 2;11(5):e0155089. doi: 10.1371/journal.pone.0155089. eCollection 2016. PLoS One. 2016. PMID: 27135748 Free PMC article.
Abstract
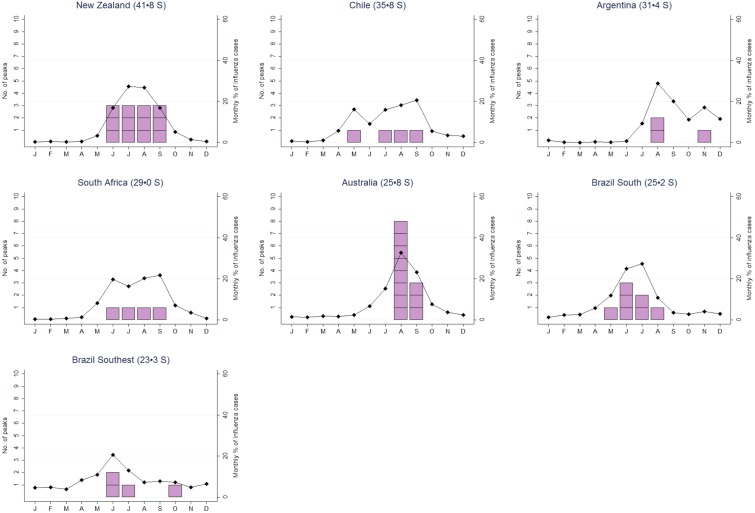
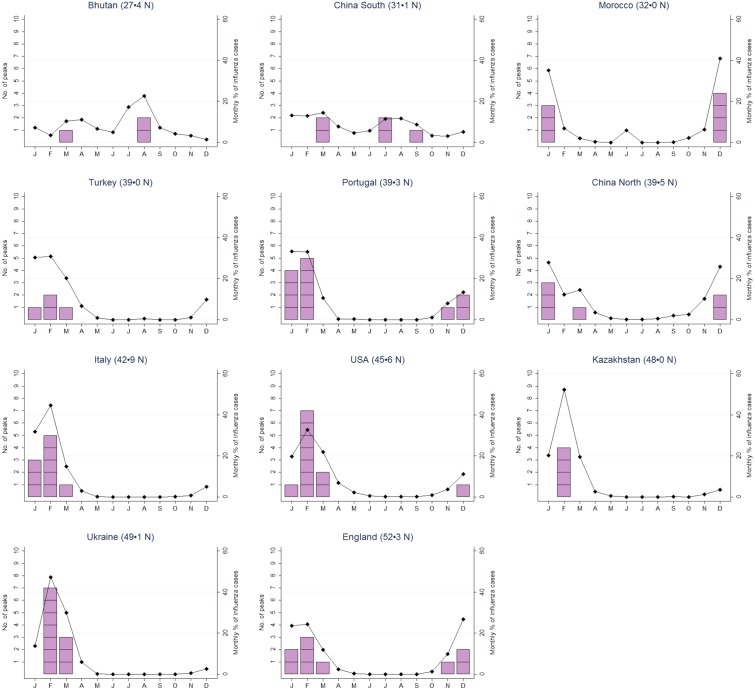
Introduction: Determining the optimal time to vaccinate is important for influenza vaccination programmes. Here, we assessed the temporal characteristics of influenza epidemics in the Northern and Southern hemispheres and in the tropics, and discuss their implications for vaccination programmes.
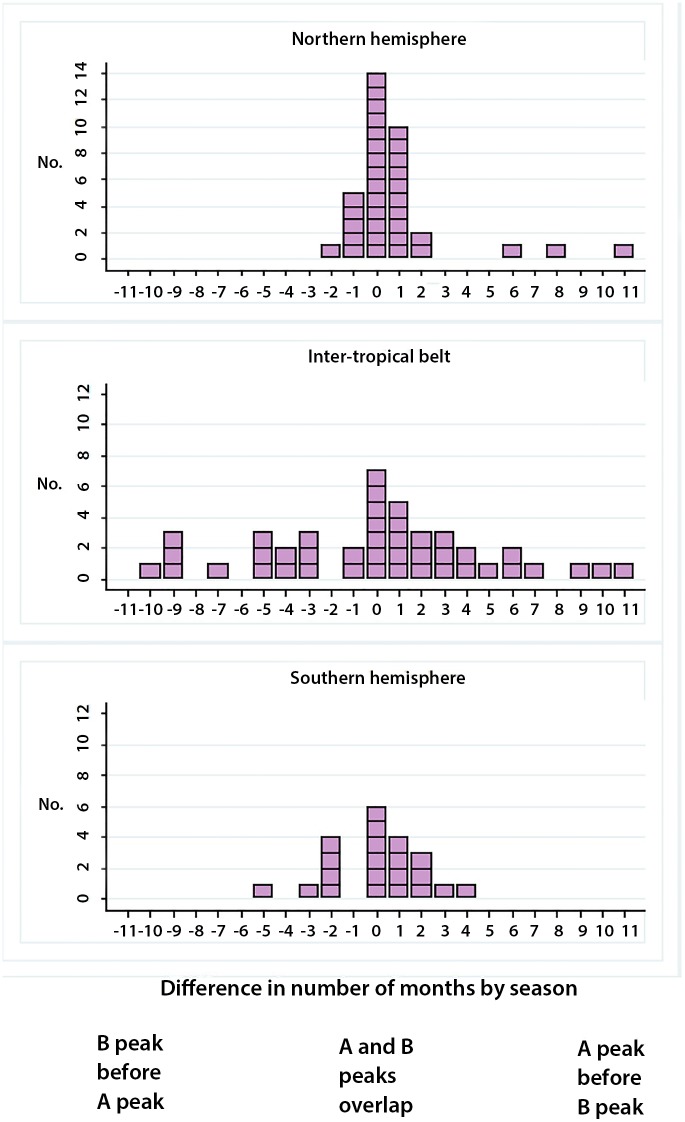
Methods: This was a retrospective analysis of surveillance data between 2000 and 2014 from the Global Influenza B Study database. The seasonal peak of influenza was defined as the week with the most reported cases (overall, A, and B) in the season. The duration of seasonal activity was assessed using the maximum proportion of influenza cases during three consecutive months and the minimum number of months with ≥80% of cases in the season. We also assessed whether co-circulation of A and B virus types affected the duration of influenza epidemics.
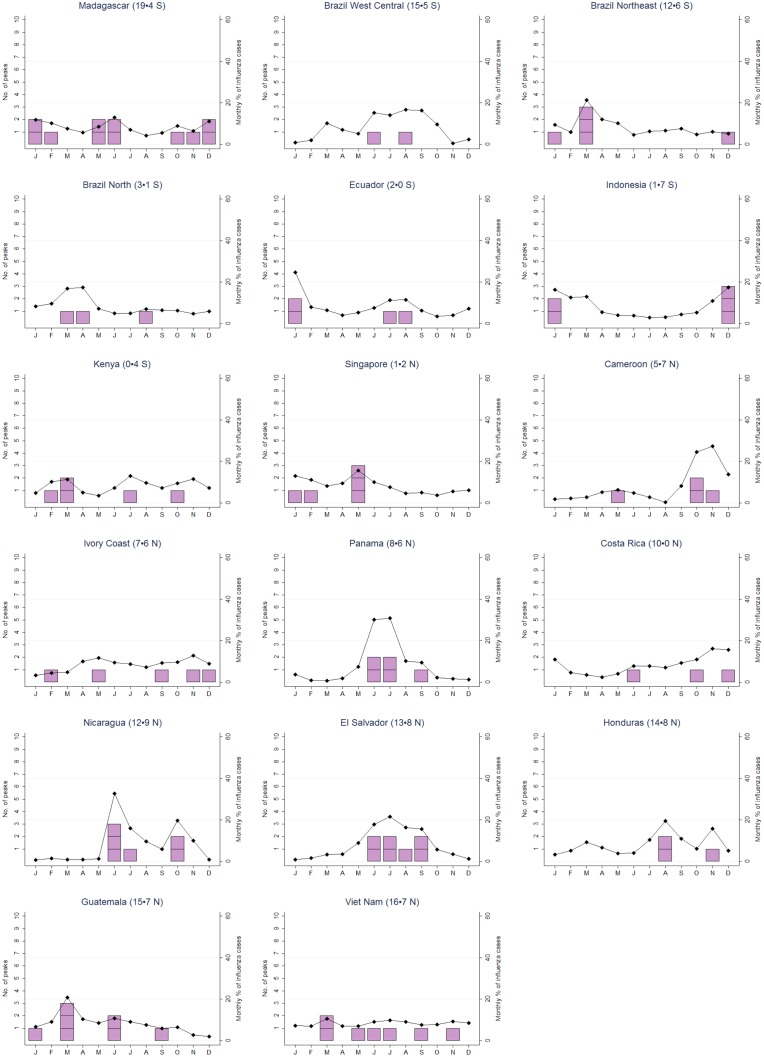
Results: 212 influenza seasons and 571,907 cases were included from 30 countries. In tropical countries, the seasonal influenza activity lasted longer and the peaks of influenza A and B coincided less frequently than in temperate countries. Temporal characteristics of influenza epidemics were heterogeneous in the tropics, with distinct seasonal epidemics observed only in some countries. Seasons with co-circulation of influenza A and B were longer than influenza A seasons, especially in the tropics.
Discussion: Our findings show that influenza seasonality is less well defined in the tropics than in temperate regions. This has important implications for vaccination programmes in these countries. High-quality influenza surveillance systems are needed in the tropics to enable decisions about when to vaccinate.
Conflict of interest statement
Figures
References
-
- The Acute Respiratory Infections Atlas. First Edition. Available: http://www.ariatlas.org/understanding_aris/influenza.
Publication types
MeSH terms
Grants and funding
LinkOut - more resources
Full Text Sources
Other Literature Sources
Medical
