

Prediction of Dengue Outbreaks Based on Disease Surveillance and Meteorological Data
- PMID: 27031524
- PMCID: PMC4816319
- DOI: 10.1371/journal.pone.0152688
Prediction of Dengue Outbreaks Based on Disease Surveillance and Meteorological Data
Abstract
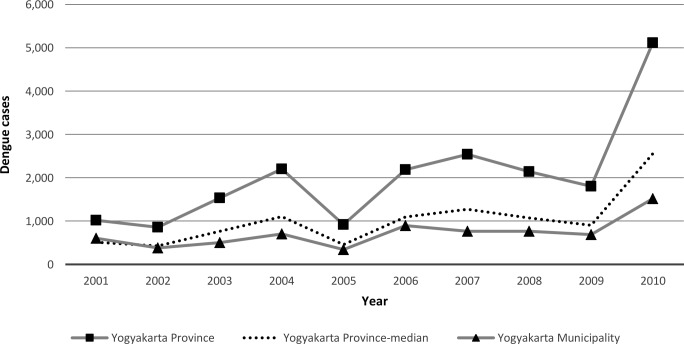
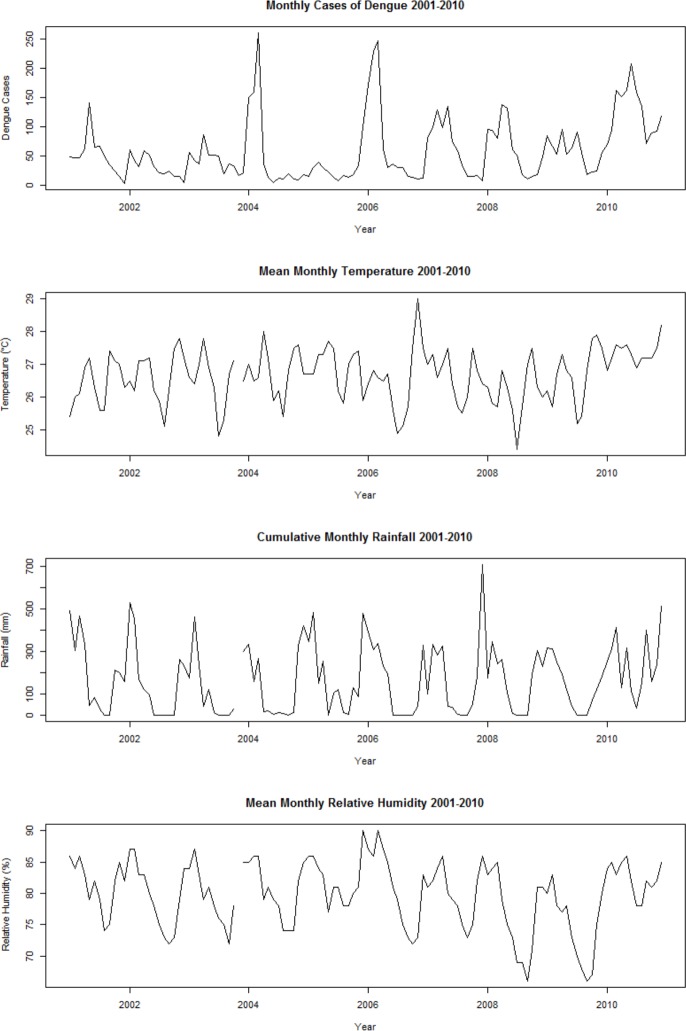
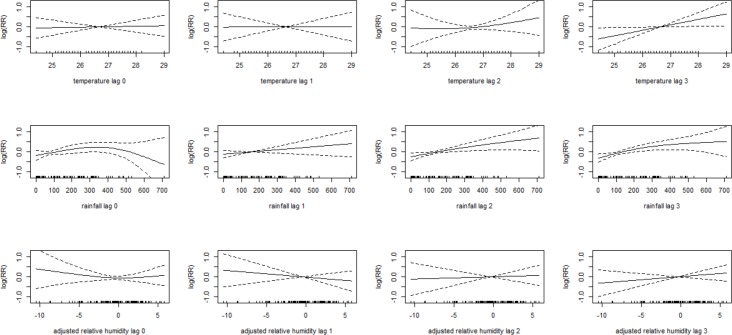
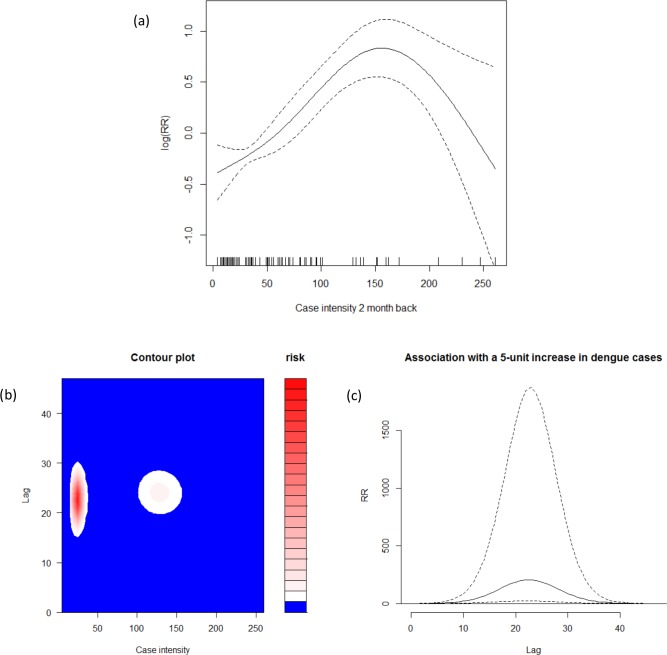
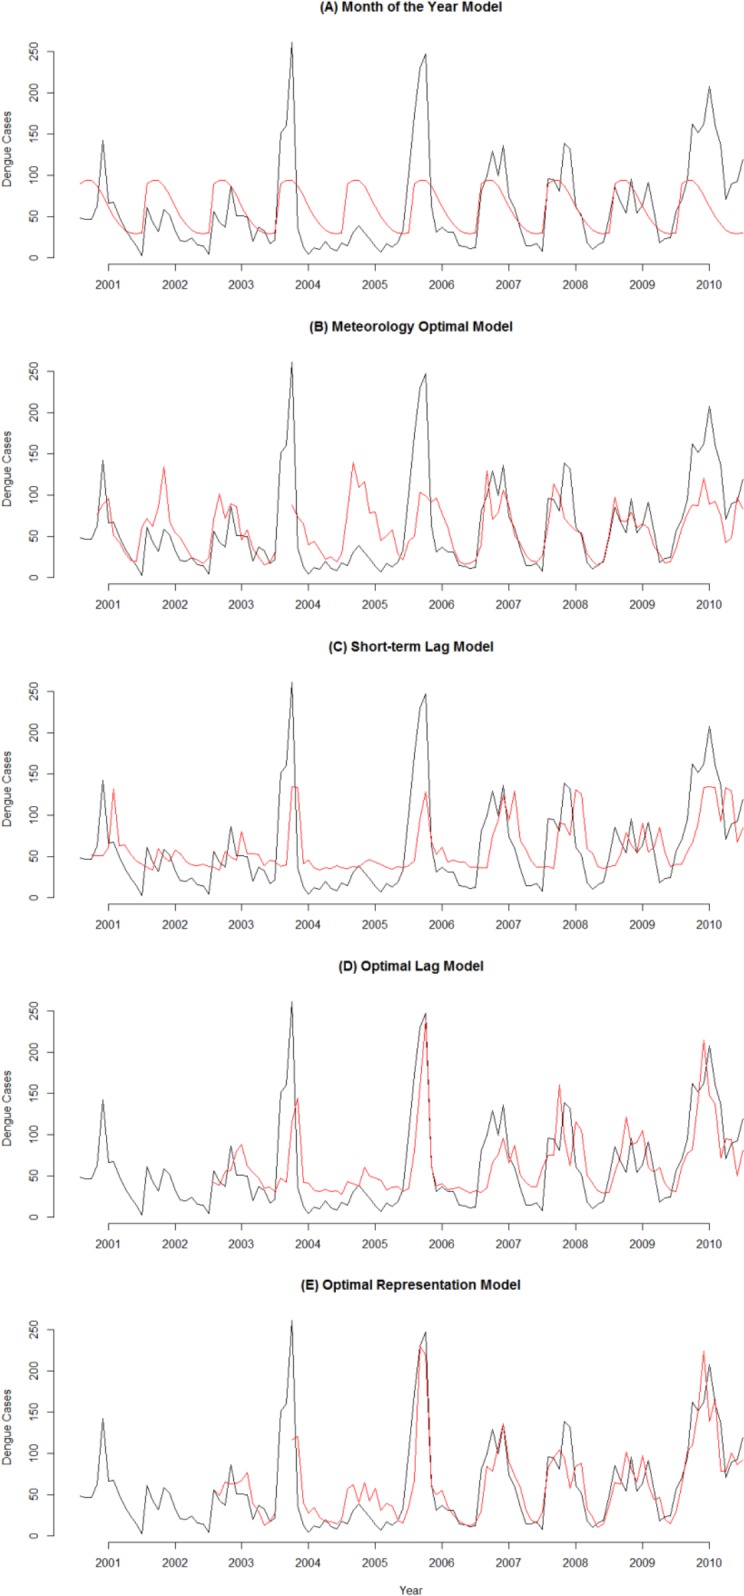
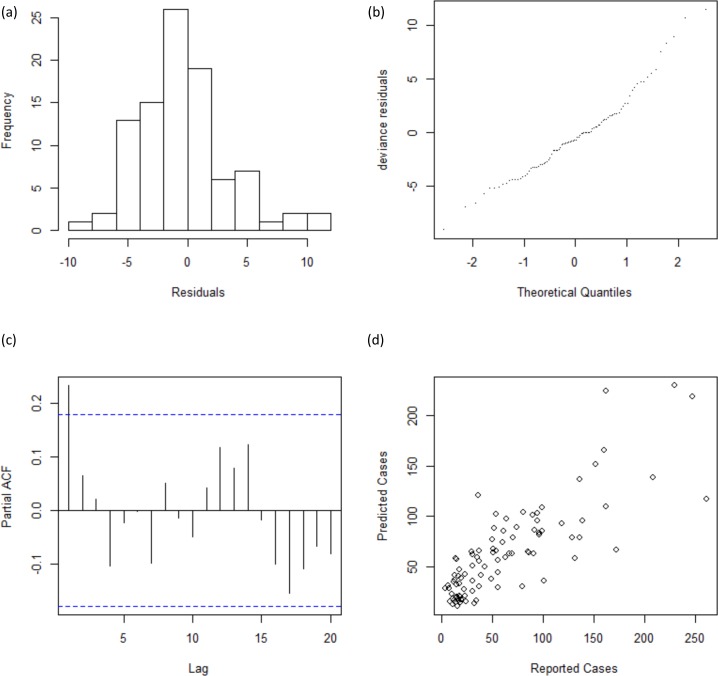
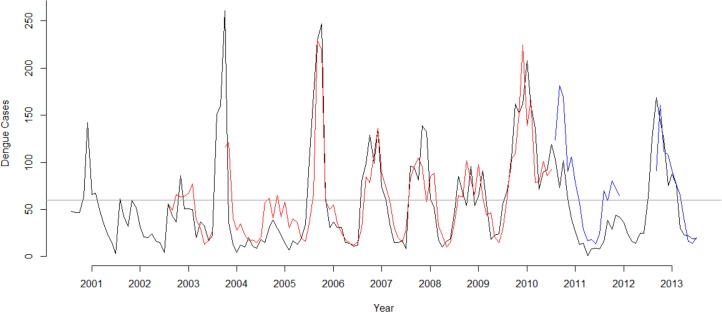
Research is needed to create early warnings of dengue outbreaks to inform stakeholders and control the disease. This analysis composes of a comparative set of prediction models including only meteorological variables; only lag variables of disease surveillance; as well as combinations of meteorological and lag disease surveillance variables. Generalized linear regression models were used to fit relationships between the predictor variables and the dengue surveillance data as outcome variable on the basis of data from 2001 to 2010. Data from 2011 to 2013 were used for external validation purposed of prediction accuracy of the model. Model fit were evaluated based on prediction performance in terms of detecting epidemics, and for number of predicted cases according to RMSE and SRMSE, as well as AIC. An optimal combination of meteorology and autoregressive lag terms of dengue counts in the past were identified best in predicting dengue incidence and the occurrence of dengue epidemics. Past data on disease surveillance, as predictor alone, visually gave reasonably accurate results for outbreak periods, but not for non-outbreaks periods. A combination of surveillance and meteorological data including lag patterns up to a few years in the past showed most predictive of dengue incidence and occurrence in Yogyakarta, Indonesia. The external validation showed poorer results than the internal validation, but still showed skill in detecting outbreaks up to two months ahead. Prior studies support the fact that past meteorology and surveillance data can be predictive of dengue. However, to a less extent has prior research shown how the longer-term past disease incidence data, up to years, can play a role in predicting outbreaks in the coming years, possibly indicating cross-immunity status of the population.
Conflict of interest statement
Figures
References
-
- World Health Organization. World health statistics 2013 [Internet]. Geneva: World Health Organization; 2013. [cited 2015 Jan 1]. Available from: http://www.who.int/gho/publications/world_health_statistics/2013/en/
-
- Azad S, Lio P. Emerging trends of malaria-dengue geographical coupling in the Southeast Asia region. J Vector Borne Dis. 2014;51(3):165–71. - PubMed
Publication types
MeSH terms
LinkOut - more resources
Full Text Sources
Other Literature Sources
Medical
Miscellaneous
