Review
. 2016 Nov;48(11):2320-2334.
doi: 10.1249/MSS.0000000000000939.

Critical Power: An Important Fatigue Threshold in Exercise Physiology

Affiliations
Review

Critical Power: An Important Fatigue Threshold in Exercise Physiology

David C Poole et al. Med Sci Sports Exerc. 2016 Nov.

Abstract

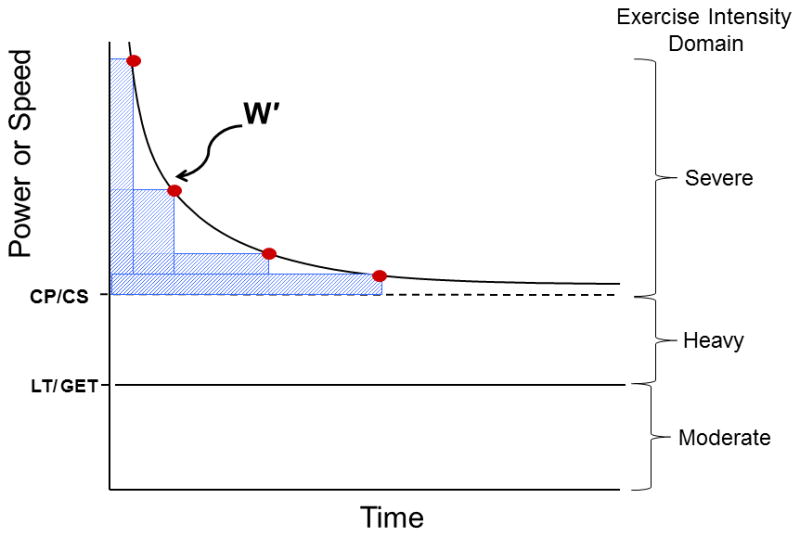
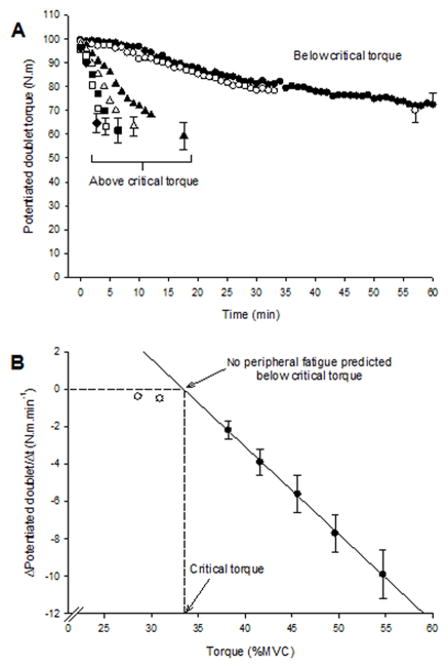
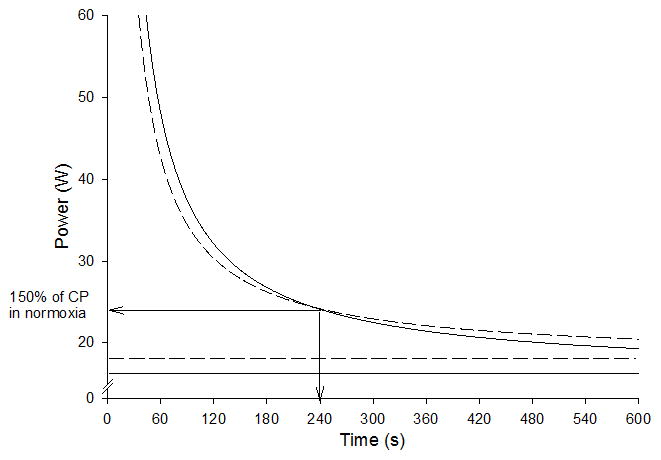
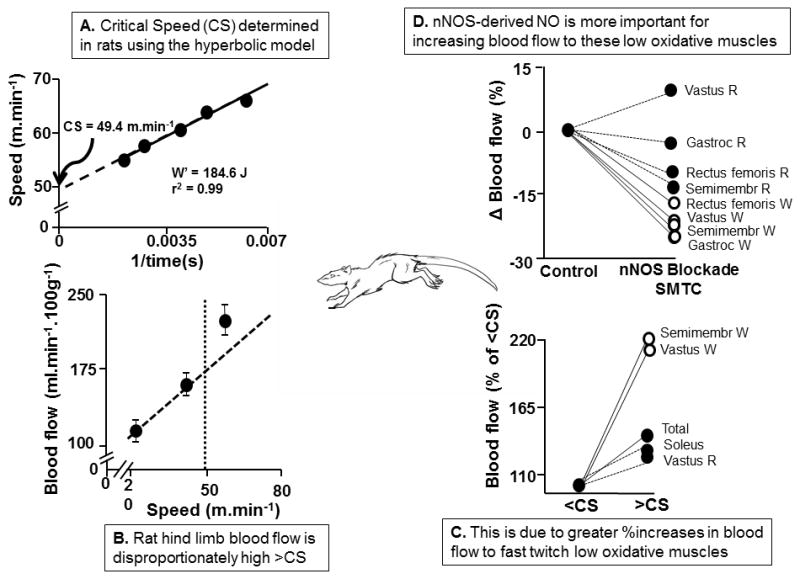
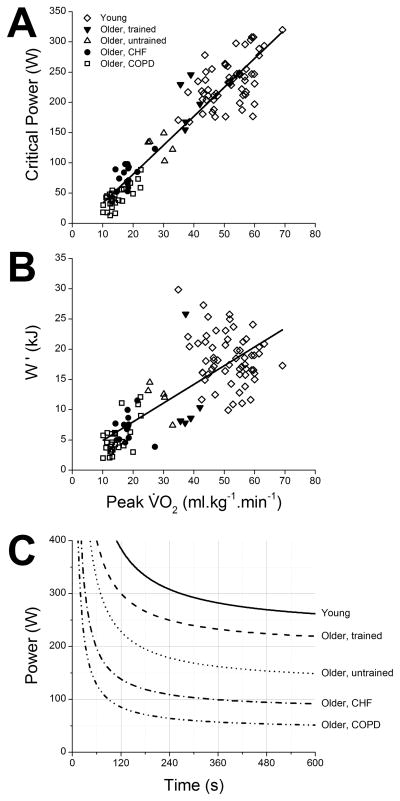
: The hyperbolic form of the power-duration relationship is rigorous and highly conserved across species, forms of exercise, and individual muscles/muscle groups. For modalities such as cycling, the relationship resolves to two parameters, the asymptote for power (critical power [CP]) and the so-called W' (work doable above CP), which together predict the tolerable duration of exercise above CP. Crucially, the CP concept integrates sentinel physiological profiles-respiratory, metabolic, and contractile-within a coherent framework that has great scientific and practical utility. Rather than calibrating equivalent exercise intensities relative to metabolically distant parameters such as the lactate threshold or V˙O2max, setting the exercise intensity relative to CP unifies the profile of systemic and intramuscular responses and, if greater than CP, predicts the tolerable duration of exercise until W' is expended, V˙O2max is attained, and intolerance is manifested. CP may be regarded as a "fatigue threshold" in the sense that it separates exercise intensity domains within which the physiological responses to exercise can (<CP) or cannot (>CP) be stabilized. The CP concept therefore enables important insights into 1) the principal loci of fatigue development (central vs. peripheral) at different intensities of exercise and 2) mechanisms of cardiovascular and metabolic control and their modulation by factors such as O2 delivery. Practically, the CP concept has great potential application in optimizing athletic training programs and performance as well as improving the life quality for individuals enduring chronic disease.


Figures

Figure 1
Figure 1
The hyperbolic Power/Speed-duration curve that defines the limit of tolerance for whole body exercise such as cycling or running as well as individual muscle, joint or muscle group exercise. The curve is constructed by the subject exercising at constant power or speed to the point of exhaustion (points 1–4). Typically these bouts are performed on different days and result in exhaustion within 2–15 min. This hyperbolic relationship is highly conserved across the realm of human physical activities and exercise modes and also across the animal kingdom and is defined by two parameters: the asymptote for power (Critical Power, CP, or speed, Critical Speed, CS, and their metabolic equivalent, O2) and the curvature constant W′ (denoted by the rectangular boxes above CP and expressed in kJ). Note that CP/CS defines the upper boundary of the heavy intensity domain and represents the highest power sustainable without drawing continuously upon W′. Above CP (severe intensity exercise) exhaustion occurs when W′ has been expended. Severe intensity exercise is characterized by a O2 profile that rises continuously to O2max and blood lactate that increases to exhaustion (see text for additional details). LT, lactate threshold, defined usefully during incremental or ramp exercise as the O2 above which blood lactate begins its sustained increase; GET, gas exchange threshold as identified from the non-linearity of the O2/ CO2 relationship.
Figure 2
Figure 2
Peripheral fatigue below and above the critical torque assessed by the potentiated doublet response. Panel A, potentiated doublet responses to exercise performed at 80% (black circles) and 90% (white circles) of the CT, and during 5 tests performed above the CT (triangles, squares and diamonds). Final datum in each test represents the mean (± SEM) doublet response at task end (below CT) or task failure (above CT). Note the decline in the potentiated doublet (i.e., peripheral fatigue) in all trials, but the substantially faster decline above the CT. Panel B, the mean ± SEM rate of change in the potentiated doublet in each test. The black circles represent the tests above the CT, white circles those tests below the CT. The solid line is a best fit linear regression through the above CT data. Backward extrapolation shows that the rate of peripheral fatigue below CT cannot be predicted from measures made above CT, and this extrapolation predicts no peripheral fatigue should occur below ~34% MVC (dashed lines). The CT in this study was 34 ± 2% (reproduced from 18, with permission).
Figure 3
Figure 3
A schematic illustration of the group mean power-duration curves re-drawn on the basis of data from Vanhatalo et al. (100). The solid curve indicates power-duration relationship for knee-extension exercise in normoxia and the dashed curve in hyperoxia (70% O2). The solid horizontal line indicates CP in normoxia and the dashed line indicates CP in hyperoxia. The arrows indicate the cross-over point for the two curves at approximately 150% of CP and 4 min of exercise tolerance.
Figure 4
Figure 4
A. Critical Speed (CS, intercept of relationship) determined in the running rat (W′ is model parameter denoting work capacity achievable above CS). B. Total rat hind limb blood flow measured using radiolabeled microspheres below and above CS. Note non-linear response above CS. C. The increased hind limb blood flow >CS is directed disproportionately to muscles composed predominantly of low oxidative IIb/d/x muscle fibers (semimembranosus white, and white vastus) compared with their oxidative (Type I/IIa, soleus, red vastus) counterparts. D. The selective neuronal nitric oxide synthase (nNOS) blocker S-methylthiocitrulline (SMTC) reveals a highly selective role for nNOS facilitating increased blood flow to low oxidative (Type IIb/d/x) muscles (white rectus femoris, vastus, semimembranosus and gastrocnemius). Redrawn from refs. ,.
Figure 5
Figure 5
The asymptote (critical power, CP; panel A) and curvature constant (W′, panel B) of the power-duration relationship during cycling in young (mean age 23±3 yrs), older trained (65±5 yrs), older untrained (63±3 yrs), chronic heart failure (CHF, 67±7 yrs), and chronic obstructive pulmonary disease (COPD, 62±8 yrs) in relation to aerobic capacity (peak O2). Young and COPD data are from van der Vaart et al. (96). Older and CHF data are from Mezzani et al. (56). Panel C shows differences in the power-duration curves derived from group mean parameters across a wide range of aerobic capacity (10–70 ml.min−1.kg−1)

References

    1. Allen DG, Lamb GD, Westerblad H. Skeletal muscle fatigue: cellular mechanisms. Physiol Rev. 2008;88:287–332. - PubMed
    1. Amann M, Romer LM, Pegelow DF, Jacques AJ, Hess CJ, Dempsey JA. Effects of arterial oxygen content on peripheral locomotor muscle fatigue. J Appl Physiol. 2006;101:119–27. - PubMed
    1. Bailey SJ, Vanhatalo A, DiMenna FJ, Wilkerson DP, Jones AM. Fast-start strategy improves VO2 kinetics and high-intensity exercise performance. Med Sci Sports Exerc. 2011;43:457–467. - PubMed
    1. Bailey SJ, Varnham RL, DiMenna FJ, Breese BC, Wylie LJ, Jones AM. Inorganic nitrate supplementation improves muscle oxygenation, O2 uptake kinetics, and exercise tolerance at high but not low pedal rates. J Appl Physiol. 2015;118:1396–405. - PubMed
    1. Ball-Burnett M, Green HJ, Houston ME. Energy metabolism in human slow and fast twitch fibres during prolonged cycle exercise. J Physiol. 1991;437:257–267. - PMC - PubMed

Publication types

MeSH terms