. 2016 Jun:91:166-181.
doi: 10.1016/j.biomaterials.2016.03.014. Epub 2016 Mar 18.

ECM hydrogel for the treatment of stroke: Characterization of the host cell infiltrate

Affiliations

ECM hydrogel for the treatment of stroke: Characterization of the host cell infiltrate

Harmanvir Ghuman et al. Biomaterials. 2016 Jun.

Abstract

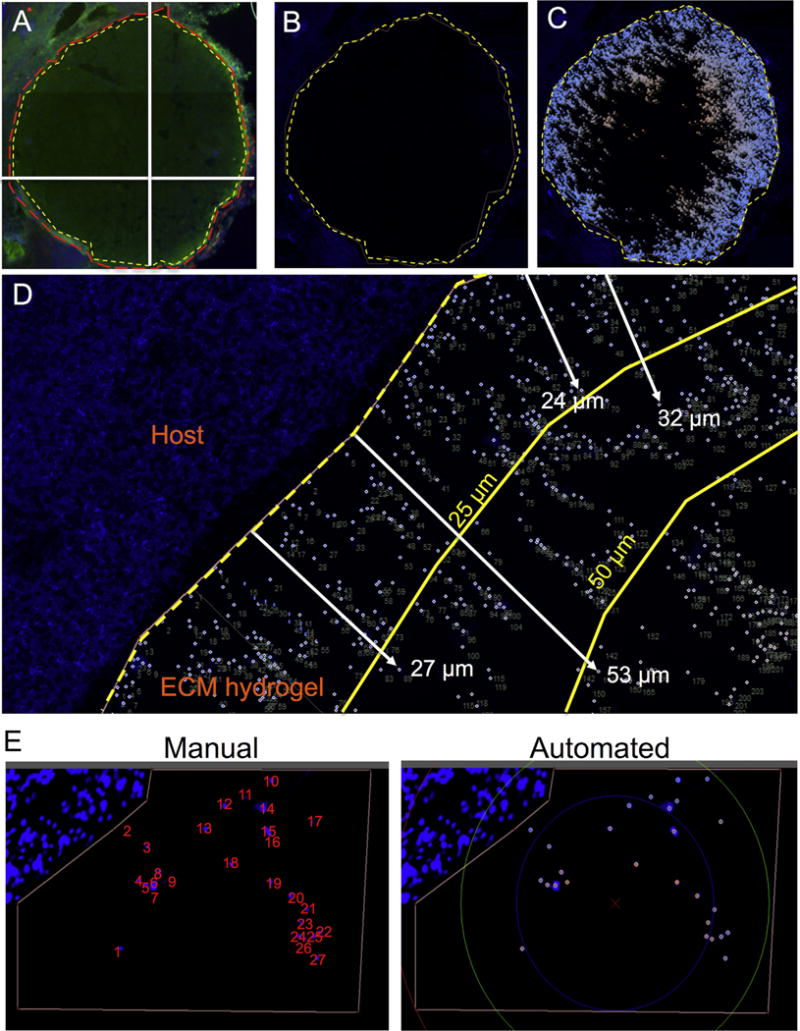
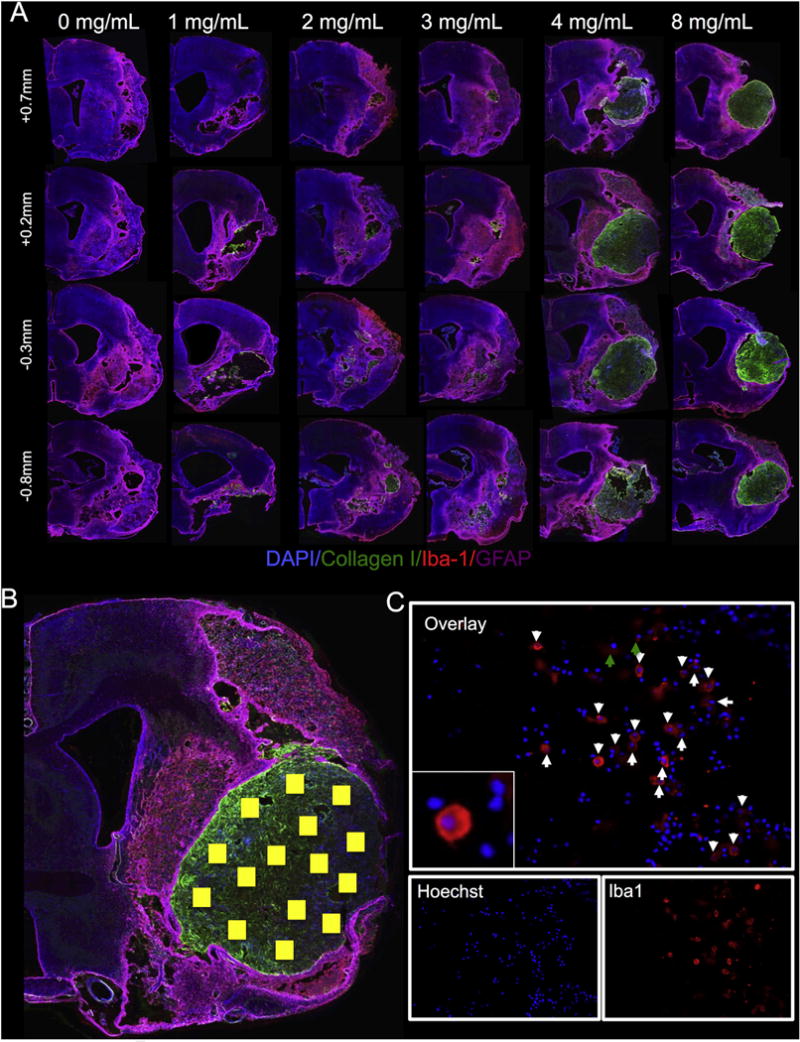
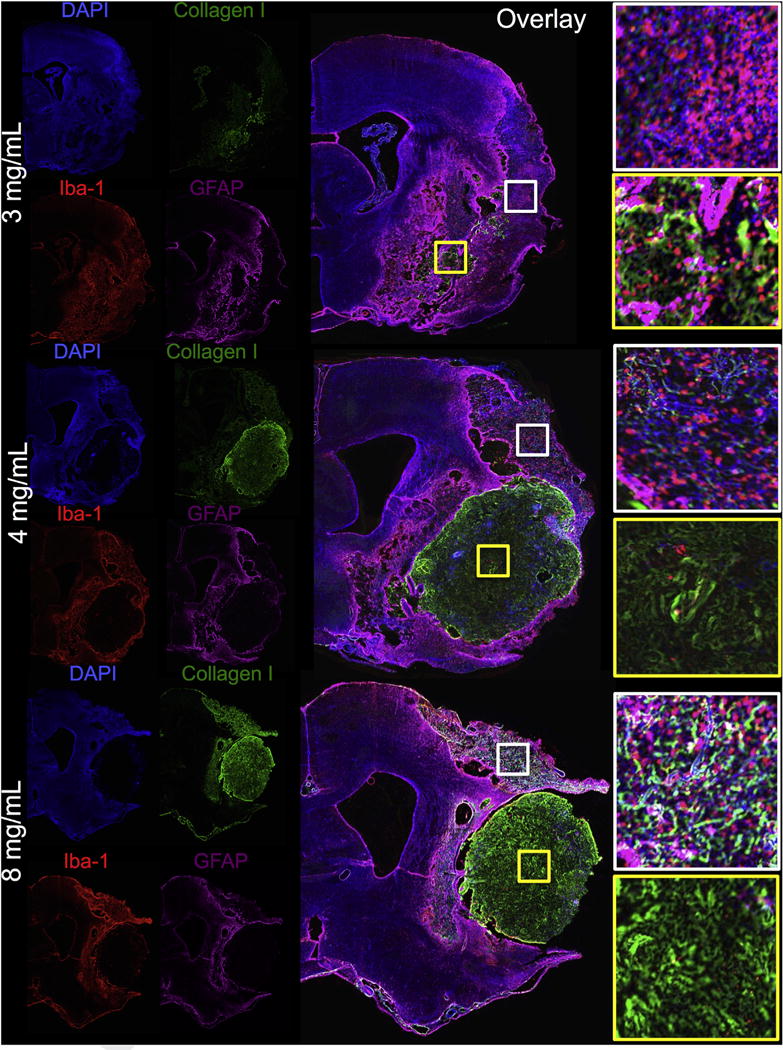
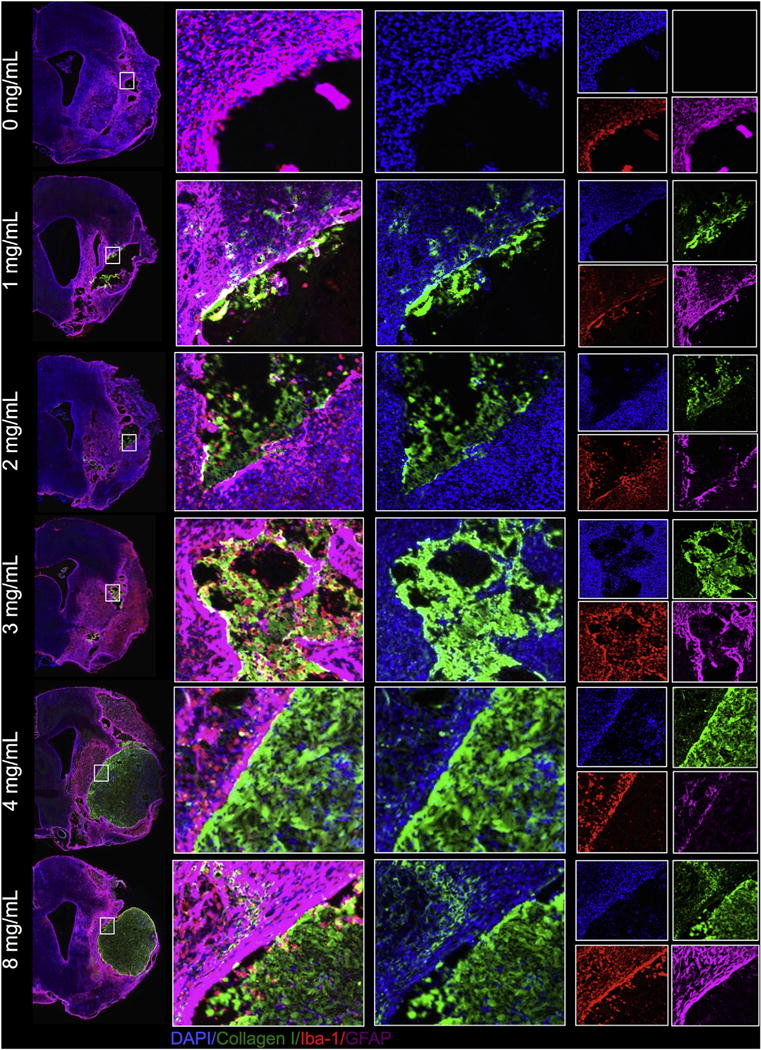
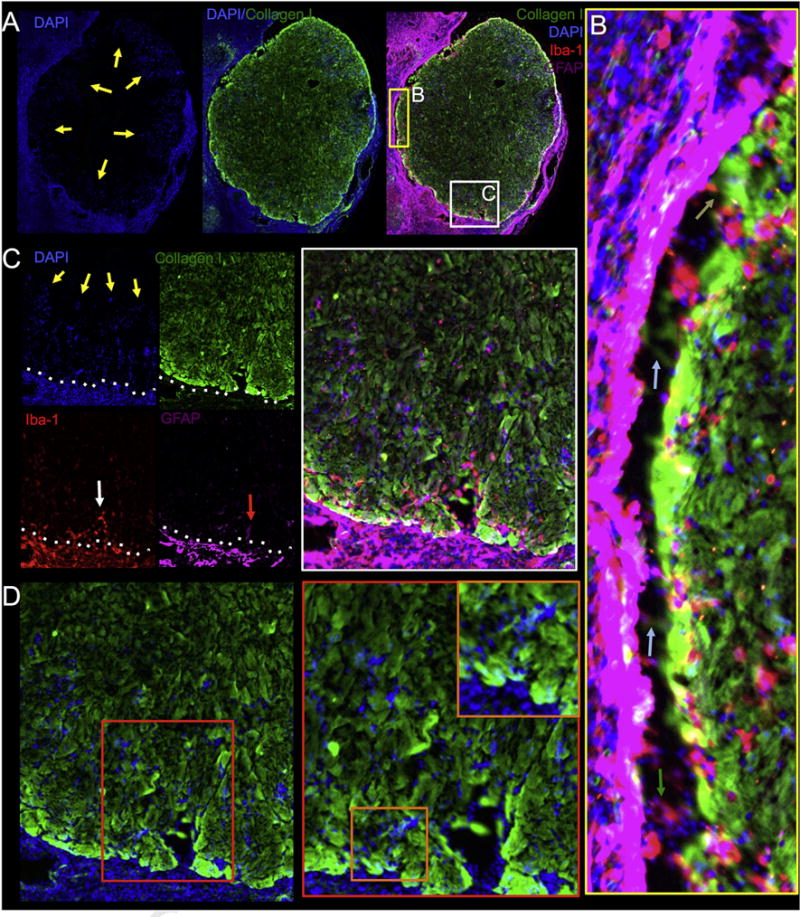
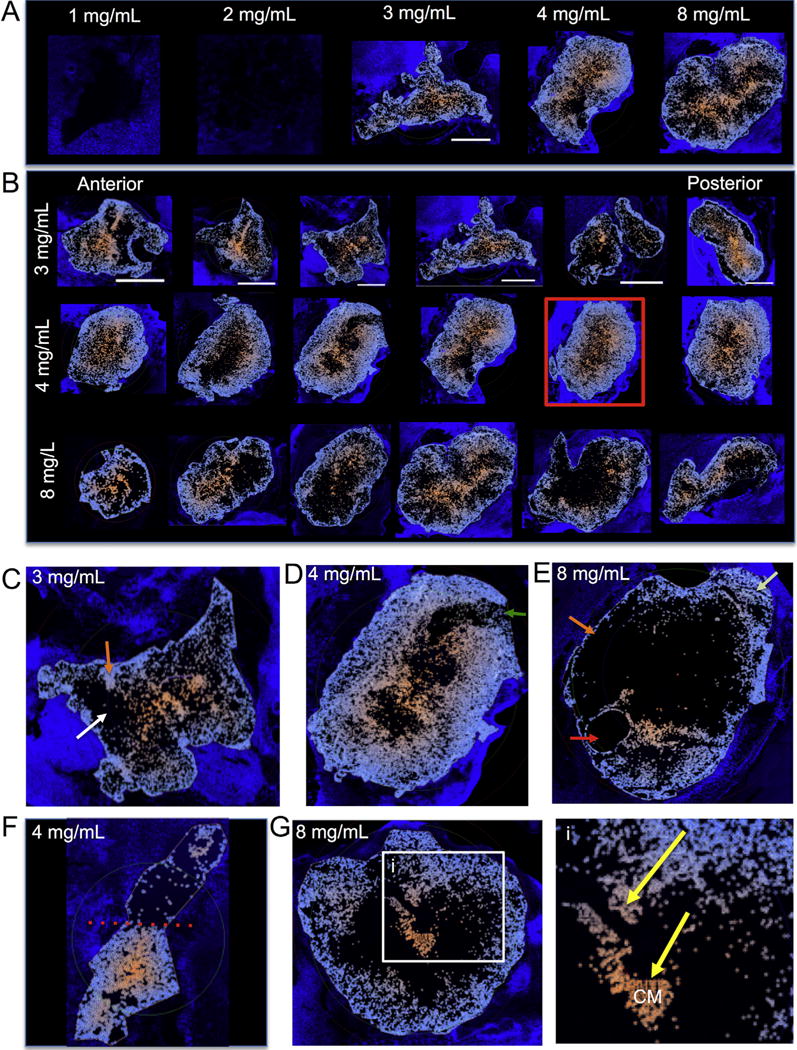
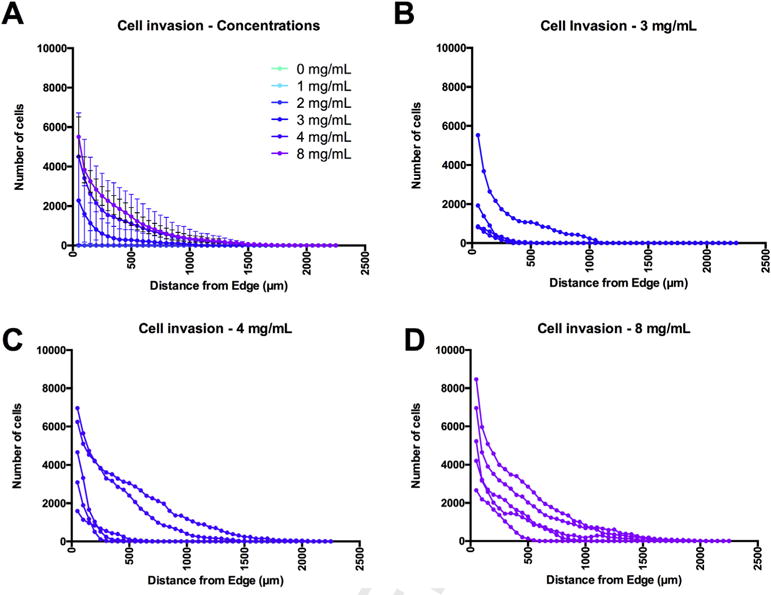
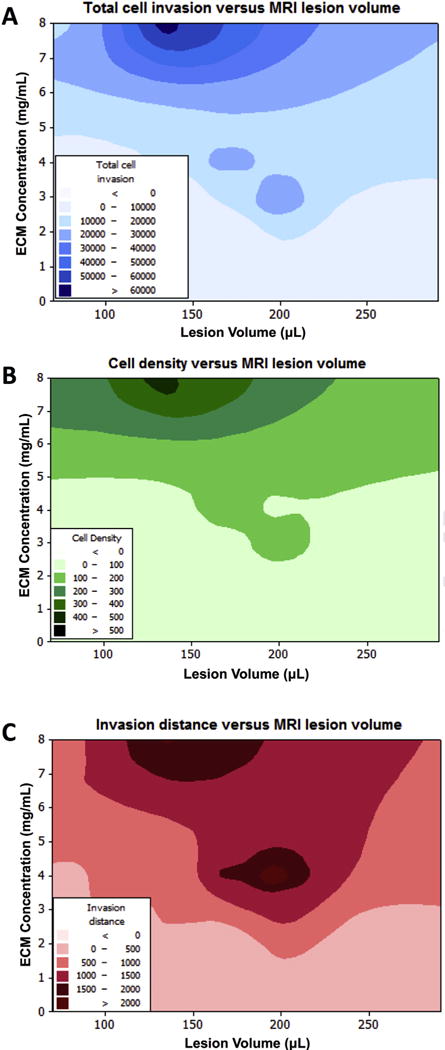
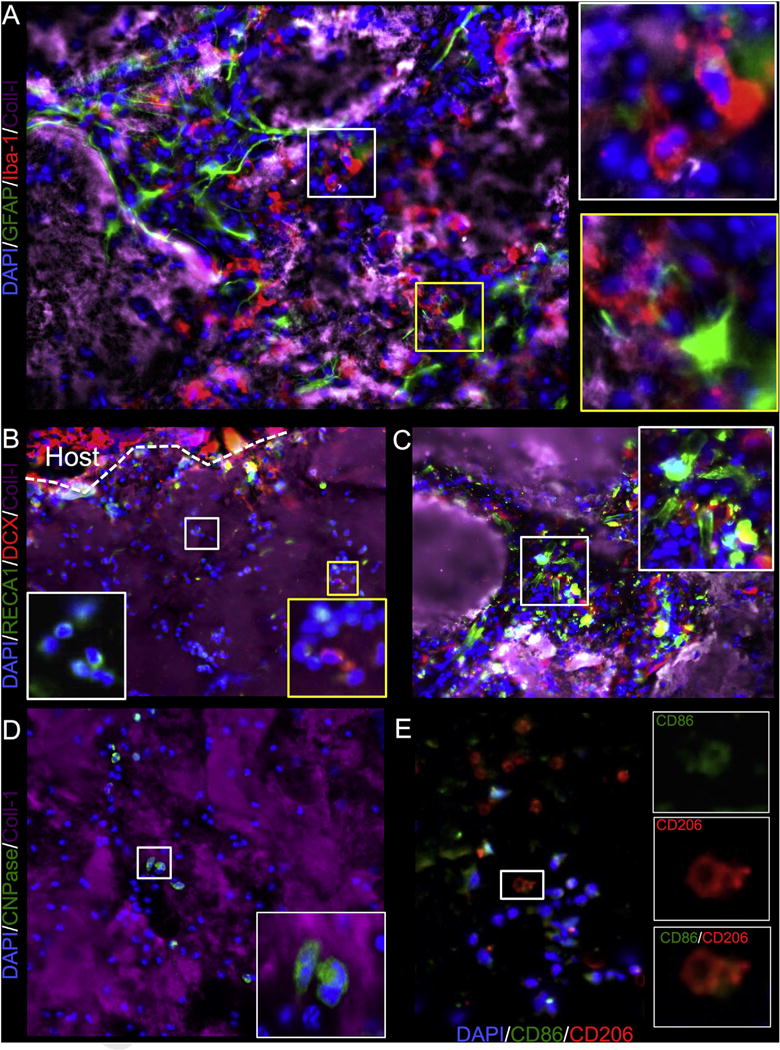
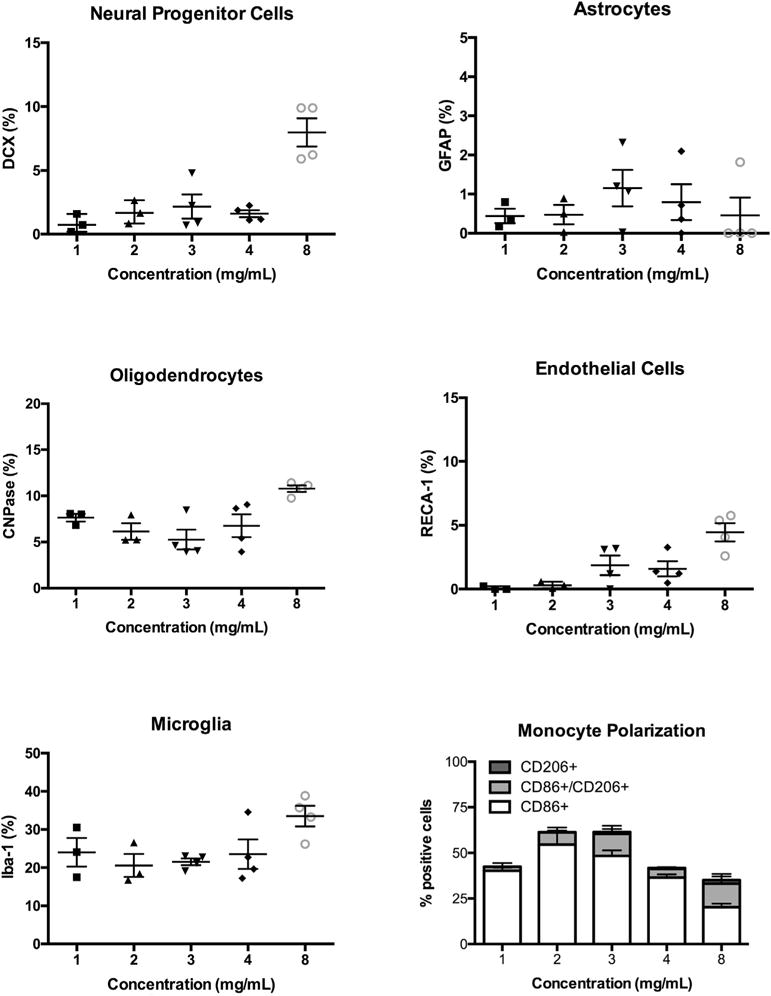
Brain tissue loss following stroke is irreversible with current treatment modalities. The use of an acellular extracellular matrix (ECM), formulated to produce a hydrogel in situ within the cavity formed by a stroke, was investigated as a method to replace necrotic debris and promote the infiltration of host brain cells. Based on magnetic resonance imaging measurements of lesion location and volume, different concentrations of ECM (0, 1, 2, 3, 4, 8 mg/mL) were injected at a volume equal to that of the cavity (14 days post-stroke). Retention of ECM within the cavity occurred at concentrations >3 mg/mL. A significant cell infiltration into the ECM material in the lesion cavity occurred with an average of ∼36,000 cells in the 8 mg/mL concentration within 24 h. An infiltration of cells with distances of >1500 μm into the ECM hydrogel was observed, but the majority of cells were at the tissue/hydrogel boundary. Cells were typically of a microglia, macrophage, or neural and oligodendrocyte progenitor phenotype. At the 8 mg/mL concentration, ∼60% of infiltrating cells were brain-derived phenotypes and 30% being infiltrating peripheral macrophages, polarizing toward an M2-like anti-inflammatory phenotype. These results suggest that an 8 mg/mL ECM concentration promotes a significant acute endogenous repair response that could potentially be exploited to treat stroke.

Keywords: Biomaterial; Brain; Delivery; Extracellular matrix; Hydrogel; Injection; Macrophage; Magnetic resonance imaging; Neural progenitor; Phenotypes; Stereotactic; Stroke.


Conflict of interest statement

Disclosure

The authors have no personal financial or institutional conflict of interest in any of the drugs, materials, or devices described in this article.

Figures

Fig. 1
Fig. 1. Measuring cell infiltration
Overview of the cell infiltration quantification approach using Lux64R and DAPI stained fluorescent images. Using collagen I to stain the ECM biomaterial, the distinction between the lesion boundary and the ECM hydrogel interface is identified (A). Using Lux64R, the lesion boundary is then drawn and defined (B). The cells inside the boundary are then labeled and counted (C). A closer view in a region of interest shows that each cell is accurately identified and labeled, while measuring its distance traveled from the previously defined lesion boundary (D). Manual and automated cell counts using Lux64R shows cells being correctly identified for quantification of cell invasion (E).
Fig. 2
Fig. 2. Concentration-dependent retention of ECM hydrogel in the lesion cavity
(A) Whole hemisphere images show the gelation and retention properties of the injected ECM hydrogel at different concentrations. Since collagen I is more abundant in the ECM contains compared to the host brain tissue, it can be used for histological visualization of the injected material. A vehicle injection (0 mg/mL) of PBS indicated no collagen I detection inside the lesion cavity. At 1 and 2 mg/mL, the ECM material mostly permeated into the brain tissue, whereas at 3 mg/mL, hydrogel formed and was retained in the cavity with some permeation into the host tissue. At concentrations greater than 3 mg/mL, the ECM material shows gelation with little to no signs of permeation into the peri-infarct tissue, retaining both its morphology, as well as its shape. In order to accurately characterize the invading cells, multiple images were acquired inside the ECM material (as shown by the yellow boxes) (B). Once the images were acquired, manual counts of DAPI indicated the total number of cells in the field of view and co-staining with another marker (Iba-1 in this case) would result in characterization of the invading cells (as shown with white arrows) (C). (For interpretation of the references to color in this figure legend, the reader is referred to the web version of this article.)
Fig. 3
Fig. 3. Interface between ECM hydrogel and host tissue
Concentrations >3 mg/mL resulted in an in situ gelation and retention within the lesion cavity producing an interface where the ECM hydrogel contacts with the host brain tissue. It is important to note two typical microenvironments within which ECM material can be found in these stroke-damaged brains: 1. The lesion cavity (yellow boxes); 2. Severely damaged tissue that is not part of the lesion core (white boxes). Higher concentrations of 4 and 8 mg/mL typically completely filled the cavity, but also displaced some damaged tissue. The 3 mg/mL also permeated into damaged tissue directly adjacent to the cavity. In areas of cortical tissue damage, some permeation of ECM could be seen. These areas were mostly void of neurons, but significant amounts of microglia were present directly interacting with some of the permeating ECM. (For interpretation of the references to color in this figure legend, the reader is referred to the web version of this article.)
Fig. 4
Fig. 4. Gelation and permeation of the ECM material at the host tissue interface
At 0 mg/mL (PBS injection), no exogenous collagen I is detected inside the lesion cavity (as delineated by Iba-1 staining for microglia and GFAP for astrocytes). At 1 and 2 mg/mL, injected ECM material shows poor retention inside the lesion cavity, as significant diffusion of the ECM material into the peri-infarct area can be seen. At 3 mg/mL, the ECM material shows hydrogel formation and retention inside the cavity, with some diffusion into the surrounding tissue. At 4 and 8 mg/mL, a clear boundary can be seen at the interface between the host tissue and the ECM hydrogel. Concentrations >3 mg/mL resulted in complete gelation and retention of the hydrogel with minimal to no diffusion into the host tissue. The predominant cell phenotypes surrounding all cavities consist of microglia and astrocytes with evidence of cell invasion of these host cells into the injected material at all concentrations.
Fig. 5
Fig. 5. Patterns of cell invasion
A microscopic view of the lesion interface with the ECM hydrogel (collagen I+ area) indicates a higher density of DAPI+ cells surrounding the biomaterial with evidence of a concentric invasion of host cells (yellow arrows) into the acellular material. The predominant cellular phenotypes surrounding the ECM hydrogel, forming the glia limitans, are astrocytes (GFAP+ cells) and microglia (Iba-1+ cells). The injection-drainage approach produces a consistent coverage of the cavity (A). A magnified view of the interface between the host tissue and the ECM hydrogel reveals invading microglia migrating from the host tissue to the hydrogel (green arrow). A collagen I negative staining area in some edge regions of the host-biomaterial interface was also evident (blue arrows), but this did not affect the invasion of some cells, although a close interface between host and hydrogel dramatically facilitated cell invasion (brown arrow) (B). In order for the cells to migrate into the damaged tissue, a structural support for the attachment and survival of the cells is favorable. Most commonly microglia are the cells that infiltrated the furthest into the hydrogel, whereas astrocytes were mostly present closer to the host tissue (C). Indeed, a guided chain-like migration along collagen I negative channels can be seen into the hydrogel, potentially indicating that hydrogel ultrastructure is also a contributing factor for initial cell invasion (D). (For interpretation of the references to color in this figure legend, the reader is referred to the web version of this article.)
Fig. 6
Fig. 6. Cell invasion – Colorimetric maps
Identification and labeling of cell invasion at different concentrations using Lux64R based on DAPI staining within a collagen I outline ROI. Using a colorimetric method ranging from light blue (closest to the host boundary) to orange (furthest from host boundary), maps of cell invasion were created to highlight differences between ECM concentrations (A). These maps also allowed us to inspect the anterior-posterior invasion of cells within the ECM hydrogel. It was evident here that the smaller ECM hydrogel areas found at the poles of the cavity saw a more complete coverage of cell invasion compared to more central slices which occupied a large area (B). Invasion typically followed a concentric pattern that saw cells migrating to the center of mass of the injected ECM hydrogel, in some cases leading to very homogenous distribution of host cells through the material (red box). Nevertheless, important qualitative differences in cell invasion were also noted on these colorimetric maps. Cell invasion in some instance followed a very densely packed channel with blind spots within the material hardly seeing any invasion (C). In other cases, there was a no significant invasion (green arrow) in a very restricted region suggesting that potential host factors, such as scarring can influence invasion (D). Indeed, the varied pattern of invasion or the lack therefore indicates that technical factors, such as an air bubble (red arrow), as well as poor interface with host tissue (orange arrow) influence cell invasion, even though other areas of the gel are efficiently invaded (light green arrow) (E). The differential patterns of cell invasion into the same hydrogel hence strongly suggest that the host microenvironment surround the ECM material has a significant influence on cell invasion (F). Nevertheless even if there are blind spots within the hydrogel and areas of poor cell invasion at the host-gel interface, invading cells will find channels (yellow arrows) to move towards the center of mass (i) and are likely to continue their migration in the absence of encountering other cells (G). Scale bars are 5000 μm. (For interpretation of the references to color in this figure legend, the reader is referred to the web version of this article.)
Fig. 7
Fig. 7. Cell invasion – Quantification
(A) Quantification of the cell infiltration into the infarct cavity afforded a comparison of all ECM concentration (mean ± standard deviation) to determine how many cells invaded each 25 μm concentric circle from the center of the mass, as well as the total distance of invasion in relation to the ECM’s interface with host tissue. Mapping of individual animals revealed a spread of cell invasion reflecting difference in the interface between host and ECM hydrogel, as well as ECM concentration for 3 mg/mL (B), 4 mg/mL (C) and 8 mg/mL (D).
Fig. 8
Fig. 8. Contour plots
To determine an interaction between ECM concentration and lesion volume on the number of cells invading the ECM (A), cell density within the ECM material (B), as well as the distance of cell invasion (C), contour plots were generated to illustrate which combinations would be the most and least combinations.
Fig. 9
Fig. 9. Cell invasion – phenotypic characterization
Phenotypic characterization of cell invasion into injected ECM (collagen I+ area) was focused on cell phenotypes found in the brain: neural progenitors as revealed by doublecortin (DCX+), oligodendrocytes (CNPase+), astrocytes (GFAP), microglia (Iba-1+) and endothelial cells (RECA-1+). There was noted invasion of microglia with a bulbar morphology pioneering a path for astrocytes to follow (A). A significant number of DCX+ neural progenitors also invaded the ECM, presumably these were already responding to the surrounding tissue damage (B). A smaller number of endothelial cells were seen invading the ECM material. However, in some cases endothelial cells appeared to organize into tubules, but this was typically in areas where there were remnants of damaged tissue that were engulfed by the ECM hydrogel (C). Oligodendrocytes were also found to invade deep into the ECM material, but cells were mostly of an uncharacteristic bulbar shape (D). In addition to the “indigenous” brain cells, the infiltration of peripheral macrophages and their polarization towards an M1 (CD86+) or M2 (CD206+) phenotype were investigated (E). Almost all CD206+ cells were also positive for CD86.
Fig. 10
Fig. 10. Cell invasion – Quantification of cell phenotypes
An 8 mg/mL ECM concentration resulted in the most significant proportion of brain cells invading the material. Most significantly neural (DCX+ cells) and oligodendrocyte progenitors (CNPase+ cells) were among the first phenotypes to invade the ECM, with astrocytes (GFAP+ cells) and endothelial (RECA-1+) cells being most negligible proportions. Nevertheless, as expected a high proportion of microglia (IBa-1+ cells) and macrophages invaded the material. Again, an 8 mg/mL ECM concentration produced the most significant shift from a M1 (CD86+ cells) towards an M2 (CD206+ cells) phenotype.

References

    1. Mozaffarian D, Benjamin EJ, Go AS, Arnett DK, Blaha MJ, Cushman M, et al. Heart disease and stroke statistics–2015 update: a report from the American Heart Association. Circulation. 2015;131:e29–e322. - PubMed
    1. Cumberland Consensus Working G. Cheeran B, Cohen L, Dobkin B, Ford G, Greenwood R. The future of restorative neurosciences in stroke: driving the translational research pipeline from basic science to rehabilitation of people after stroke, Neurorehabil. Neural Repair. 2009;23:97–107. - PMC - PubMed
    1. Dalise S, Ambrosio F, Modo M. Brain plasticity and recovery in preclinical models of stroke. Arch Ital Biol. 2014;152:190–215. - PubMed
    1. Modo M, Ambrosio F, Friedlander RM, Badylak SF, Wechsler LR. Bioengineering solutions for neural repair and recovery in stroke. Curr Opin Neurol. 2013;26:626–631. - PubMed
    1. Smith EJ, Stroemer RP, Gorenkova N, Nakajima M, Crum WR, Tang E, et al. Implantation site and lesion topology determine efficacy of a human neural stem cell line in a rat model of chronic stroke. Stem Cells. 2012;30:785–796. - PubMed

Publication types

MeSH terms

Substances

LinkOut - more resources