

Novel minimal physiologically-based model for the prediction of passive tubular reabsorption and renal excretion clearance
- PMID: 27033147
- PMCID: PMC5074076
- DOI: 10.1016/j.ejps.2016.03.018
Novel minimal physiologically-based model for the prediction of passive tubular reabsorption and renal excretion clearance
Abstract
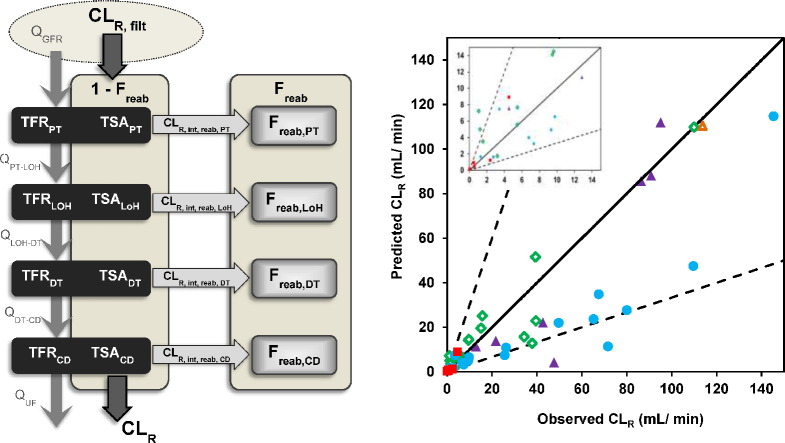
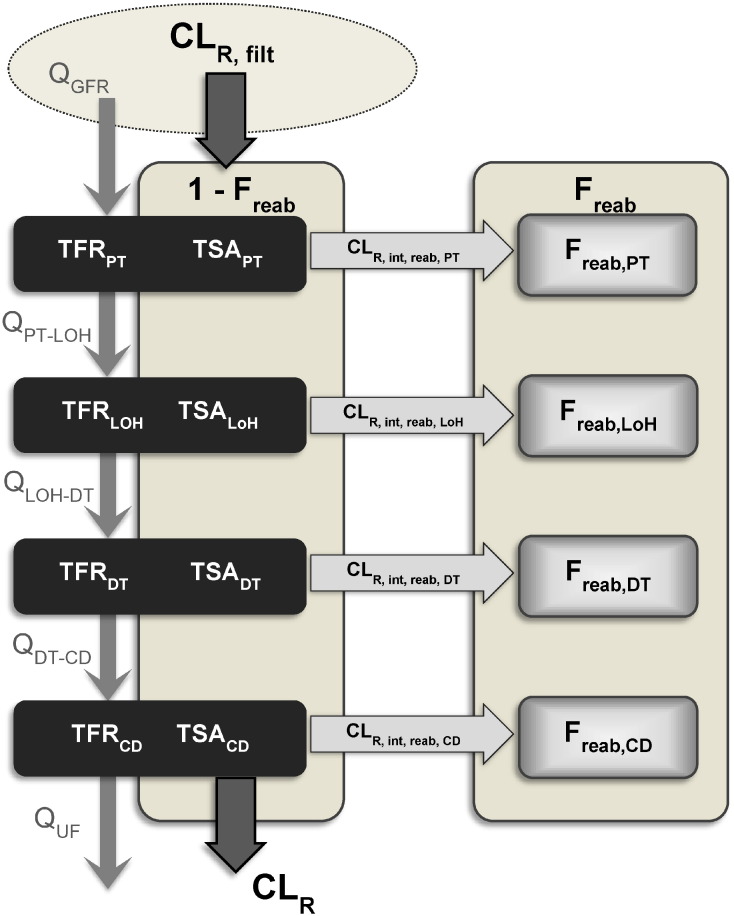
Purpose: Develop a minimal mechanistic model based on in vitro-in vivo extrapolation (IVIVE) principles to predict extent of passive tubular reabsorption. Assess the ability of the model developed to predict extent of passive tubular reabsorption (Freab) and renal excretion clearance (CLR) from in vitro permeability data and tubular physiological parameters.
Methods: Model system parameters were informed by physiological data collated following extensive literature analysis. A database of clinical CLR was collated for 157 drugs. A subset of 45 drugs was selected for model validation; for those, Caco-2 permeability (Papp) data were measured under pH6.5-7.4 gradient conditions and used to predict Freab and subsequently CLR. An empirical calibration approach was proposed to account for the effect of inter-assay/laboratory variation in Papp on the IVIVE of Freab.
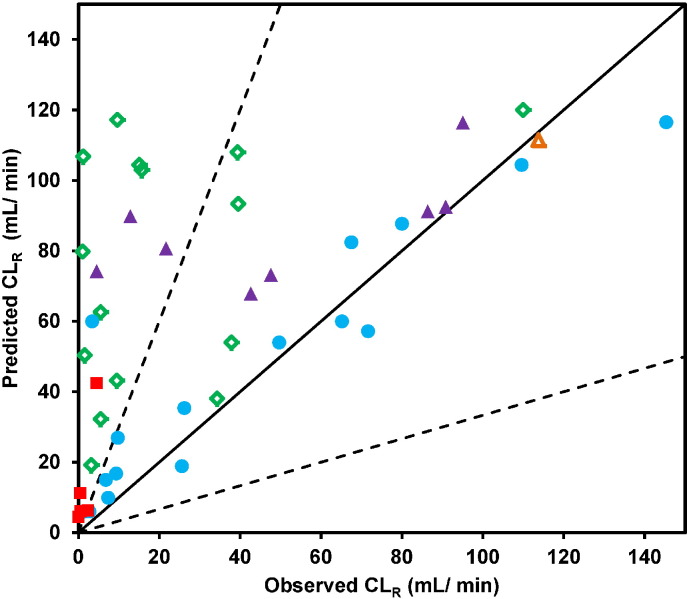
Results: The 5-compartmental model accounted for regional differences in tubular surface area and flow rates and successfully predicted the extent of tubular reabsorption of 45 drugs for which filtration and reabsorption were contributing to renal excretion. Subsequently, predicted CLR was within 3-fold of the observed values for 87% of drugs in this dataset, with an overall gmfe of 1.96. Consideration of the empirical calibration method improved overall prediction of CLR (gmfe=1.73 for 34 drugs in the internal validation dataset), in particular for basic drugs and drugs with low extent of tubular reabsorption.
Conclusions: The novel 5-compartment model represents an important addition to the IVIVE toolbox for physiologically-based prediction of renal tubular reabsorption and CLR. Physiological basis of the model proposed allows its application in future mechanistic kidney models in preclinical species and human.
Keywords: In vitro–in vivo extrapolation; Renal excretion clearance; Tubular reabsorption.
Copyright © 2016 Elsevier B.V. All rights reserved.
Figures
 ), basic (
 ), acidic (
 ), zwitterion (
 ) and amphoteric (
 ) drugs are indicated. Solid and dashed lines represent line of unity and 3-fold error, respectively.
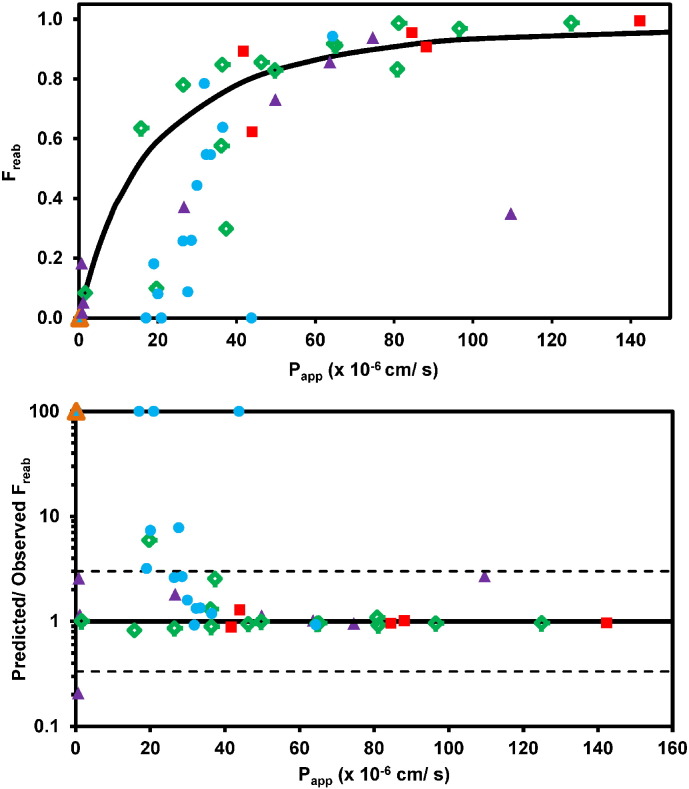 ), basic (), acidic (), zwitterion () and amphoteric () drugs. Drugs with negative values for observed Freab are plotted as Freab = 0 in Panel A, or predicted/observed Freab = 100 in Panel B, as described in the Materials and methods.
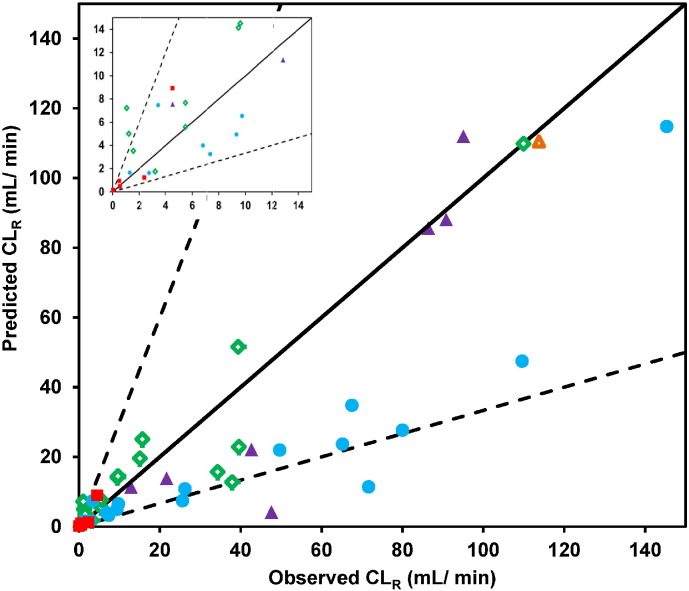 ), basic (), acidic (), zwitterion () and amphoteric () drugs respectively. Solid and dashed lines represent line of unity and 3-fold error, respectively. The inset shows the data for lower CLR values for clarity.
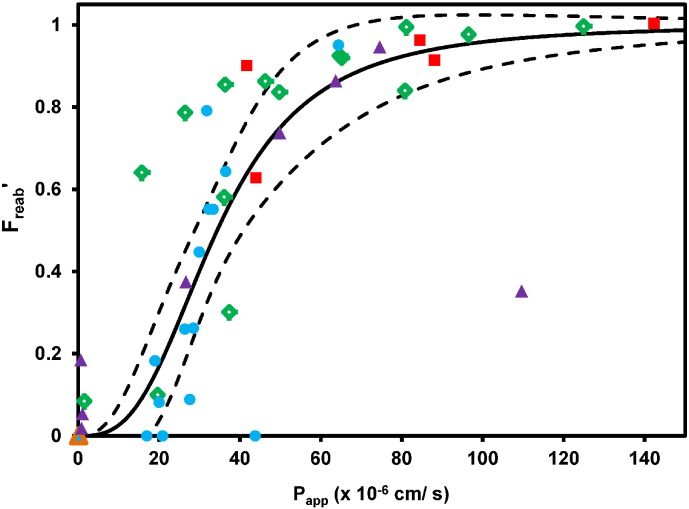 ), basic (), acidic (), zwitterion () and amphoteric () drugs. Drugs with negative values for observed Freab′ are plotted as Freab′ = 0, as described in the text.
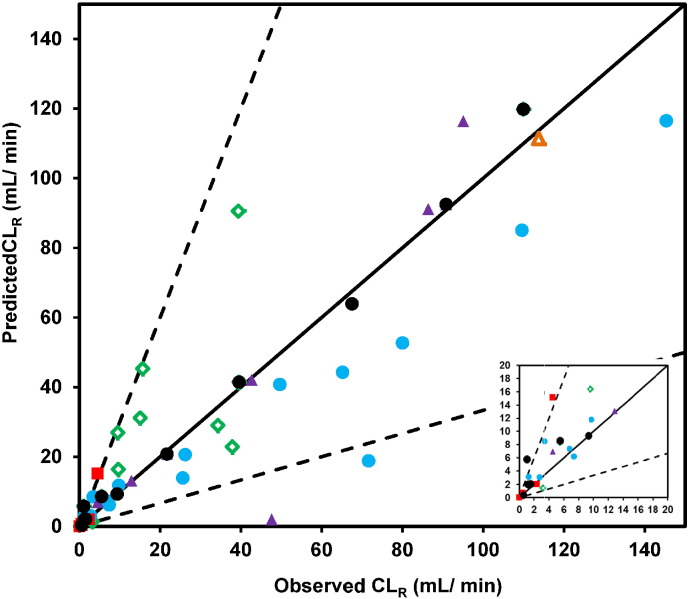 ), basic (), acidic (), zwitterion () and amphoteric () drugs in the internal ‘validation’ dataset and drugs in the reference dataset (●; n = 11). Solid and dashed lines represent line of unity and 3-fold error, respectively. The inset shows the data for lower CLR values for clarity.
Similar articles
-
Key to Opening Kidney for In Vitro-In Vivo Extrapolation Entrance in Health and Disease: Part II: Mechanistic Models and In Vitro-In Vivo Extrapolation.AAPS J. 2016 Sep;18(5):1082-1094. doi: 10.1208/s12248-016-9959-1. Epub 2016 Aug 9. AAPS J. 2016. PMID: 27506526 Review.
-
Towards Further Verification of Physiologically-Based Kidney Models: Predictability of the Effects of Urine-Flow and Urine-pH on Renal Clearance.J Pharmacol Exp Ther. 2019 Feb;368(2):157-168. doi: 10.1124/jpet.118.251413. Epub 2018 Nov 9. J Pharmacol Exp Ther. 2019. PMID: 30413628
-
Is the GFR-based scaling approach adequate for predicting pediatric renal clearance of drugs with passive tubular reabsorption? Insights from PBPK modeling.CPT Pharmacometrics Syst Pharmacol. 2025 Jan;14(1):152-163. doi: 10.1002/psp4.13254. Epub 2024 Oct 15. CPT Pharmacometrics Syst Pharmacol. 2025. PMID: 39403008 Free PMC article.
-
Novel Mechanistic PBPK Model to Predict Renal Clearance in Varying Stages of CKD by Incorporating Tubular Adaptation and Dynamic Passive Reabsorption.CPT Pharmacometrics Syst Pharmacol. 2020 Oct;9(10):571-583. doi: 10.1002/psp4.12553. Epub 2020 Sep 25. CPT Pharmacometrics Syst Pharmacol. 2020. PMID: 32977369 Free PMC article.
-
Prediction of human pharmacokinetics - renal metabolic and excretion clearance.J Pharm Pharmacol. 2007 Nov;59(11):1463-71. doi: 10.1211/jpp.59.11.0002. J Pharm Pharmacol. 2007. PMID: 17976256 Review.
Cited by
-
Development of a Dynamic Physiologically Based Mechanistic Kidney Model to Predict Renal Clearance.CPT Pharmacometrics Syst Pharmacol. 2018 Sep;7(9):593-602. doi: 10.1002/psp4.12321. Epub 2018 Aug 11. CPT Pharmacometrics Syst Pharmacol. 2018. PMID: 30043446 Free PMC article.
-
Artificial Intelligence in Drug Metabolism and Excretion Prediction: Recent Advances, Challenges, and Future Perspectives.Pharmaceutics. 2023 Apr 17;15(4):1260. doi: 10.3390/pharmaceutics15041260. Pharmaceutics. 2023. PMID: 37111744 Free PMC article. Review.
-
Prediction of Drug Clearance from Enzyme and Transporter Kinetics.Methods Mol Biol. 2021;2342:369-417. doi: 10.1007/978-1-0716-1554-6_14. Methods Mol Biol. 2021. PMID: 34272702
-
Physiologically Based Pharmacokinetic Modelling for First-In-Human Predictions: An Updated Model Building Strategy Illustrated with Challenging Industry Case Studies.Clin Pharmacokinet. 2019 Jun;58(6):727-746. doi: 10.1007/s40262-019-00741-9. Clin Pharmacokinet. 2019. PMID: 30729397 Review.
-
Key to Opening Kidney for In Vitro-In Vivo Extrapolation Entrance in Health and Disease: Part II: Mechanistic Models and In Vitro-In Vivo Extrapolation.AAPS J. 2016 Sep;18(5):1082-1094. doi: 10.1208/s12248-016-9959-1. Epub 2016 Aug 9. AAPS J. 2016. PMID: 27506526 Review.
References
-
- Artursson P., Palm K., Luthman K. Caco-2 monolayers in experimental and theoretical predictions of drug transport. Adv. Drug Deliv. Rev. 2001;46:27. - PubMed
-
- Avdeef A., Tam K.Y. How well can the Caco-2/Madin–Darby canine kidney models predict effective human jejunal permeability? J. Med. Chem. 2010;53(9):3566. - PubMed
-
- Bentz J., O'Connor M.P., Bednarczyk D., Coleman J., Lee C., Palm J., Pak Y.A., Perloff E.S., Reyner E., Balimane P. Variability in P-glycoprotein inhibitory potency (IC50) using various in vitro experimental systems: implications for universal digoxin drug–drug interaction risk assessment decision criteria. Drug Metab. Dispos. 2013;41(7):1347. - PMC - PubMed
-
- Brown C., Sayer R., Windass A., Haslam I., De Broe M., D'Haese P., Verhulst A. Characterisation of human tubular cell monolayers as a model of proximal tubular xenobiotic handling. Toxicol. Appl. Pharmacol. 2008;233(3):428. - PubMed
MeSH terms
Substances
LinkOut - more resources
Full Text Sources
Other Literature Sources
Medical
