

The neural representation of objects formed through the spatiotemporal integration of visual transients
- PMID: 27033688
- PMCID: PMC5035556
- DOI: 10.1016/j.neuroimage.2016.03.044
The neural representation of objects formed through the spatiotemporal integration of visual transients
Abstract
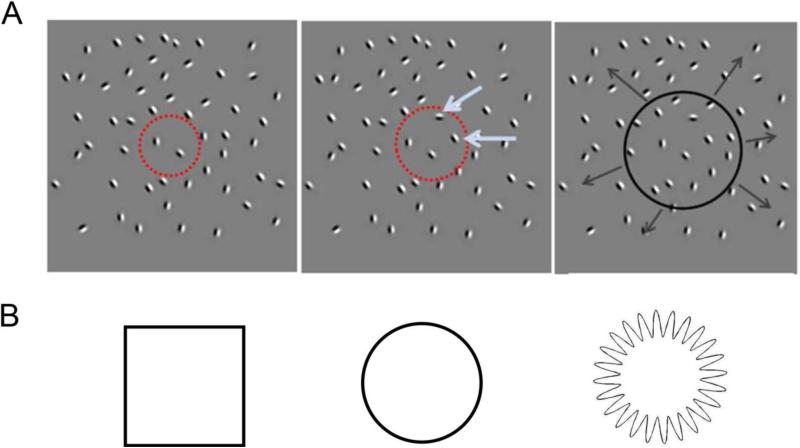
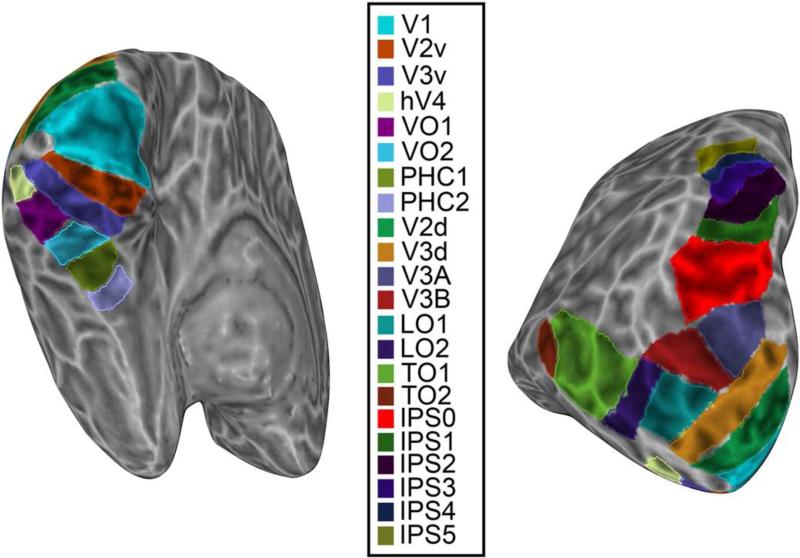
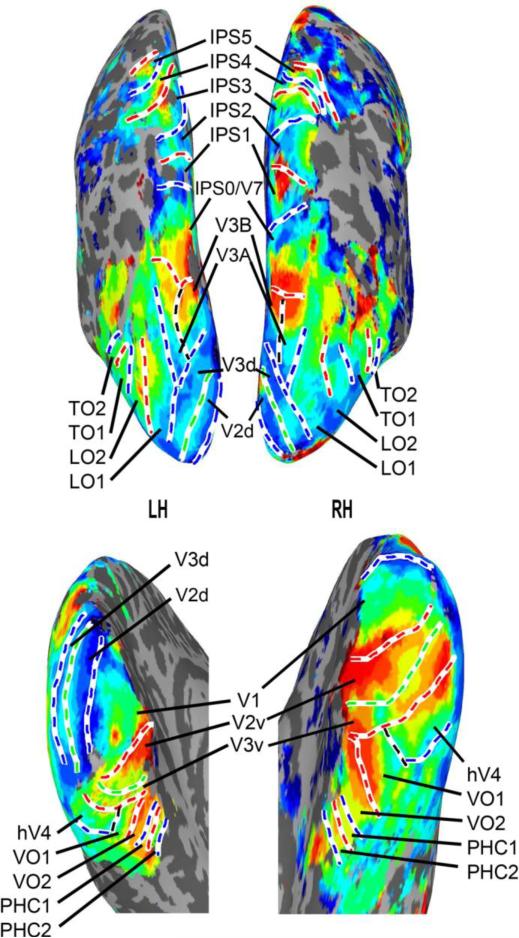
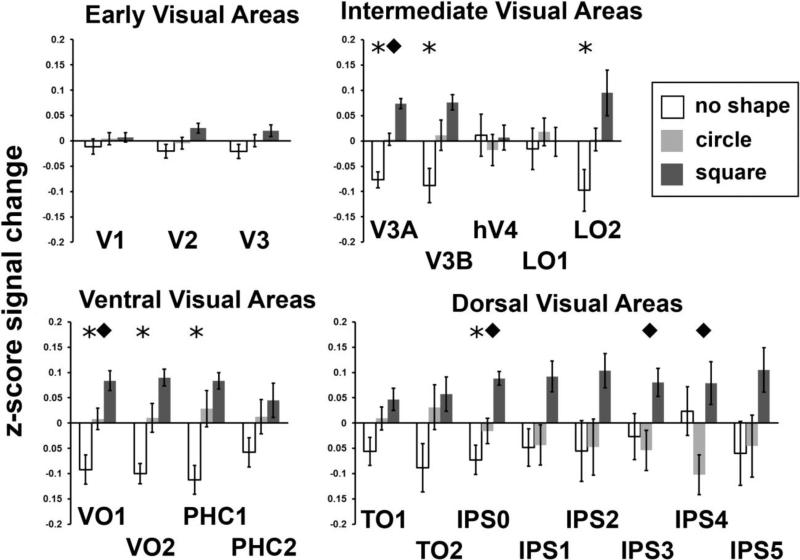
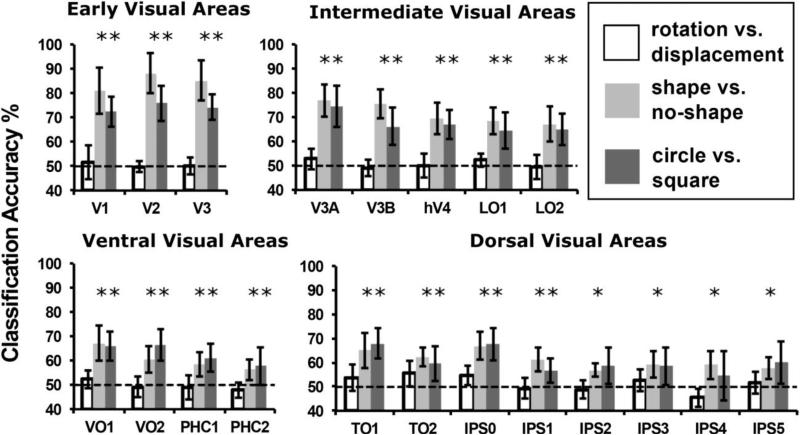
Oftentimes, objects are only partially and transiently visible as parts of them become occluded during observer or object motion. The visual system can integrate such object fragments across space and time into perceptual wholes or spatiotemporal objects. This integrative and dynamic process may involve both ventral and dorsal visual processing pathways, along which shape and spatial representations are thought to arise. We measured fMRI BOLD response to spatiotemporal objects and used multi-voxel pattern analysis (MVPA) to decode shape information across 20 topographic regions of visual cortex. Object identity could be decoded throughout visual cortex, including intermediate (V3A, V3B, hV4, LO1-2,) and dorsal (TO1-2, and IPS0-1) visual areas. Shape-specific information, therefore, may not be limited to early and ventral visual areas, particularly when it is dynamic and must be integrated. Contrary to the classic view that the representation of objects is the purview of the ventral stream, intermediate and dorsal areas may play a distinct and critical role in the construction of object representations across space and time.
Keywords: Dorsal stream; MVPA; Shape perception; Spatiotemporal objects; V3A/B.
Copyright © 2016 Elsevier Inc. All rights reserved.
Figures
Similar articles
-
Decoding information about dynamically occluded objects in visual cortex.Neuroimage. 2017 Feb 1;146:778-788. doi: 10.1016/j.neuroimage.2016.09.024. Epub 2016 Sep 20. Neuroimage. 2017. PMID: 27663987 Free PMC article.
-
The Contribution of Object Shape and Surface Properties to Object Ensemble Representation in Anterior-medial Ventral Visual Cortex.J Cogn Neurosci. 2017 Feb;29(2):398-412. doi: 10.1162/jocn_a_01050. Epub 2016 Sep 27. J Cogn Neurosci. 2017. PMID: 27676614
-
Towards a unified perspective of object shape and motion processing in human dorsal cortex.Conscious Cogn. 2018 Sep;64:106-120. doi: 10.1016/j.concog.2018.04.016. Epub 2018 May 18. Conscious Cogn. 2018. PMID: 29779844 Free PMC article. Review.
-
Dorsal stream development in motion and structure-from-motion perception.Neuroimage. 2008 Feb 15;39(4):1815-23. doi: 10.1016/j.neuroimage.2007.11.009. Epub 2007 Nov 22. Neuroimage. 2008. PMID: 18096410
-
The maintenance and updating of representations of no longer visible objects and their parts.Prog Brain Res. 2017;236:163-192. doi: 10.1016/bs.pbr.2017.07.010. Epub 2017 Sep 12. Prog Brain Res. 2017. PMID: 29157410 Review.
Cited by
-
Interaction of contour geometry and optic flow in determining relative depth of surfaces.Atten Percept Psychophys. 2024 Jan;86(1):221-236. doi: 10.3758/s13414-023-02807-0. Epub 2023 Nov 7. Atten Percept Psychophys. 2024. PMID: 37935897
-
What Does Dorsal Cortex Contribute to Perception?Open Mind (Camb). 2020 Aug;4:40-56. doi: 10.1162/opmi_a_00033. Open Mind (Camb). 2020. PMID: 33225195 Free PMC article.
-
Neuroimaging evidence for the direct role of auditory scene analysis in object perception.Cereb Cortex. 2023 May 9;33(10):6257-6272. doi: 10.1093/cercor/bhac501. Cereb Cortex. 2023. PMID: 36562994 Free PMC article.
-
Decoding information about dynamically occluded objects in visual cortex.Neuroimage. 2017 Feb 1;146:778-788. doi: 10.1016/j.neuroimage.2016.09.024. Epub 2016 Sep 20. Neuroimage. 2017. PMID: 27663987 Free PMC article.
-
Using High-Density Electroencephalography to Explore Spatiotemporal Representations of Object Categories in Visual Cortex.J Cogn Neurosci. 2022 May 2;34(6):967-987. doi: 10.1162/jocn_a_01845. J Cogn Neurosci. 2022. PMID: 35286384 Free PMC article.
References
-
- Avidan G, Harel M, Hendler T, Ben-Bashat D, Zohary E, Malach R. Contrast sensitivity in human visual areas and its relationship to object recognition. J Neurophysiol. 2002;87:3102–3116. - PubMed
MeSH terms
Grants and funding
LinkOut - more resources
Full Text Sources
Other Literature Sources
Medical
