. 2016 Apr 1:7:11176.
doi: 10.1038/ncomms11176.

A low-cost hierarchical nanostructured beta-titanium alloy with high strength

Affiliations

A low-cost hierarchical nanostructured beta-titanium alloy with high strength

Arun Devaraj et al. Nat Commun. .

Abstract

Lightweighting of automobiles by use of novel low-cost, high strength-to-weight ratio structural materials can reduce the consumption of fossil fuels and in turn CO2 emission. Working towards this goal we achieved high strength in a low cost β-titanium alloy, Ti-1Al-8V-5Fe (Ti185), by hierarchical nanostructure consisting of homogenous distribution of micron-scale and nanoscale α-phase precipitates within the β-phase matrix. The sequence of phase transformation leading to this hierarchical nanostructure is explored using electron microscopy and atom probe tomography. Our results suggest that the high number density of nanoscale α-phase precipitates in the β-phase matrix is due to ω assisted nucleation of α resulting in high tensile strength, greater than any current commercial titanium alloy. Thus hierarchical nanostructured Ti185 serves as an excellent candidate for replacing costlier titanium alloys and other structural alloys for cost-effective lightweighting applications.


Figures

Figure 1
Figure 1. Tensile strength comparison with model and other Ti alloys.
(a). Ultimate tensile and yield strength of Ti185 for three STA conditions. Also shown in (a) is the prediction of empirical model in equation (2). (b) Comparison of tensile strength and strain to failure (elongation) of Ti185 alloy with other commercially available Titanium alloys. The graph in (b) is plotted using CES Selector software, Granta Design, Cambridge, UK.
Figure 2
Figure 2. Microstructure of STA conditions.
Representative microstructure of the specimens subjected to three STA conditions (a) 1,300-900-2, (b) 1,375-900-2, and (c) 1,450-900-2. Length of scale bar is 5 μm.
Figure 3
Figure 3. TEM analysis of STA conditions.
Bright-field TEM images showing (a) grain boundary α and intragranular α and (b) primary and secondary intragranular α in a STA 1,300-900-2 specimen. Scale bars are 200 nm in both (ac) grain boundary α and nanoscale secondary intragranular α (scale bar is 200 nm) and (d) high-density nanoscale secondary intragranular α (scale bar is 100 nm) in a STA 1,450-900-2 specimen.
Figure 4
Figure 4. APT analysis of STA conditions.
(a) All-ionic view of the APT reconstruction showing Ti in blue, V in red, Al in purple and Fe in green, (b) ionic view of only Fe, V and Al ions, and (c) the solute partitioning between α and β phase showing V and Fe enrichment in the β phase and Ti and Al enrichment in the α phase in STA 1,300-900-2 specimen. (d) All-ionic view of the APT reconstruction showing the stubby α precipitates and the partitioning of Al (purple) from V (red) and Fe (green) is shown in (e). The compositional partitioning between α and β phases in STA 1,450-900-2 (f). Scale bars for (a,b,d,e) are 20 nm.
Figure 5
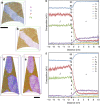
Figure 5. Microstructure of ST conditions.
(a) SEM BSE image of 1300ST showing grain boundary α and primary intragranular α (scale bar is 5 μm) (b) Bright-field TEM image showing grain boundary α and primary intragranular α with β matrix in between devoid of secondary α in a 1,300ST (scale bar is 1 μm); (c) dark field image of 1,300ST showing fine scale omega phase distributed within the β phase regions (scale bar is 100 nm). Dark field image was formed using omega phase reflections inside the dotted circle in the β[113] zone axis SAD shown as inset. (d) SEM BSE image of 1,450ST showing grain boundary α and primary intragranular α (scale bar is 5 μm) (e) Bright-field TEM image showing grain boundary α and β matrix devoid of secondary alpha in 1,450ST (scale bar is 1 μm) (f) dark field image showing distribution of fine scale omega phase within the β phase regions(scale bar is 100 nm). Dark field image was formed using omega phase reflections inside the dotted circle in the β[110]zone axis SAD shown as inset.

References

    1. Canadell J. G. et al.. Contributions to accelerating atmospheric CO2 growth from economic activity, carbon intensity, and efficiency of natural sinks. Proc. Natl Acad. Sci. USA 104, 18866–18870 (2007). - PMC - PubMed
    1. Raupach M. R. et al.. Global and regional drivers of accelerating CO2 emissions. Proc. Natl Acad. Sci. USA 104, 10288–10293 (2007). - PMC - PubMed
    1. DeCicco J., Fung F. (ed). in Global Warming On the Road: The Climate Impact of Americas Automobiles Environmental Defense (2006).
    1. Executive Office of the President, US. Driving Efficiency Cutting Costs for Families at the Pump and Slashing Dependence on Oil Executive Office of the President (2011).
    1. Boyer R. R. & Briggs R. D. The use of beta titanium alloys in the aerospace industry. J. Mater. Eng. Perform. 14, 681–685 (2005).

Publication types

LinkOut - more resources