

Massive Clonal Selection and Transiently Contributing Clones During Expansion of Mesenchymal Stem Cell Cultures Revealed by Lentiviral RGB-Barcode Technology
- PMID: 27034413
- PMCID: PMC4835246
- DOI: 10.5966/sctm.2015-0176
Massive Clonal Selection and Transiently Contributing Clones During Expansion of Mesenchymal Stem Cell Cultures Revealed by Lentiviral RGB-Barcode Technology
Abstract
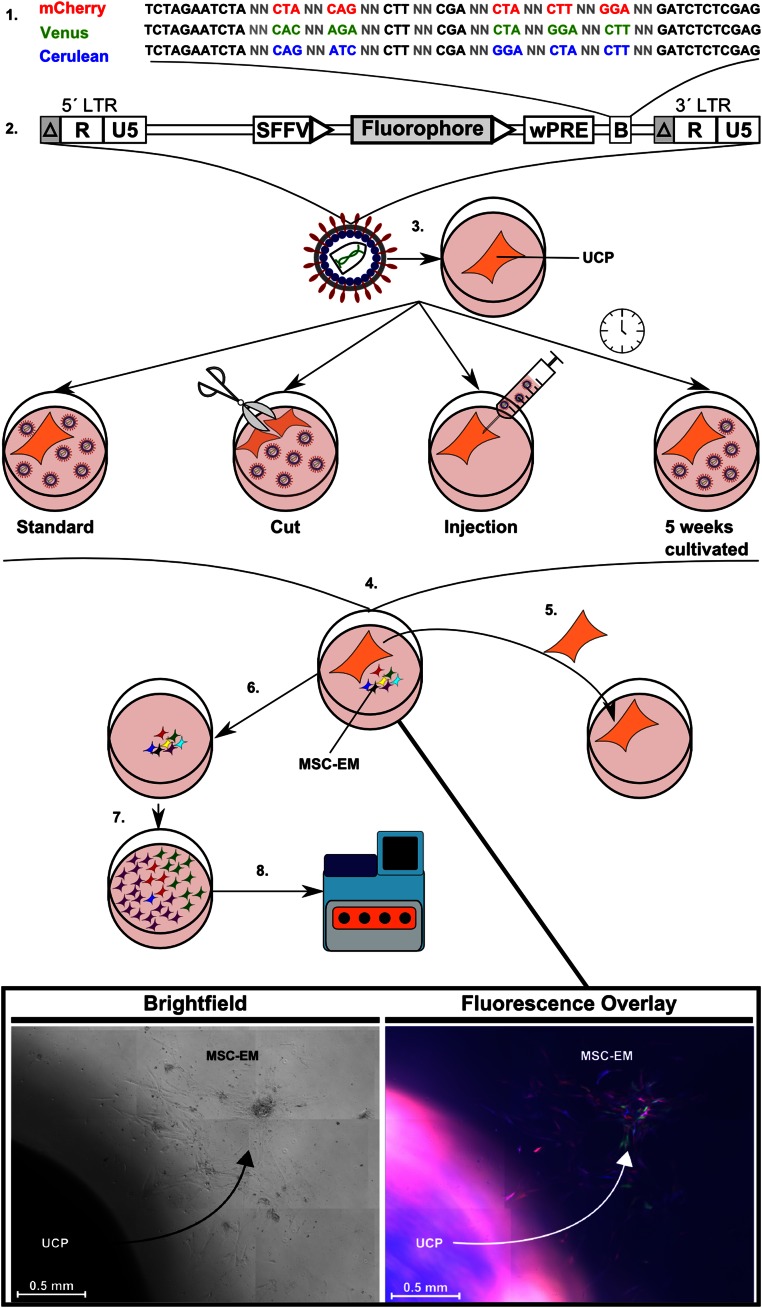
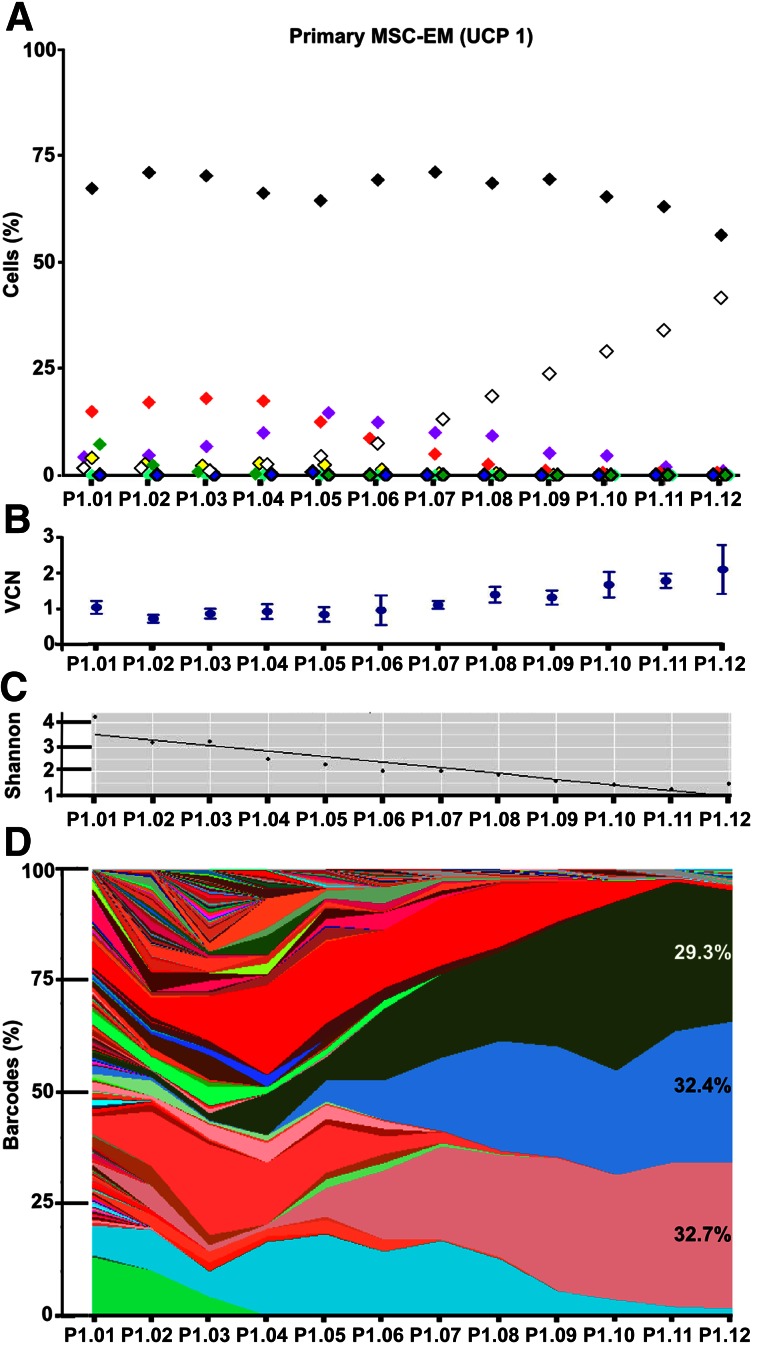
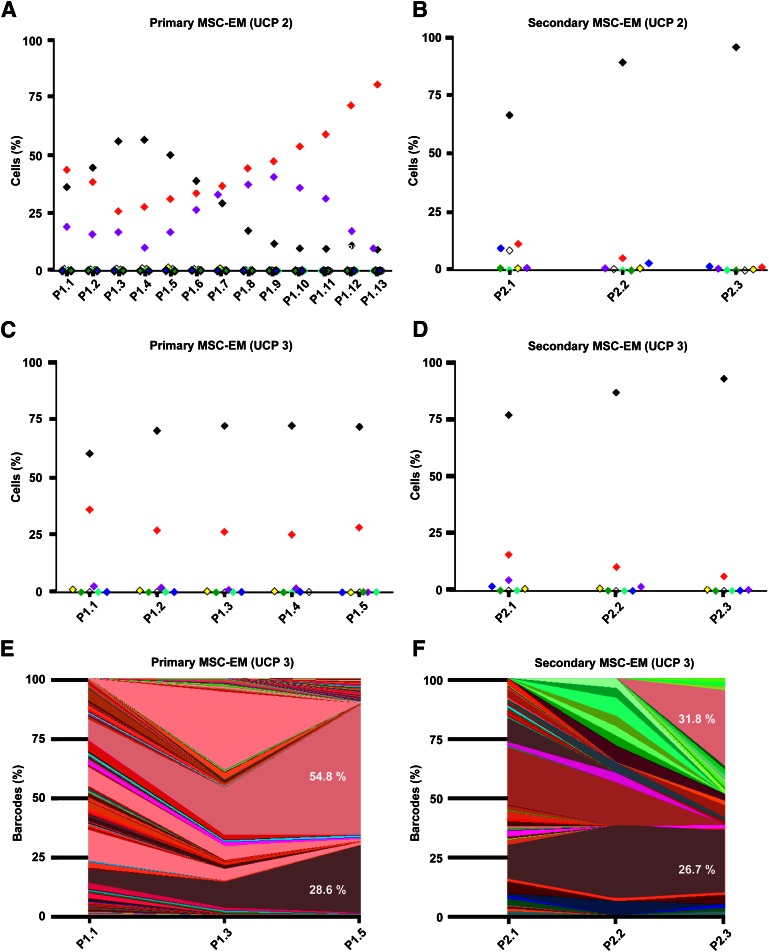
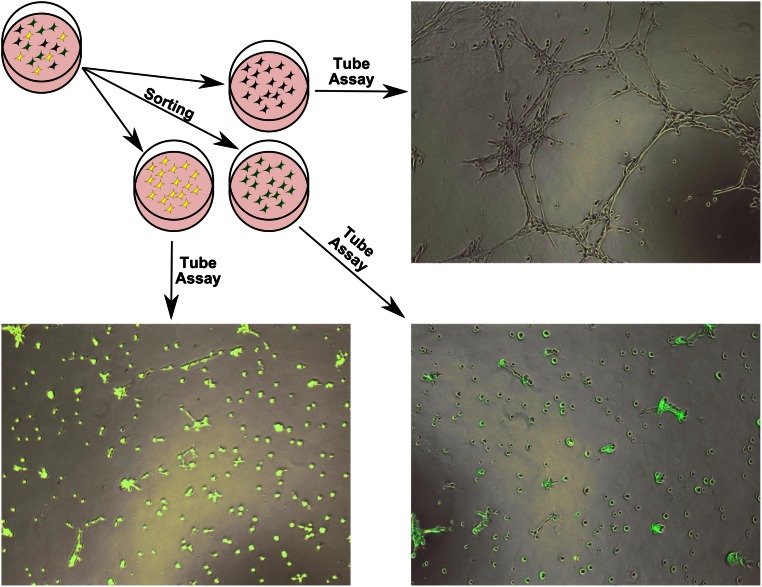
Mesenchymal stem (or stromal) cells (MSCs) have been used in more than 400 clinical trials for the treatment of various diseases. The clinical benefit and reproducibility of results, however, remain extremely variable. During the in vitro expansion phase, which is necessary to achieve clinically relevant cell numbers, MSCs show signs of aging accompanied by different contributions of single clones to the mass culture. Here we used multicolor lentiviral barcode labeling to follow the clonal dynamics during in vitro MSC expansion from whole umbilical cord pieces (UCPs). The clonal composition was analyzed by a combination of flow cytometry, fluorescence microscopy, and deep sequencing. Starting with highly complex cell populations, we observed a massive reduction in diversity, transiently dominating populations, and a selection of single clones over time. Importantly, the first wave of clonal constriction already occurred in the early passages during MSC expansion. Consecutive MSC cultures from the same UCP implied the existence of more primitive, MSC culture-initiating cells. Our results show that microscopically homogenous MSC mass cultures consist of many subpopulations, which undergo clonal selection and have different capabilities. Among other factors, the clonal composition of the graft might have an impact on the functional properties of MSCs in experimental and clinical settings.
Significance: Mesenchymal stem cells (MSCs) can easily be obtained from various adult or embryonal tissues and are frequently used in clinical trials. For their clinical application, MSCs have to be expanded in vitro. This unavoidable step influences the features of MSCs, so that clinical benefit and experimental results are often highly variable. Despite a homogenous appearance under the microscope, MSC cultures undergo massive clonal selection over time. Multicolor fluorescence labeling and deep sequencing were used to demonstrate the dynamic clonal composition of MSC cultures, which might ultimately explain the variable clinical performance of the cells.
Keywords: Clonal evolution; DNA barcoding; Mesenchymal stem cells; Reproducibility of results; Stem cell niche; Umbilical cord.
©AlphaMed Press.
Figures
Similar articles
-
Umbilical cord as a long-term source of activatable mesenchymal stromal cells for immunomodulation.Stem Cell Res Ther. 2019 Sep 23;10(1):285. doi: 10.1186/s13287-019-1376-9. Stem Cell Res Ther. 2019. PMID: 31547865 Free PMC article.
-
Long-term expansion and pluripotent marker array analysis of Wharton's jelly-derived mesenchymal stem cells.Stem Cells Dev. 2010 Jan;19(1):117-30. doi: 10.1089/scd.2009.0177. Stem Cells Dev. 2010. PMID: 19619003
-
Aging of bone marrow- and umbilical cord-derived mesenchymal stromal cells during expansion.Cytotherapy. 2017 Jul;19(7):798-807. doi: 10.1016/j.jcyt.2017.03.071. Epub 2017 Apr 24. Cytotherapy. 2017. PMID: 28462821
-
Native and solubilized decellularized extracellular matrix: A critical assessment of their potential for improving the expansion of mesenchymal stem cells.Acta Biomater. 2017 Jun;55:1-12. doi: 10.1016/j.actbio.2017.04.014. Epub 2017 Apr 12. Acta Biomater. 2017. PMID: 28412553 Review.
-
Concise Review: When Colonies Are Not Clones: Evidence and Implications of Intracolony Heterogeneity in Mesenchymal Stem Cells.Stem Cells. 2016 May;34(5):1135-41. doi: 10.1002/stem.2296. Epub 2016 Feb 21. Stem Cells. 2016. PMID: 26840390 Review.
Cited by
-
Competitive sgRNA Screen Identifies p38 MAPK as a Druggable Target to Improve HSPC Engraftment.Cells. 2020 Sep 29;9(10):2194. doi: 10.3390/cells9102194. Cells. 2020. PMID: 33003308 Free PMC article.
-
Interferon-Gamma Primed Human Clonal Mesenchymal Stromal Cell Sheets Exhibit Enhanced Immunosuppressive Function.Cells. 2022 Nov 23;11(23):3738. doi: 10.3390/cells11233738. Cells. 2022. PMID: 36497001 Free PMC article.
-
Cellular expansion of MSCs: Shifting the regenerative potential.Aging Cell. 2023 Jan;22(1):e13759. doi: 10.1111/acel.13759. Epub 2022 Dec 19. Aging Cell. 2023. PMID: 36536521 Free PMC article. Review.
-
Mesenchymal Stromal Cells in Ischemic Brain Injury.Cells. 2022 Mar 17;11(6):1013. doi: 10.3390/cells11061013. Cells. 2022. PMID: 35326464 Free PMC article. Review.
-
A milestone for the therapeutic EV field: FDA approves Ryoncil, an allogeneic bone marrow-derived mesenchymal stromal cell therapy.Extracell Vesicles Circ Nucl Acids. 2025 Mar 25;6(1):183-190. doi: 10.20517/evcna.2025.02. eCollection 2025. Extracell Vesicles Circ Nucl Acids. 2025. PMID: 40206802 Free PMC article.
References
-
- Friedenstein AJ, Petrakova KV, Kurolesova AI, et al. Heterotopic of bone marrow. Analysis of precursor cells for osteogenic and hematopoietic tissues. Transplantation. 1968;6:230–247. - PubMed
-
- Griffin MD, Ritter T, Mahon BP. Immunological aspects of allogeneic mesenchymal stem cell therapies. Hum Gene Ther. 2010;21:1641–1655. - PubMed
-
- Wuchter P, Bieback K, Schrezenmeier H, et al. Standardization of Good Manufacturing Practice-compliant production of bone marrow-derived human mesenchymal stromal cells for immunotherapeutic applications. Cytotherapy. 2015;17:128–139. - PubMed
Publication types
MeSH terms
LinkOut - more resources
Full Text Sources
Other Literature Sources
