. 2016 May 5;44(8):3788-800.
doi: 10.1093/nar/gkw207. Epub 2016 Mar 31.

Genome-wide analysis of Musashi-2 targets reveals novel functions in governing epithelial cell migration

Affiliations

Genome-wide analysis of Musashi-2 targets reveals novel functions in governing epithelial cell migration

Christopher G Bennett et al. Nucleic Acids Res. .

Abstract

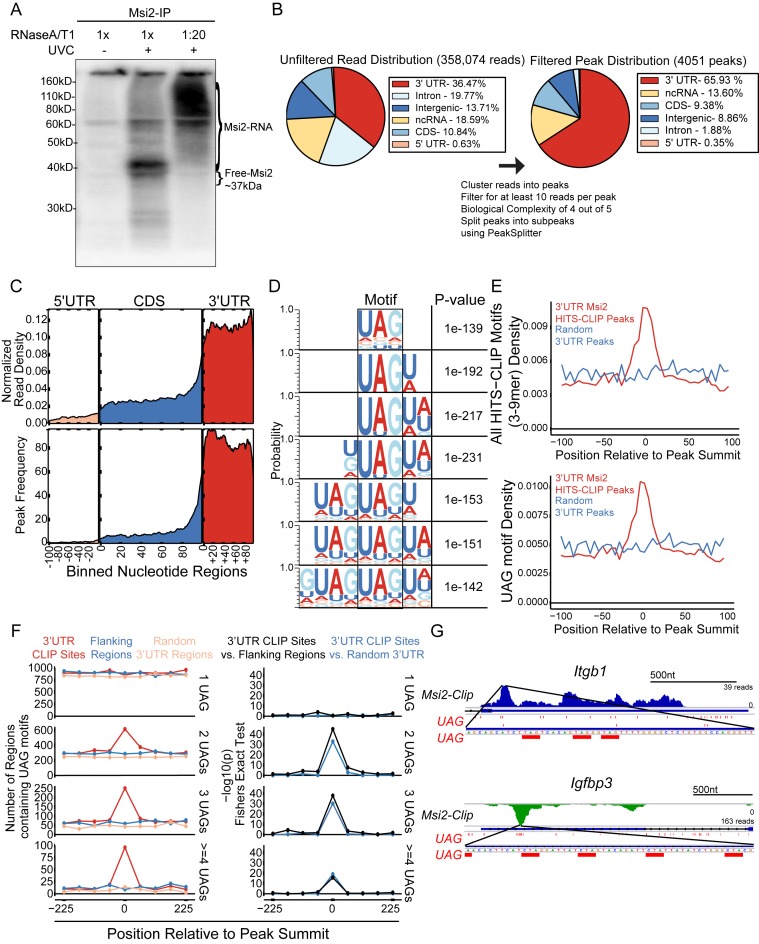
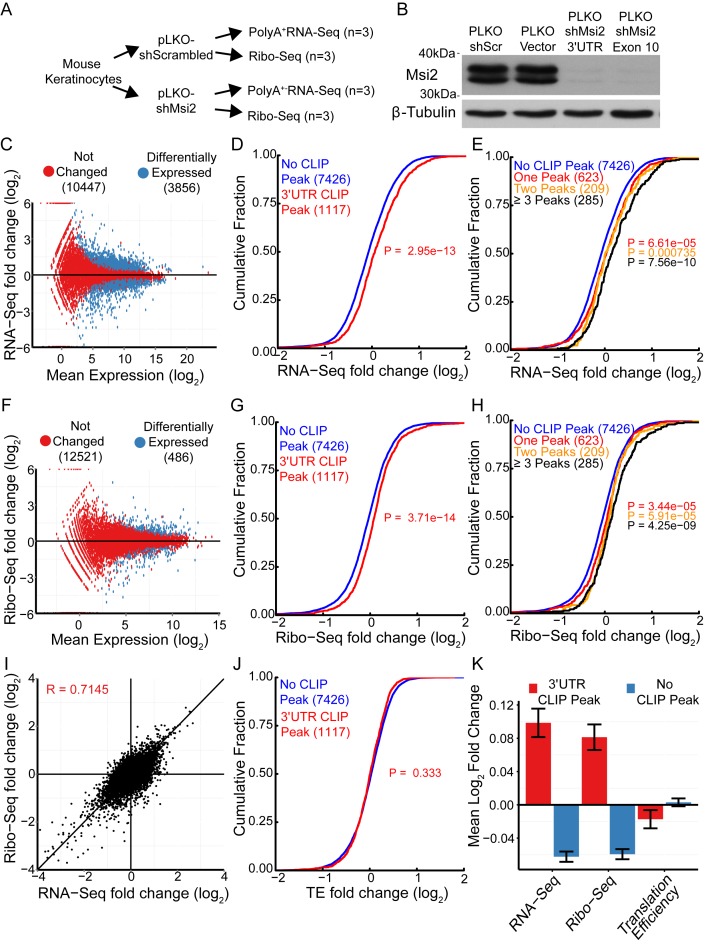
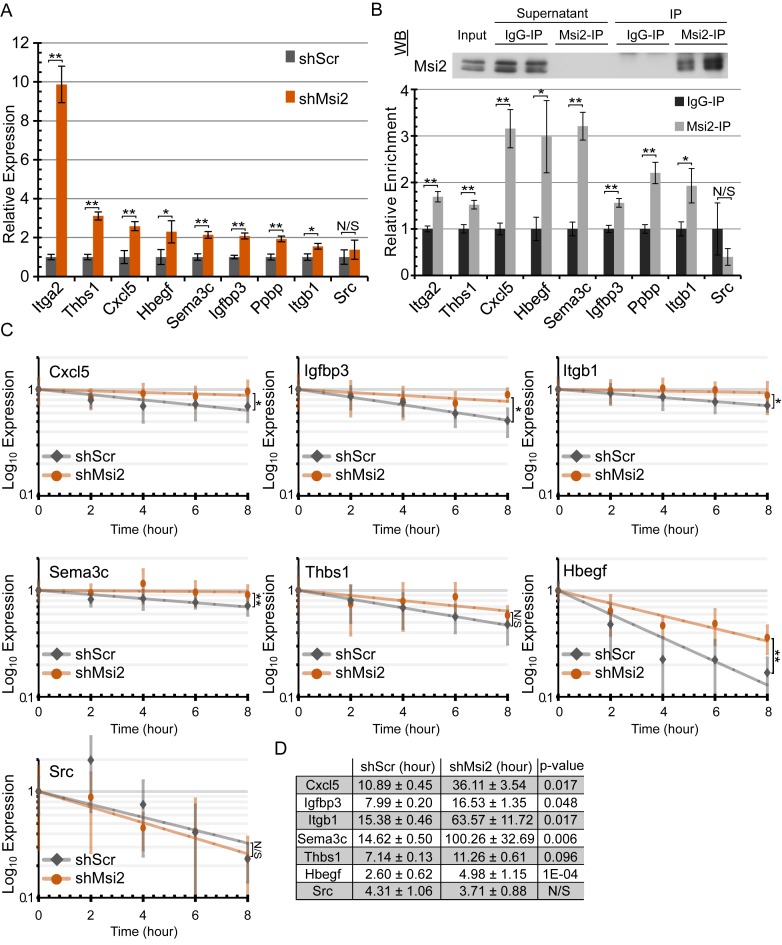
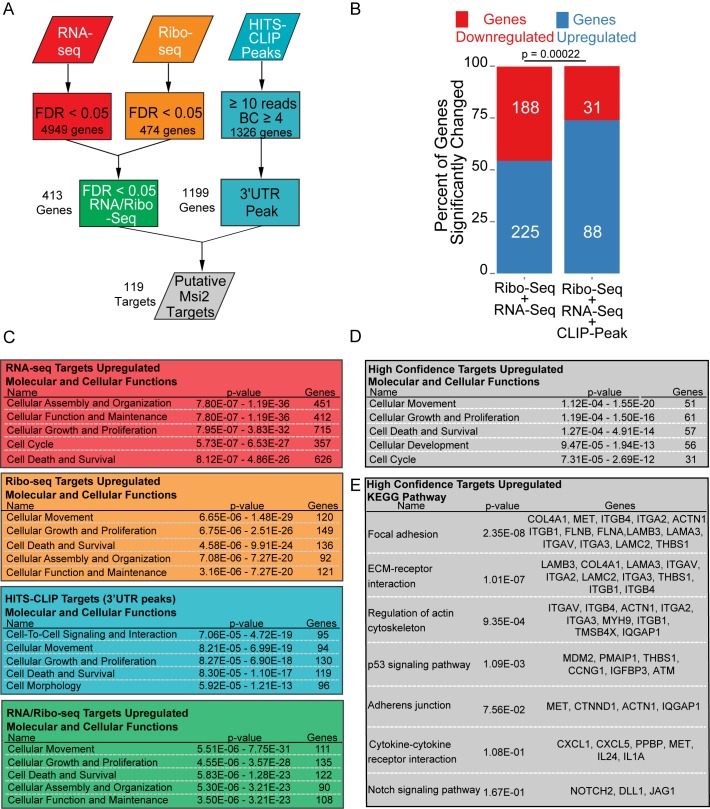
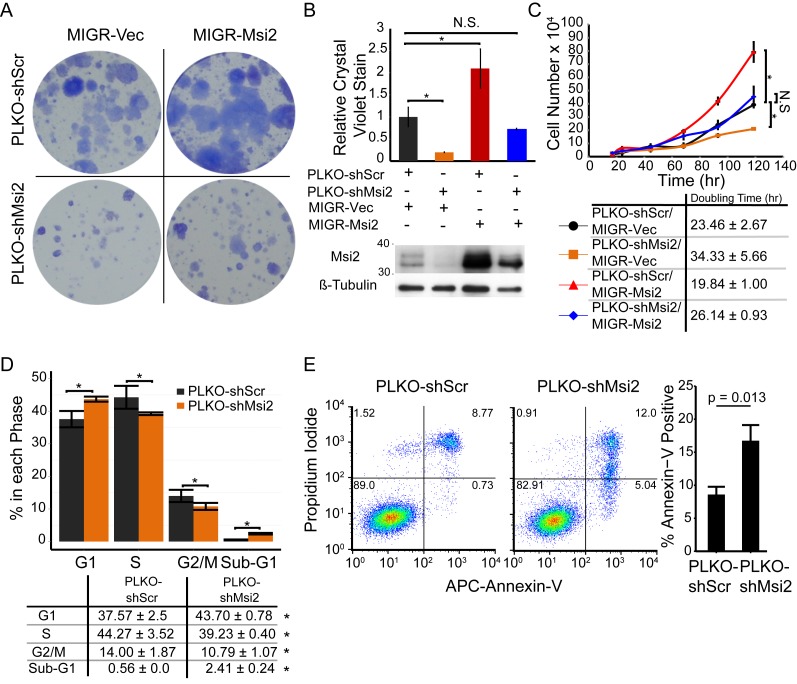
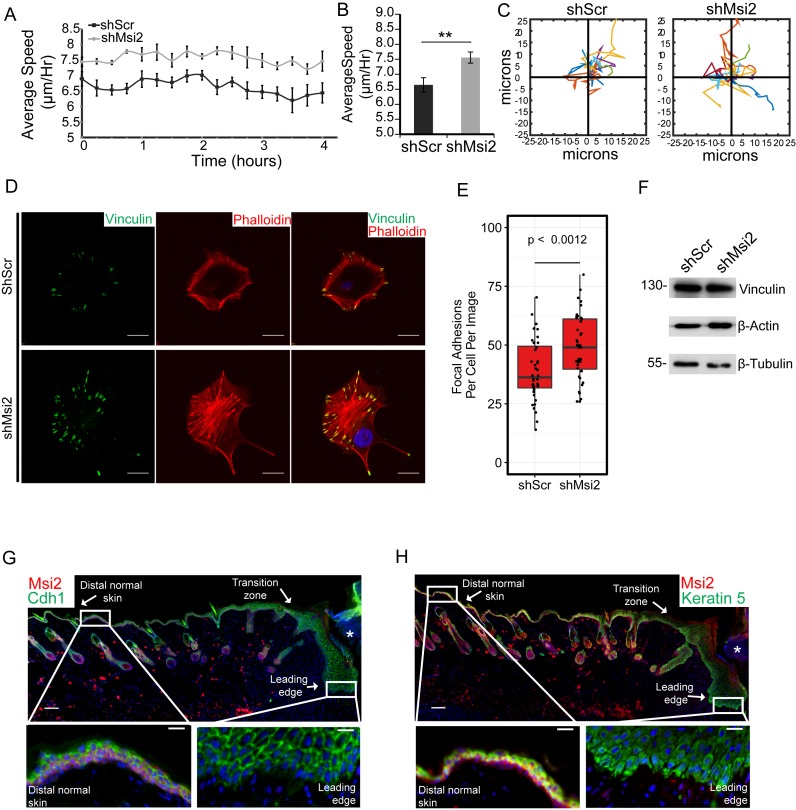
The Musashi-2 (Msi2) RNA-binding protein maintains stem cell self-renewal and promotes oncogenesis by enhancing cell proliferation in hematopoietic and gastrointestinal tissues. However, it is unclear how Msi2 recognizes and regulates mRNA targets in vivo and whether Msi2 primarily controls cell growth in all cell types. Here we identified Msi2 targets with HITS-CLIP and revealed that Msi2 primarily recognizes mRNA 3'UTRs at sites enriched in multiple copies of UAG motifs in epithelial progenitor cells. RNA-seq and ribosome profiling demonstrated that Msi2 promotes targeted mRNA decay without affecting translation efficiency. Unexpectedly, the most prominent Msi2 targets identified are key regulators that govern cell motility with a high enrichment in focal adhesion and extracellular matrix-receptor interaction, in addition to regulators of cell growth and survival. Loss of Msi2 stimulates epithelial cell migration, increases the number of focal adhesions and also compromises cell growth. These findings provide new insights into the molecular mechanisms of Msi2's recognition and repression of targets and uncover a key function of Msi2 in restricting epithelial cell migration.


Figures

Figure 1.
Figure 1.
Msi2-HITS-CLIP identifies direct Msi2 targets in keratinocytes. (A) Autoradiogram of 32P-labelled Msi2-RNA complexes treated with different RNase concentration resolved on a 10% Bis-Tris gel. (B) Pie chart of the genomic locations of the aligned reads and filtered peaks before (left panel) and after (right panel) the filtering processes, respectively. (C) Metagene of exonic coverage along a scaled mRNA for aligned reads (top panel) and filtered peaks (bottom panel). Reads densities are normalized for library sizes. Peak and reads densities are averaged along all detectable transcripts based on RNA-seq (see ‘Materials and Methods’). (D) Msi2 recognized motifs are identified from de novo motif search for 3–9 mers in the 3′UTR peaks. The top motif identified for each N-mer search is displayed and positioned to highlight the shared UAG motif. (E) Motif occurrences are tabulated in a +/- 100-nucleotide window surrounding the peak summits for all 3–9mer motifs displayed in panel D (top panel) or UAG (bottom panel). (F) Number of UAG motif (–4) occurrences in a +/- 225-nucleotide window around the peak summit in CLIP sites, flanking region or random 3′UTR background (left panel), with Fisher Exact Test showing motif enrichment in CLIP sites over the flanking region or 3′UTR background (right panel). (G) Gene tracks of Msi2 HITS-CLIP reads for Msi2 bound transcripts. Reads from all libraries were combined and positive strand reads are coloured blue whereas the negative strand reads are coloured green. The UAG motifs and its reverse complement, CUA, in a window around the peak summits are highlighted in red.
Figure 2.
Figure 2.
Loss of Msi2 increases targeted mRNA abundance without affecting TE. (A) Flow-chart of experimental design. (B) Western blot against Msi2 on keratinocytes infected with indicated shRNA lentiviral construct. (C, F) Log2 fold change plotted against Log2 mean expression for RNA-seq (C) and Ribo-seq (F) libraries. Significantly changed genes with FDR < 0.05 plotted in red. (D, G) Cumulative distributions of changes in mRNA abundance (RNA-seq) (D) and ribosome occupancy (Ribo-seq) (G) after Msi2 knockdown. Genes with 3′UTR Msi2-HITS-CLIP peaks are plotted in red, genes without 3′UTR Msi2-HITS-CLIP peaks are plotted in blue. The number of genes in each category is indicated in parenthesis. (E, H) Cumulative distributions as in panels D and G, with genes with one, two or three or more 3′UTR Msi2-HITS-CLIP peaks plotted separately. (I) Comparison of log2 fold-changes for RNA-seq and Ribo-seq. Pearson correlation coefficient displayed. (J) Cumulative distributions of changes in translation efficiency for genes containing or not containing 3′UTR Msi2-HITS-CLIP peaks. (Kolmogorov-Smirnov Test one-sided). (K) Mean log2 fold-changes for RNA-seq, Ribo-seq and translation efficiency for genes containing or not containing 3′UTR Msi2-HITS-CLIP peaks. Standard error of the mean is displayed.
Figure 3.
Figure 3.
Msi2 functions by promoting target mRNA decay. (A) qPCR detection of the expression of selected Msi2 targets in scrambled control and Msi2 knockdown keratinocytes. (n = 4 biological replicates, **P < 0.01; *P < 0.05). (B) RNA-immunoprecipitation of Msi2 complexes with Msi2 or control rabbit IgG antibody, followed by qPCR detection of the selected Msi2 targets using Gapdh and Hprt as non-targeting controls. Relative enrichment was calculated by enrichment over IgG control. Western blot validation of successful Msi2 immunoprecipitation is shown. (**P < 0.01; *P < 0.05). (C) RNA stability curves plotted using qPCR expression versus time. ANCOVA analysis was used in determining statistical significance. Standard error mean is displayed for each time point. (**P < 0.01; *P < 0.05). (D) RNA half-lives in hours calculated from the stability curves. ANCOVA P-values displayed. **P < 0.01; *P < 0.05) (ANCOVA). N.S. not significant.
Figure 4.
Figure 4.
Msi2 targets are highly enriched for regulators of migration and proliferation. (A) Schematic depicting analysis method to extract high-confidence Msi2 targets. (B) Proportion of genes upregulated in combined RNA-seq/Ribo-seq background data, or the identified high-confidence putative Msi2 targets. P value was assessed with Chi-Squared test. (C) Ingenuity Pathway Analysis of genesets derived from panel A. The top terms for molecular and cellular functions are displayed. Note that only genes upregulated upon loss of Msi2 were selected for analysis. (D) Ingenuity Pathway analysis of 88 high confidence Msi2 targets. (E) KEGG Pathway enrichment of 88 high confidence Msi2 targets.
Figure 5.
Figure 5.
Msi2 promotes keratinocyte proliferation. (A) Colony formation assay of keratinocytes with control (MIGR-Vec/shScrCtrl), Msi2 overexpression (MIGR-Msi2/shScrCtrl), Msi2 knockdown (MIGR-Vec/shMsi2) or co-infected (MIGR-Msi2/shMsi2) to rescue Msi2 levels in the knockdown condition. Results are representative of two independent biological samples each assayed in triplicate. (B) Crystal violet quantification of colony forming and western blot of keratinocytes infected with the indicated lentiviral and retroviral constructs to knockdown or overexpress Msi2, respectively. Standard error mean displayed. (C) Growth curves of keratinocytes. Results are representative of n = 2 independent biological replicated plated in duplicate. (D) Cell cycle analysis of EdU pulsed keratinocytes with Ctrl and knockdown of Msi2. Representative chart of cell populations shown with quantification of n = 5 biological replicates. *P < 0.05. (Student T-Test two-way). N.S.: not significant. (E) Propidium iodide and Annexin V flow cytometry analysis performed in triplicate to identify the population of apoptotic cells. Representative result displayed from n = 3 independent experiments (Student T-test two-way).
Figure 6.
Figure 6.
Msi2 inhibits keratinocyte migration and is downregulated during skin wound healing. (A) Cellular migration speed is measured over time for the control and Msi2 knockdown keratinocytes. Data shown are representative of two independent experiments. (B) Average migration speed for the control and Msi2 knockdown keratinocytes. (C) Example cell migration tracks for the control and Msi2 knockdown keratinocytes. (D) Immunofluorescence of a FA marker, Vinculin (green), and an actin marker, Phalloidin (red), for shScr and shMsi2 keratinocytes. Scale bars = 20 μm. (E) Quantification of FA numbers per cell per image for 40 images for shScr and shMsi2 keratinocytes. (F) Western blot for Vinculin, beta-Actin and beta-Tubulin in shScr and shMsi2 cell lines. (G, H) Immunofluorescence of Msi2 (red) and an epithelial cell marker, E-Cadherin (green) or Msi2 (red) and a basal cell marker, Krt5 (green), in a 7-day old skin wound on mouse backskin. Insertions represent regions at the distal or the leading edge of the wounded site. Asterisks (*) represent the granulation tissue at the wounded site. Nuclei are shown in blue. Scale bars = 100 μm (inset = 20 μm). *P < 0.05, **P < 0.01 (Student two-way T-Test).

References

    1. Gerstberger S., Hafner M., Tuschl T. A census of human RNA-binding proteins. Nat. Rev. Genet. 2014;15:829–845. - PMC - PubMed
    1. Nakamura M., Okano H., Blendy J.A., Montell C. Musashi, a neural RNA-binding protein required for Drosophila adult external sensory organ development. Neuron. 1994;13:67–81. - PubMed
    1. Ito T., Kwon H.Y., Zimdahl B., Congdon K.L., Blum J., Lento W.E., Zhao C., Lagoo A., Gerrard G., Foroni L., et al. Regulation of myeloid leukaemia by the cell-fate determinant Musashi. Nature. 2010;466:765–768. - PMC - PubMed
    1. Katz Y., Li F., Lambert N.J., Sokol E.S., Tam W.-L., Cheng A.W., Airoldi E.M., Lengner C.J., Gupta P.B., Yu Z., et al. Musashi proteins are post-transcriptional regulators of the epithelial-luminal cell state. eLife. 2014;3:e03915. - PMC - PubMed
    1. Kharas M.G., Lengner C.J., Al-Shahrour F., Bullinger L., Ball B., Zaidi S., Morgan K., Tam W., Paktinat M., Okabe R., et al. Musashi-2 regulates normal hematopoiesis and promotes aggressive myeloid leukemia. Nat. Med. 2010;16:903–908. - PMC - PubMed

Publication types