. 2016 Apr 15;30(8):918-30.
doi: 10.1101/gad.275891.115. Epub 2016 Mar 31.

An African-specific polymorphism in the TP53 gene impairs p53 tumor suppressor function in a mouse model

Affiliations

An African-specific polymorphism in the TP53 gene impairs p53 tumor suppressor function in a mouse model

Matthew Jennis et al. Genes Dev. .

Abstract

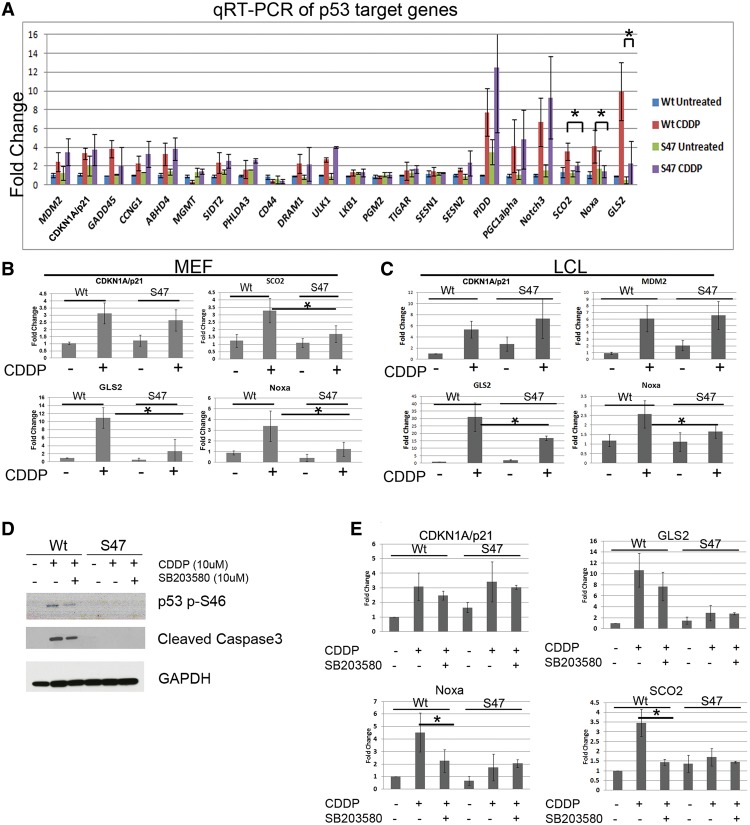
A nonsynonymous single-nucleotide polymorphism at codon 47 in TP53 exists in African-descent populations (P47S, rs1800371; referred to here as S47). Here we report that, in human cell lines and a mouse model, the S47 variant exhibits a modest decrease in apoptosis in response to most genotoxic stresses compared with wild-type p53 but exhibits a significant defect in cell death induced by cisplatin. We show that, compared with wild-type p53, S47 has nearly indistinguishable transcriptional function but shows impaired ability to transactivate a subset of p53 target genes, including two involved in metabolism:Gls2(glutaminase 2) and Sco2 We also show that human and mouse cells expressing the S47 variant are markedly resistant to cell death by agents that induce ferroptosis (iron-mediated nonapoptotic cell death). We show that mice expressing S47 in homozygous or heterozygous form are susceptible to spontaneous cancers of diverse histological types. Our data suggest that the S47 variant may contribute to increased cancer risk in individuals of African descent, and our findings highlight the need to assess the contribution of this variant to cancer risk in these populations. These data also confirm the potential relevance of metabolism and ferroptosis to tumor suppression by p53.

Keywords: Ser46 phosphorylation; ferroptosis; metabolism; p53; polymorphism; tumor suppression.


Figures

Figure 1.
Figure 1.
Reduced DNA damage-mediated apoptosis in cells from the S47 mouse. (A) MEFs were generated from Hupki embryos containing either wild-type (WT) p53 or the S47 variant. MEFs were treated with 20 μM etoposide for 24 h, and protein lysates were analyzed by Western blot for the proteins indicated. The data depicted are representative of multiple experiments in multiple independent batches of MEFs. (B) Quantification of the relative intensity of cleaved lamin A blots from three independent experiments (as depicted in A) in primary MEFs from the wild-type and S47 mice untreated or treated with 20 μM etoposide for 24 h. Error bars mark standard deviation. (C) Immunohistochemical analysis of the small intestine of wild-type (Wt) and S47 Hupki mice 4 h following exposure to 5 Gy of γ irradiation (right panels) or untreated (left panels) for total p53. Bars, 100 μm. (D) Quantification of the number of cells staining positively for p53 antisera in equal millimeters of crypts from the small intestines and colons of mice with wild-type p53 or S47. Error bars mark standard error. IR indicates 5 Gy of ionizing radiation. (E) Immunohistochemical analysis of the small intestine of wild-type and S47 Hupki mice 4 h following exposure to 5 Gy of γ irradiation (right panels) or untreated (left panels) for apoptotic cells (cleaved lamin A). Red arrows mark apoptotic cells. Bars, 100 μm. (F) Quantification of apoptosis in the wild-type and S47 small intestines (left) and colons (right) as cells positive for cleaved lamin A following 5 Gy of radiation. The data depicted are averaged from three fields from three independent experiments in which equal millimeters of crypts were analyzed and quantified. Error bars represent standard deviation. (*) P-value <0.05.
Figure 2.
Figure 2.
Marked impairment of cisplatin-mediated apoptosis in S47 cells and mice. (A) Primary MEFs from the wild-type (Wt) or S47 Hupki mouse were treated with 10 μM cisplatin (CDDP) for the time points indicated, and protein lysates were analyzed by Western blot analysis for the proteins indicated. The data depicted are representative of three independent experiments in a minimum of three independent batches of MEFs. (B) Primary MEFs from the wild-type and S47 mice as well as the p53 knockout mouse (p53−/−) were treated with 10 μM CDDP for 24 h, and protein lysates were analyzed by Western blot analysis for the proteins indicated. (C) Flow cytometric analysis of Annexin V-positive cells from primary wild-type and S47 MEFs treated with 10 μM CDDP for 24 h. The totals represent an average of three independent experiments normalized to untreated controls. Error bars represent standard deviations. (D) IC50 analysis for cisplatin (CDDP) in primary wild-type (WT) and S47 MEFs treated with the indicated concentrations of cisplatin for 72 h and analyzed for viability by the Alamar blue assay. The depicted data represent an average of four independent experiments on independent batches of MEFs. Error bars represent standard deviation. (E) Human LCLs homozygous for wild-type p53 and the S47 variant were treated with 10 μM CDDP for 24 h, and protein lysates were analyzed by Western blot for the proteins indicated. (F) Flow cytometric analysis of Annexin V-positive cells from wild-type and S47 human LCLs treated with 10 μM CDDP for 24 h. The totals represent an average of three independent experiments normalized to untreated controls. Error bars represent standard deviations. (G) IC50 analysis for cisplatin (CDDP) in wild-type and S47 LCLs treated with the indicated concentrations of cisplatin for 48 h and analyzed for viability by Alamar blue staining. The depicted data represent an average of three independent experiments. Error bars represent standard deviation. (H) IC50 analysis for adriamycin in wild-type and S47 LCLs treated with the indicated concentrations of adriamycin for 48 h and analyzed for viability by Alamar blue staining. The depicted data represent an average of three independent experiments. Error bars represent standard deviation. (I) Cisplatin-mediated apoptosis, as assessed by cells positive for cleaved lamin A, in the kidneys of wild-type or S47 mice following injection with 20 mg/kg CDDP and analyzed after 48 h. Data are representative of n = 3 per mice group. Bar, 100 μm. (J) Clonogenic survival of shARF immortalized wild-type and S47 MEFs treated with the indicated concentrations of cisplatin (CDDP), plated at equal cell numbers 48 h later, and stained with crystal violet after 7 d. (K) Quantification of clonogenic survival of immortalized wild-type and S47 MEFs following cisplatin treatment. All values were normalized to the untreated control averaged from three independent experiments. Error bars represent standard deviation. (*) P-value < 0.05.
Figure 3.
Figure 3.
Marked impairment of cisplatin-mediated apoptosis in S47/wild-type heterozygous cells. (A) Primary MEFs from the wild-type (Wt) or S47 Hupki mouse or S47/wild-type heterozygous mice were treated with 10 μM cisplatin (CDDP) for 24 h, and protein lysates were analyzed by Western blot analysis for the proteins indicated. The data depicted are representative of three independent experiments in a minimum of three independent batches of MEFs. (B) Quantification of the relative intensity of cleaved caspase-3 and cleaved lamin A blots from three independent experiments (as depicted in A) in primary MEFs from the wild-type (WT), S47, and S47/wild-type heterozygous mice untreated or treated with 10 μM cisplatin (CDDP) for 24 h. The level of signal in wild-type cells treated with CDDP was set to 100. Error bars mark standard deviation. (C) IC50 analysis for cisplatin (CDDP) in primary wild-type, S47, and S47/wild-type MEFs treated with the indicated concentrations of cisplatin for 72 h and analyzed for viability by the Alamar blue assay. The depicted data represent an average of three independent experiments. Error bars represent standard deviation. (D) Quantification of the relative intensity of cleaved lamin A (black box) and cleaved caspase-3 (gray box) signal from three independent experiments in LCLs that are wild type, S47, or heterozygous (S47/wild type). Cells were untreated or treated with 10 μM cisplatin (CDDP) for 24 h. The level of cleaved lamin A in untreated S47 cells was set to 1, and the fold change is depicted relative to that. The averaged results from three independent experiments with standard deviation are depicted.
Figure 4.
Figure 4.
The S47 variant is impaired for transactivation of a subset of p53 target genes, including Gls2, Noxa (Pmaip1), and Sco2. (A) qRT–PCR analysis of p53 target genes in primary wild-type (Wt) and S47 MEFs treated with 10 μM cisplatin (CDDP) for 24 h. All values were normalized to a control gene (cyclophilin A). Data are averaged from three independent biological replicates. Error bars indicate standard deviation. (*) P < 0.05. (B) qRT–PCR analysis of the p53 target genes indicated in independent batches of primary MEFs from wild-type and S47 mice treated with 10 μM CDDP for 24 h. All values were normalized to a control gene (cyclophilin A). Data are averaged from three independent biological replicates. Error bars indicate standard deviation. (*) P < 0.05. (C) qRT–PCR analysis of the p53 target genes indicated in human LCLs that are homozygous for wild-type p53 or S47 treated with 10 μM CDDP for 24 h. All values were normalized to a control gene (cyclophilin A). Data are averaged from three independent biological replicates. Error bars indicate standard deviation. (*) P ≤0.05. SCO2 was not expressed in LCL cells, so these data are not depicted. (D) Western analysis for the proteins indicated in wild-type and S47 MEFs pretreated with 10 μM p38MAPK inhibitor SB203580 for 2 h followed by 10 μM cisplatin (CDDP) for 24 h. GAPDH served as the loading control. (E) qRT–PCR analysis of the cells in D for the p53 target genes indicated, normalized to control (cyclophilin A). The depicted data represent the average of three independent experiments. Error bars represent standard deviation. (*) P <0.05.
Figure 5.
Figure 5.
Impaired DNA-binding ability of the S47 variant. (A) ChIP of primary wild-type (Wt) and S47 MEFs treated with 10 μM CDDP for 24 h analyzed using antisera to p53 (CM5) or IgG. The percentage binding normalized to input from qPCR analysis is shown. The data depicted are averaged from three independent experiments normalized to input. Error bars represent standard deviation. (*) P-value < 0.05. (B) ChIP analysis of p53 binding to the consensus elements from the genes indicated in human H1299 (p53-null) cells containing doxycycline-inducible wild-type or S47 forms of p53 in the absence and presence of 100 ng/mL doxycycline plus 10 μM cisplatin for 24 h. ChIP was performed using antisera to p53 (fl393G) or normal rabbit IgG. The data depicted are averaged from three independent experiments normalized to input. Error bars represent standard deviation. (*) P-value < 0.05. The IgG results are depicted for the CDKN1A/p21 p53-binding site but were comparable for all other sites analyzed. NOXA was not expressed in this cell line, so this gene was not analyzed.
Figure 6.
Figure 6.
Spontaneous tumorigenesis in S47 but not wild-type mice. (A) Hematoxylin and eosin staining of tumors from the S47 mouse. (Left) Normal liver and liver hepatocellular carcinoma (dotted outline). (Right) Infiltrating B-cell lymphoma in the kidney (arrows). Bar, 100 μm. (B) Hematoxylin and eosin staining of tumors from the S47 mouse. (Top left) Hepatocellular carcinoma. (Top right) Hepatocellular carcinoma metastasized to the lung (dotted outline). (Middle left) Pancreatic ductal adenocarcinoma (asterisks). (Middle right) Pancreatic ductal adenocarcinoma metastasized to a lymph node (asterisk). (Bottom left) Intestinal adenoma. (Bottom right) Stomach adenoma. Bar, 100 μm. (C) Cancer incidence in wild-type and S47 mice and in heterozygous wild-type/S47 mice. The data are representative of a total of 20 S47 and wild-type mice and 12 wild-type/S47 mice; for S47, 16 of these developed cancer. (BCL) B-cell lymphoma; (HCC) hepatocellular carcinoma; (HS) histiocytic sarcoma; (CC) colorectal carcinoma; (PA) pancreatic ductal adenocarcinoma. (D) Kaplan-Meier analysis of survival between wild-type (WT) and S47 mice. n = 20 each. The asterisk represents a single wild-type mouse that died from a noncancerous cause.
Figure 7.
Figure 7.
Impaired ferroptosis in S47 cells. (A) Representative phase-contrast images of primary MEFs containing wild-type p53 (WT), heterozygous S47/wild type, or S47 treated with 4 μM ferroptosis inducer erastin or vehicle (DMSO) for 8 h (magnification 10×). Data represent the average of three independent studies. Bar, 20 μm. (B) Cell viability (Alamar blue) analysis of wild-type, S47/wild-type, or S47 primary MEFs treated with erastin for 72 h. The data represent the average of four independent experiments. Error bars represent standard error of the mean. (C) Western blot analysis for GLS2 in wild-type MEFs, wild-type MEFs infected with a lentiviral short hairpin for Gls2 (shGls2), and S47 MEFs untreated or treated with 4 µM erastin for 24 h. GAPDH served as the loading control. In the bottom panel, the percent viability using the Trypan blue exclusion assay is shown. Error bars represent standard deviation. (D) qRT–PCR analysis of slc7a11 normalized to cyclophilin A. The data are averaged from three independent biological replicates. Error bars represent standard deviation. (E) qRT–PCR analysis of Ptgs2 normalized to cyclophilin A. The data are averaged from three independent biological replicates. Error bars represent standard deviation. (F) Immunoblot analysis for GPX4 in wild-type and S47 MEFs following treatment with 10 µM CDDP for 24 h. (G) Cell viability analysis of wild-type and S47 human LCLs treated with RSL3 for 48 h. The data represent the average of three independent experiments. Error bars represent standard deviation. (H) Trypan blue exclusion analysis of the percent viability in wild-type MEFs or wild-type LCLs exposed to 10 µM CDDP, CDDP plus 2 µM ferrostatin-1 (Fer-1), or CDDP plus 20 µM zVAD-fmk. The data represent the average of three independent experiments. Error bars represent standard deviation. (I) Proposed model depicting the relative abilities of wild-type p53 and S47 to induce senescence, apoptosis, and ferroptosis and suppress spontaneous tumor initiation.

References

    1. Bandele OJ, Wang X, Campbell MR, Pittman GS, Bell DA. 2011. Human single-nucleotide polymorphisms alter p53 sequence-specific binding at gene regulatory elements. Nucleic Acids Res 39: 178–189. - PMC - PubMed
    1. Brady CA, Jiang D, Mello SS, Johnson TM, Jarvis LA, Kozak MM, Kenzelmann Broz D, Basak S, Park EJ, McLaughlin ME, et al. 2011. Distinct p53 transcriptional programs dictate acute DNA-damage responses and tumor suppression. Cell 145: 571–583. - PMC - PubMed
    1. Budanov AV. 2014. The role of tumor suppressor p53 in the antioxidant defense and metabolism. Subcell Biochem 85: 337–358. - PMC - PubMed
    1. Bulavin DV, Saito S, Hollander MC, Sakaguchi K, Anderson CW, Appella E, Fornace AJ Jr. 1999. Phosphorylation of human p53 by p38 kinase coordinates N-terminal phosphorylation and apoptosis in response to UV radiation. EMBO J 18: 6845–6854. - PMC - PubMed
    1. Dixon SJ, Stockwell BR. 2014. The role of iron and reactive oxygen species in cell death. Nat Chem Biol 10: 9–17. - PubMed

Publication types

MeSH terms