. 2016 Feb;9(1):12-42.
doi: 10.1002/sam.11301. Epub 2016 Jan 22.

Cross-validation and Peeling Strategies for Survival Bump Hunting using Recursive Peeling Methods

Affiliations

Cross-validation and Peeling Strategies for Survival Bump Hunting using Recursive Peeling Methods

Jean-Eudes Dazard et al. Stat Anal Data Min. 2016 Feb.

Abstract

We introduce a framework to build a survival/risk bump hunting model with a censored time-to-event response. Our Survival Bump Hunting (SBH) method is based on a recursive peeling procedure that uses a specific survival peeling criterion derived from non/semi-parametric statistics such as the hazards-ratio, the log-rank test or the Nelson--Aalen estimator. To optimize the tuning parameter of the model and validate it, we introduce an objective function based on survival or prediction-error statistics, such as the log-rank test and the concordance error rate. We also describe two alternative cross-validation techniques adapted to the joint task of decision-rule making by recursive peeling and survival estimation. Numerical analyses show the importance of replicated cross-validation and the differences between criteria and techniques in both low and high-dimensional settings. Although several non-parametric survival models exist, none addresses the problem of directly identifying local extrema. We show how SBH efficiently estimates extreme survival/risk subgroups unlike other models. This provides an insight into the behavior of commonly used models and suggests alternatives to be adopted in practice. Finally, our SBH framework was applied to a clinical dataset. In it, we identified subsets of patients characterized by clinical and demographic covariates with a distinct extreme survival outcome, for which tailored medical interventions could be made. An R package PRIMsrc (Patient Rule Induction Method in Survival, Regression and Classification settings) is available on CRAN (Comprehensive R Archive Network) and GitHub.

Keywords: Bump Hunting; Cross-Validation; Exploratory Survival/Risk Analysis; Non-Parametric Method; Patient Rule-Induction Method; Survival/Risk Estimation & Prediction.


Figures

Figure 1
Figure 1
Illustrations of typical successful (left) and failed (center and right) cross-validated tuning profiles of box end-point statistics. Left: Successful peeling stops with a “Replicated CV” optimal peeling length Lrcv (see eq. 19) reached within the [1,Lmrcv] boundaries of possible peeling lengths; Center: Failure to reach a maximum before running out of data; Right: Failure to reach a reliable maximum because of a flat profile. The “Replicated CV” optimal peeling length Lrcv of the peeling trajectory is shown in each plot with the vertical black dashed line. Each colored profile corresponds to one of the replications (B = 128). The cross-validated mean profile of the statistic used in the optimization criterion is shown by the dotted black line with standard error of the sample mean.
Figure 2
Figure 2
Comparison of cross-validated peeling trajectories between situations when either cross-validation technique “Replicated Combined CV” (RCCV) or “Replicated Averaged CV” (RACV) and no cross-validation (NOCV) was done. Results are for simulated model #2 and the LRT statistic used in both peeling and optimization criteria. Compare the trajectory lengths between either cross-validation technique and in the absence of either one. Notice also the flat trajectory profile of covariate x3 in the presence of either cross-validation technique (RACV or RCCV) as opposed to the situation where no cross-validation (NOCV) was done.
Figure 3
Figure 3
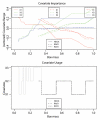
Comparison of cross-validated trace plots of covariate importance VI¯(l) (top) and covariate usage VU¯(l) (bottom) between situations when either cross-validation technique “Replicated Combined CV” (RCCV) or “Replicated Averaged CV” (RACV) and no cross-validation (NOCV) was done. Results are for simulated model #2 and the LRT statistic used in both peeling and optimization criteria. Compare the trace lengths between either cross-validation technique and in the absence of either one. Notice also the flat trace of covariate x3 about 0 in the presence of either cross-validation technique (RACV or RCCV) as opposed to the situation where no cross-validation (NOCV) was done.
Figure 4
Figure 4
Comparison of replicated combined cross-validated results for the peeling trajectories between simulated models #1, #2 and #3 for the “Replicated Combined CV” (RCCV) technique and the LRT statistic used in both peeling and optimization criteria. Notice the usage of all covariates (x1, x2, x3) in model #1 as opposed to the selective usage of covariates (x1, x2) in model #2 and the abortive usage of all covariates in noise model #3.
Figure 5
Figure 5
Comparison of replicated combined cross-validated trace plots of covariate importance VI¯(l) (top )and covariate usage VU¯(l) (bottom) between simulated model #1, #2 and #3 for the “Replicated Combined CV” (RCCV) technique and the LRT statistic used in both peeling and optimization criteria. Notice the usage of all covariates (x1, x2, x3) in model #1 as opposed to the selective usage of covariates (x1, x2) in model #2 and the abortive usage of all covariates in noise model #3.
Figure 6
Figure 6
Comparison of cross-validated Kaplan–Meir survival probability curves of the high-risk (red curve “in-box”) and low-risk (black curve “out-of-box”) groups in simulated models #1, #2, #3 and #4. Results are for the “Replicated Combined CV” (RCCV) technique and the CHS statistic used as peeling criterion and CER used as optimization criteria. Left column: model #1, middle column: model #2, right column: model #3. For conciseness, only the last peeling step of the peeling sequence is shown for each model. Cross-validated LRT, LHR and permutation p-values of “in-box” samples are shown at the bottom of the plot with the corresponding peeling step for each method. P-values p^cv(l)9.7e5 correspond 1/10th of the precision limit (see section 3.4). Notice how the survival curves of “in-box” and “out-of-box” samples separates in models #1, #2 and #4 in contrast to the overlapping situation in noise model #3 with the corresponding significant and non-significant log-rank permutation p-value p^cv(l) of survival distribution separation.
Figure 7
Figure 7
Distributions of RCCV estimates of highest-risk/group end-points, computed over B = 128 repeated Monte Carlo-simulated models #1 and for all competitive non-parametric survival models under study. Comparisons include (i) Survival Bump Hunting (SBH), (ii) Regression Survival Trees (RST), (iii) Random Survival Forest (RSF), (iv) Cox Proportional Hazard Regression (CPHR), (v) Survival Supervised PCA (SSPCA), (vi) Survival Supervised Clustering (SSC). In parenthesis is shown the criterion used for peeling or partitioning as it applies. For each SBH boxplot, the pair of horizontal dotted lines delineates the approximate (95%) confidence interval of the median. Results are for the “Replicated Combined CV” (RCCV) technique and the LRT statistic used in the optimization criteria.
Figure 8
Figure 8
Kaplan–Meier plots of RCCV survival probability curves for all competitive non-parametric survival models under study. Plots are illustrative of one replication out of B = 128. Comparisons include (i) Survival Bump Hunting (SBH), (ii) Regression Survival Trees (RST), (iii) Random Survival Forest (RSF), (iv) Cox Proportional Hazard Regression (CPHR), (v) Survival Supervised PCA (SSPCA), (vi) Survival Supervised Clustering (SSC). In parenthesis is shown the criterion used for peeling or partitioning as it applies. The “in-box” legends (red) corresponds to the highest-risk box/group. Cross-validated LRT, LHR of “in-box” samples are shown at the top of the plot for each method (and that replicate). Results are for the “Replicated Combined CV” (RCCV) technique and the LRT statistic used in the optimization criteria.
Figure 9
Figure 9
Cross-validated tuning profile of the WIHS clinical dataset. The “Replicated Combined CV” cross-validated optimal peeling length (Lrcv=5) is shown with the vertical black dotted line. Each colored profile corresponds to one of the replications (B = 128). The cross-validated mean profile of the LRT statistic is shown by the solid black line with standard error of the sample mean.
Figure 10
Figure 10
Kaplan–Meier plots of RCCV survival probability curves of the WIHS clinical dataset. Each plot represents a step of the peeling sequence. Step #0 corresponds to the situation where the starting box covers the entire test-set data Lk before peeling. The “in-box” legends (red) corresponds to the highest-risk box/group. Cross-validated LRT, LHR and permutation p-values of “in-box” samples are shown at the bottom of the plot with the corresponding peeling step for each method. P-values p^cv(l)9.7e5 correspond to 1/10th of the precision limit (see section 3.4). Notice the single survival curve at Step #0 before peeling and how the survival curves of “in-box” and “out-of-box” samples separates as the peeling progresses.

Similar articles

Cited by

References

    1. Hartigan J, Mohanty S. The runt test for multimodality. Joumal of Classification. 1992;9:63–70.
    1. Rozal G, Hartigan J. The map test for multimodality. Journal of Classification. 1994;11:5–36.
    1. Polonik W. Measuring mass concentration and estimating density contour clusters: an excess mass approach. The Annals of Statistics. 1995;23:855–881.
    1. Burman P, Polonik W. Multivariate mode hunting: Data analytic tools with measures of significance. Journal of Multivariate Analysis. 2009;100:1198–1218.
    1. Bhning D, Seidel W. Editorial: recent developments in mixture models. Comp. Stat. Data Anal. 2003;41(no. 34):349–357.

LinkOut - more resources