. 2016:2016:6051093.
doi: 10.1155/2016/6051093. Epub 2015 Dec 29.

Band 3 Erythrocyte Membrane Protein Acts as Redox Stress Sensor Leading to Its Phosphorylation by p (72) Syk

Affiliations

Band 3 Erythrocyte Membrane Protein Acts as Redox Stress Sensor Leading to Its Phosphorylation by p (72) Syk

Antonella Pantaleo et al. Oxid Med Cell Longev. 2016.

Abstract

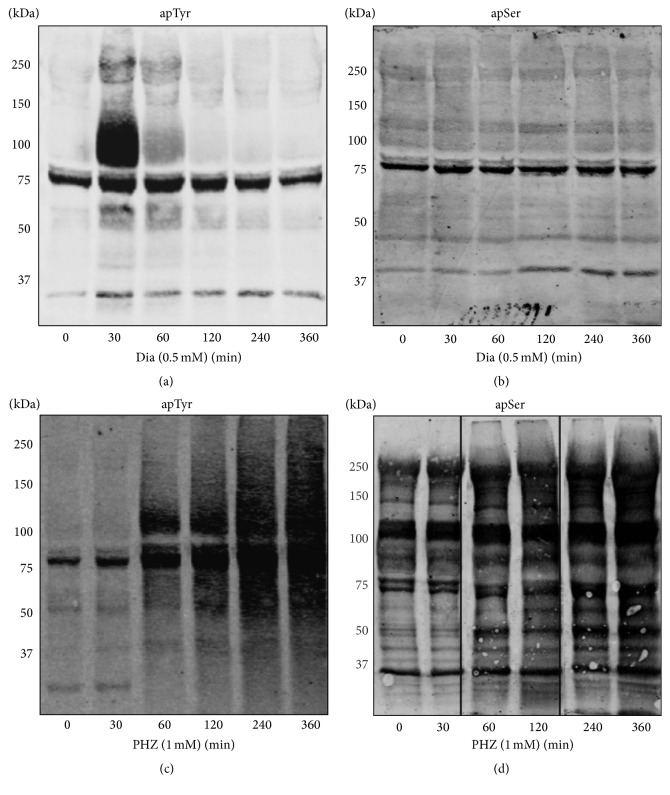
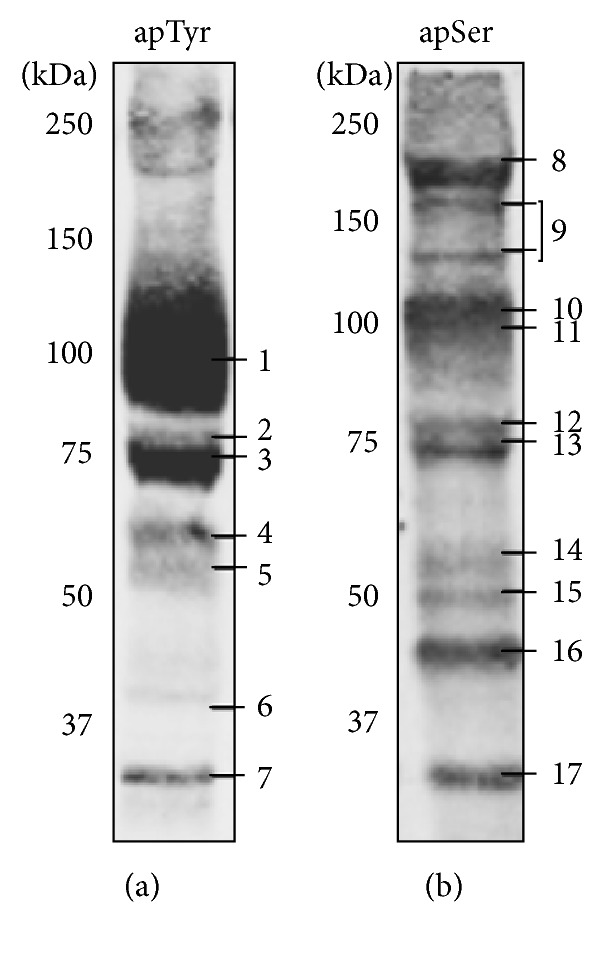
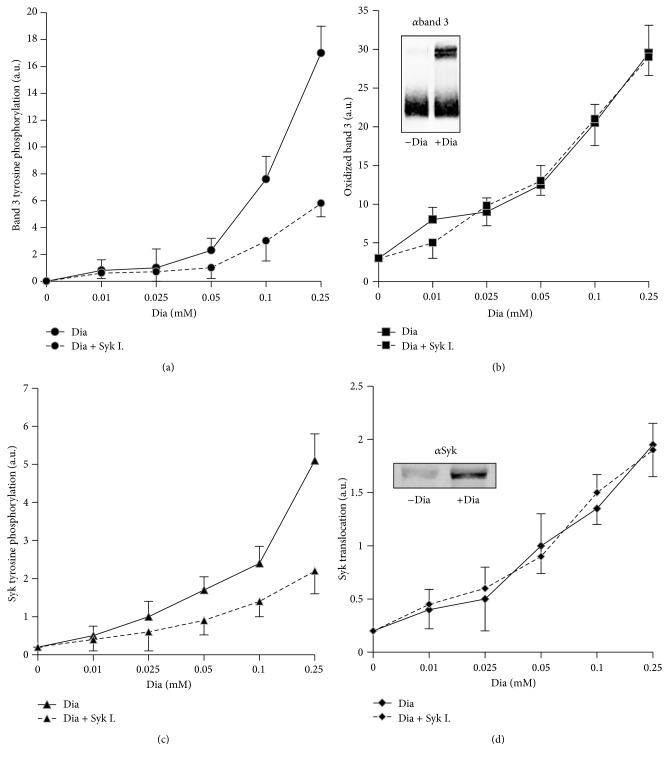
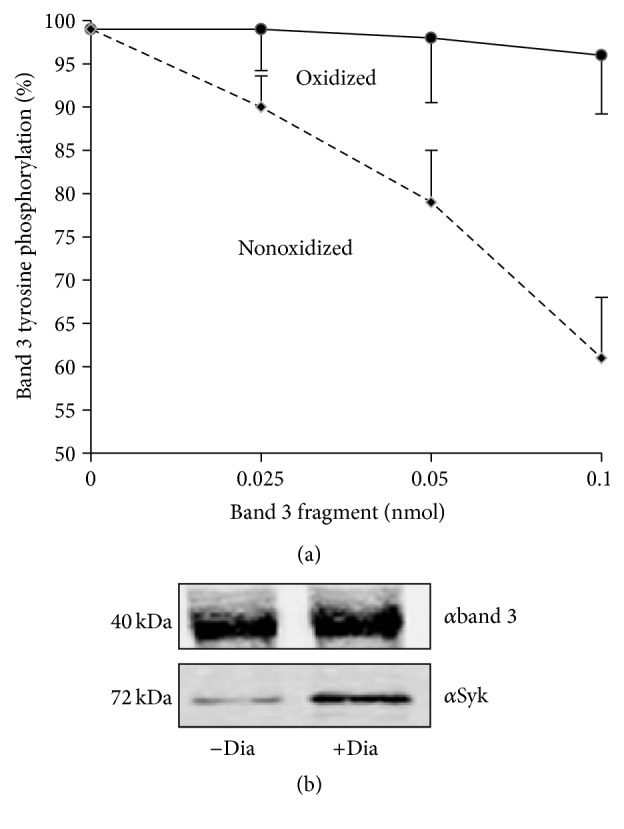
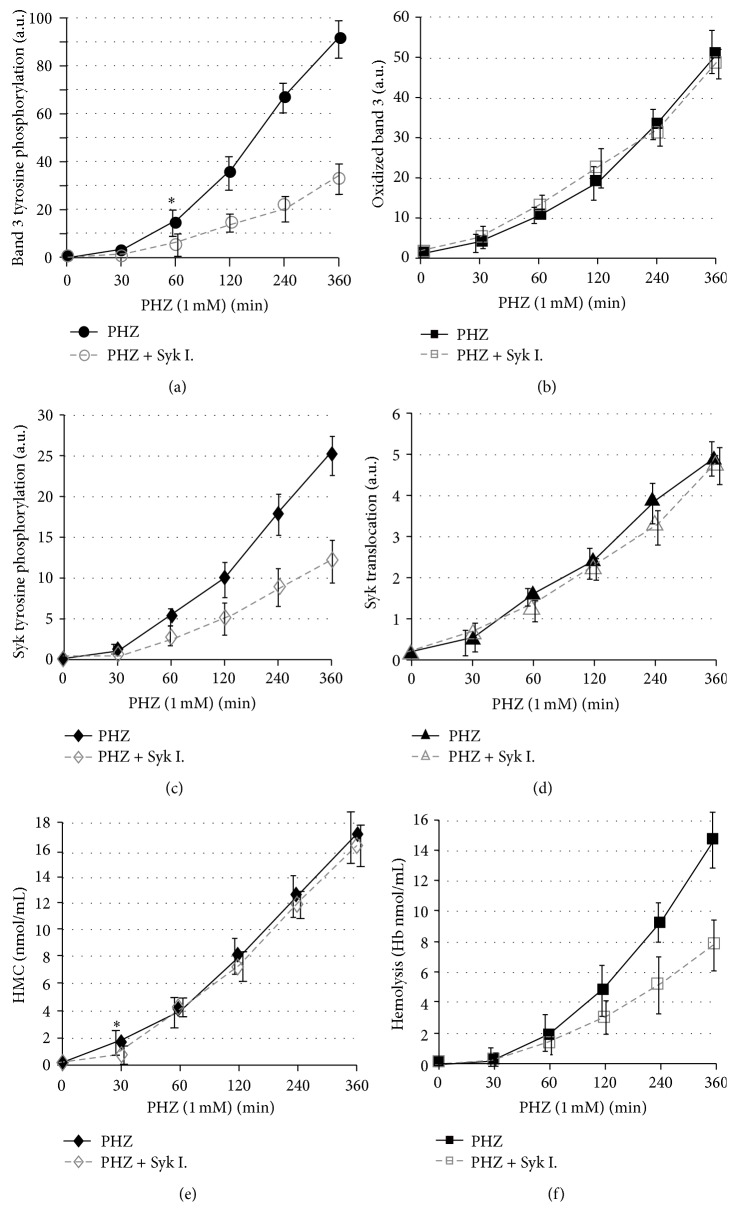
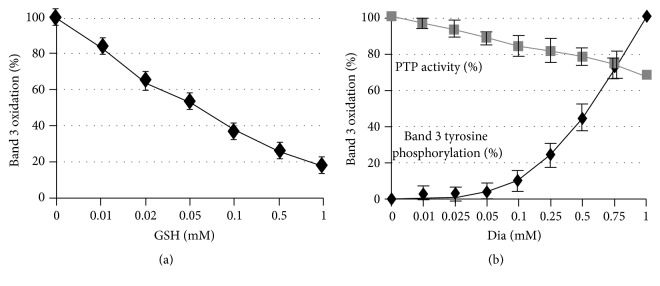
In erythrocytes, the regulation of the redox sensitive Tyr phosphorylation of band 3 and its functions are still partially defined. A role of band 3 oxidation in regulating its own phosphorylation has been previously suggested. The current study provides evidences to support this hypothesis: (i) in intact erythrocytes, at 2 mM concentration of GSH, band 3 oxidation, and phosphorylation, Syk translocation to the membrane and Syk phosphorylation responded to the same micromolar concentrations of oxidants showing identical temporal variations; (ii) the Cys residues located in the band 3 cytoplasmic domain are 20-fold more reactive than GSH; (iii) disulfide linked band 3 cytoplasmic domain docks Syk kinase; (iv) protein Tyr phosphatases are poorly inhibited at oxidant concentrations leading to massive band 3 oxidation and phosphorylation. We also observed that hemichromes binding to band 3 determined its irreversible oxidation and phosphorylation, progressive hemolysis, and serine hyperphosphorylation of different cytoskeleton proteins. Syk inhibitor suppressed the phosphorylation of band 3 also preventing serine phosphorylation changes and hemolysis. Our data suggest that band 3 acts as redox sensor regulating its own phosphorylation and that hemichromes leading to the protracted phosphorylation of band 3 may trigger a cascade of events finally leading to hemolysis.


Figures

Figure 1
Figure 1
Time course of erythrocyte membrane proteins treated with oxidants. Erythrocytes were treated with 0.5 mM diamide (Dia) (panels (a) and (b)) and with 1 mM phenylhydrazine (PHZ) (panels (c) and (d)) at different incubation times. Membrane proteins were separated by 8% SDS-PAGE in the presence of reducing agent, blotted on nitrocellulose and stained with anti-phosphotyrosine (apTyr) and anti-phosphoserine (apSer) antibodies. Images were acquired using a laser IR fluorescence detector (Odyssey, Licor, USA). Results are representative of 4 separated experiments.
Figure 2
Figure 2
Protein phosphorylation analysis by mass spectrometry. Tyrosine phosphorylated proteins after 30-minute incubation of RBCs with 0.5 mM diamide (a) and serine phosphorylated proteins after 2-hour incubation of RBCs with 1 mM PHZ (b). Phosphorylated proteins were analyzed by mass spectrometry (MALDI-TOF) (Table 1). Band numbering in panels (a) and (b) identifies the proteins listed in Table 1.
Figure 3
Figure 3
Band 3 modifications and Syk activation following diamide treatment. RBCs were treated with increasing concentration of diamide for 30 min in the presence or in the absence of 10 µM Syk inhibitor II (Syk I.). Band 3 tyrosine phosphorylation (panel (a)). Band 3 oxidative crosslinking (oxidized band 3, Dia) expressed as the amount of oligomeric band 3 (apparent M.W. higher than 200 KDa) under nonreducing conditions (panel (b)). Syk tyrosine phosphorylation measured in whole cellular extracts (panel (c)). Syk bound to the membranes (Syk translocation) (panel (d)). Western blotting was quantified using an IR fluorescence detection scanner (Odyssey, Licor, USA). Images were analyzed by Odyssey V3.0 software. Values are representative of 4 separated experiments and are expressed as arbitrary units (au); the bars represent the standard deviations.
Figure 4
Figure 4
Competitive effect of oxidized and nonoxidized cdbd3 on band 3 phosphorylation and its association with Syk. Band 3 Tyr phosphorylation was measured in membranes obtained from diamide treated RBCs in the presence of RBC cytoplasm at increasing concentration of oxidized or nonoxidized cdbd3. The level of band 3 phosphorylation is displayed as percentage of its maximal phosphorylation absence of cdbd3 (panel (a)). Nonoxidized (−Dia) cdbd3 and oxidized (+Dia) cdbd3 were incubated with RBC cytoplasm and immunoprecipitated by anti-cdbd3 antibody. Immunoprecipitated proteins were western blotted with anti-band 3 (panel (a)) and anti-Syk antibody (panel (b)). Western blots are representative of 4 separated experiments.
Figure 5
Figure 5
Band 3 modifications, hemichrome formation, and hemolysis after phenylhydrazine treatment. Erythrocytes were treated with 1 mM phenylhydrazine (PHZ) at different incubation times in the presence or in the absence of Syk inhibitor II (Syk I.). Band 3 tyrosine phosphorylation (panel (a)), oxidized band 3 (panel (b)), Syk phosphorylation (panel (c)), and Syk translocation (panel (d)) were quantified acquiring anti-phosphotyrosine, anti-band 3, and anti-Syk western blots using an IR fluorescence detection scanner (Odyssey, Licor, USA) and analyzing images with Odyssey V3.0 software. Values are the average of 5 separated experiments and are expressed as arbitrary units (au); the bars represent the standard deviations. Hemichromes (HMC) were quantified by vis spectrometry (panel (e)), hemolysisby measuring hemoglobin absorbance at 405 nm (panel (f)) and are expressed in nmoles/mL. indicates the minimal concentration or shorter incubation time that determines a statistically significant change by Student's t-test in comparison to the control sample (p < 0.01).
Figure 6
Figure 6
Comparative analysis of Syk kinase and protein Tyr phosphatase activities following diamide treatment. Erythrocyte membranes were treated with 0.1 mM diamide in the presence of increasing concentrations of GSH. Band 3 oxidation (percentage of maximal oxidation, in the absence of GSH) is showed in panel (a). Tyr kinase activity was measured as band 3 tyrosine phosphorylation at different diamide concentrations and expressed as percentage of maximal phosphorylation. PTP activity was measured as dephosphorylation of Tyr phosphorylated band 3 (obtained treating RBCs with 1 mM diamide) and expressed as percentage of maximal PTP activity (panel (b)). Band 3 oxidation and phosphorylation were quantified by Odyssey V3.0 software. Values are average of 3 separated experiments; the bars represent the standard deviations.

References

    1. Çimen M. Y. B. Free radical metabolism in human erythrocytes. Clinica Chimica Acta. 2008;390(1-2):1–11. doi: 10.1016/j.cca.2007.12.025. - DOI - PubMed
    1. Xiang W., Weisbach V., Sticht H., et al. Oxidative stress-induced posttranslational modifications of human hemoglobin in erythrocytes. Archives of Biochemistry and Biophysics. 2013;529(1):34–44. doi: 10.1016/j.abb.2012.11.002. - DOI - PubMed
    1. Cappellini M., Fiorelli G. Glucose-6-phosphate dehydrogenase deficiency. The Lancet. 2008;371(9606):64–74. doi: 10.1016/s0140-6736(08)60073-2. - DOI - PubMed
    1. Arese P., Mannuzzu L., Turrini F. Pathophysiology of favism. Folia Haematologica. 1989;116(5):745–752. - PubMed
    1. Fibach E., Rachmilewitz E. The role of oxidative stress in hemolytic anemia. Current Molecular Medicine. 2008;8(7):609–619. doi: 10.2174/156652408786241384. - DOI - PubMed

Publication types

MeSH terms