Review
. 2016:2016:3467832.
doi: 10.1155/2016/3467832. Epub 2016 Jan 13.

Spindle Bursts in Neonatal Rat Cerebral Cortex

Affiliations
Review

Spindle Bursts in Neonatal Rat Cerebral Cortex

Jenq-Wei Yang et al. Neural Plast. 2016.

Abstract

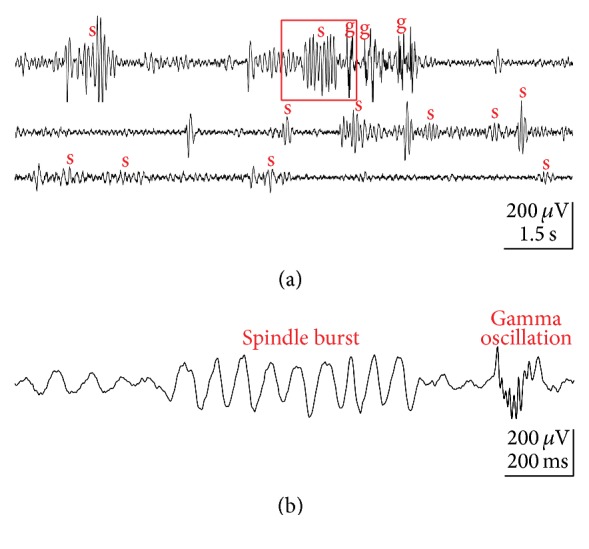
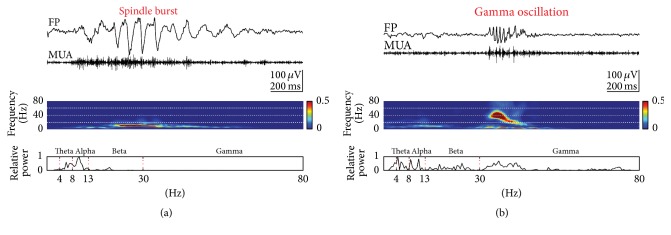
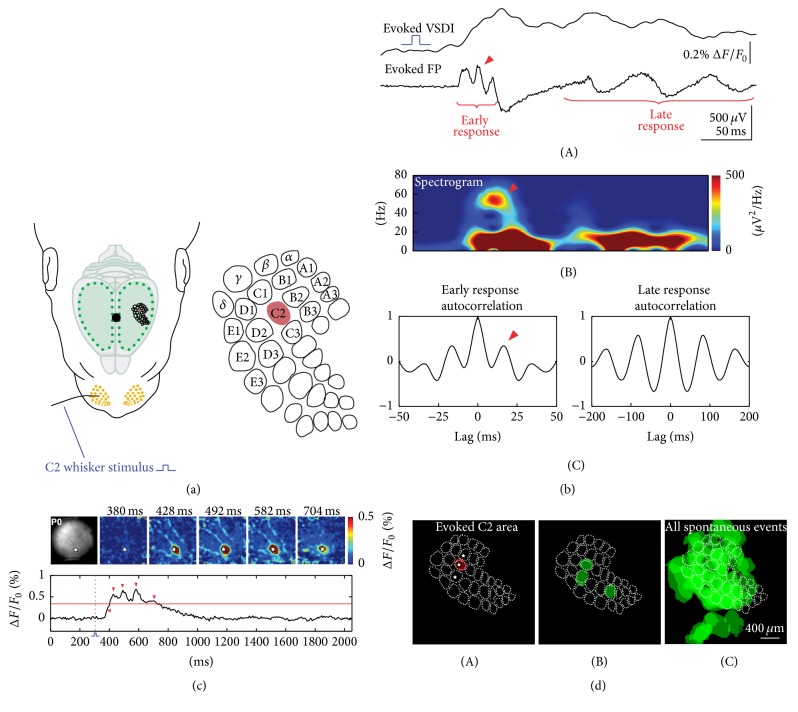
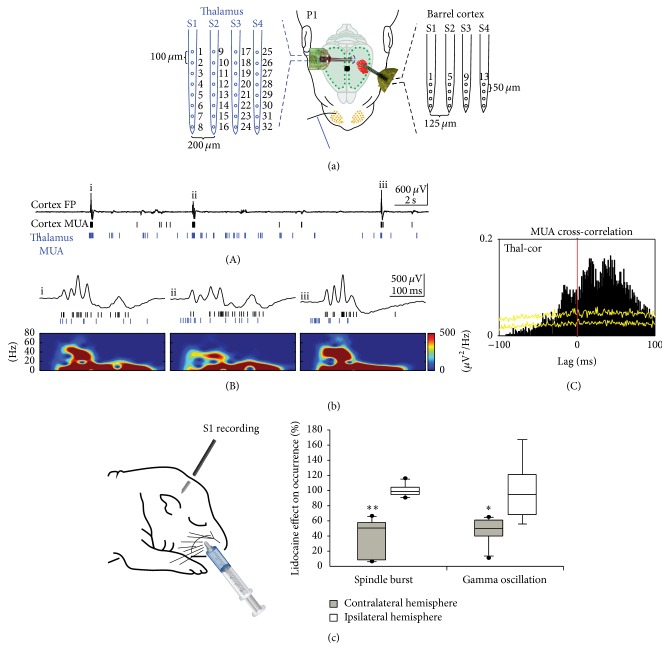
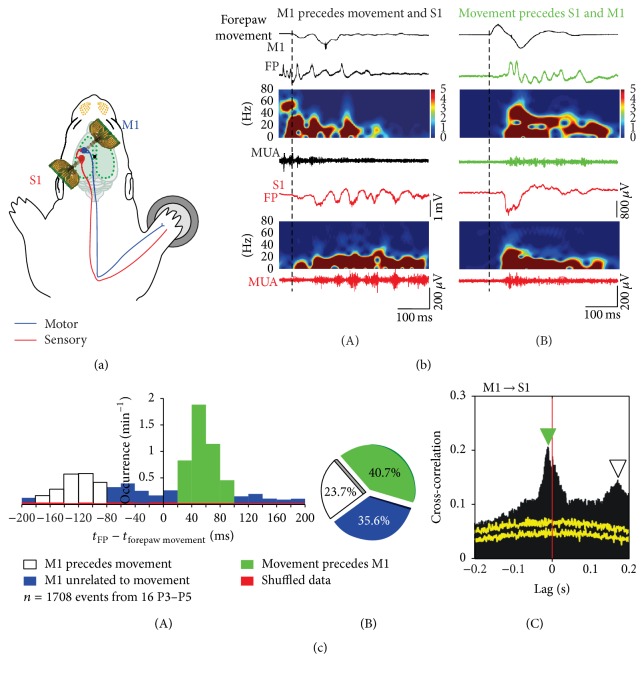
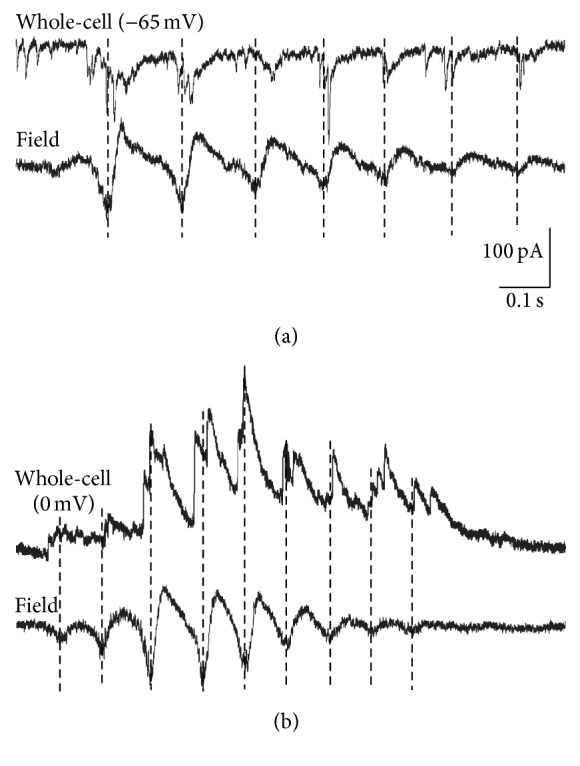
Spontaneous and sensory evoked spindle bursts represent a functional hallmark of the developing cerebral cortex in vitro and in vivo. They have been observed in various neocortical areas of numerous species, including newborn rodents and preterm human infants. Spindle bursts are generated in complex neocortical-subcortical circuits involving in many cases the participation of motor brain regions. Together with early gamma oscillations, spindle bursts synchronize the activity of a local neuronal network organized in a cortical column. Disturbances in spindle burst activity during corticogenesis may contribute to disorders in cortical architecture and in the activity-dependent control of programmed cell death. In this review we discuss (i) the functional properties of spindle bursts, (ii) the mechanisms underlying their generation, (iii) the synchronous patterns and cortical networks associated with spindle bursts, and (iv) the physiological and pathophysiological role of spindle bursts during early cortical development.


Figures

Figure 1
Figure 1
Spontaneous network activity recorded with an extracellular electrode array in primary somatosensory cortex of a P3 rat under light urethane anesthesia. (a) Continuous field potential (FP) recording showing several spindle bursts (s) and gamma oscillations (g). (b) Example of spindle burst and gamma oscillation marked in (a) by red box and displayed at expanded timescale. Reproduced with permission from [17].
Figure 2
Figure 2
Properties of spontaneous spindle bursts and gamma oscillations. (a) Spindle burst recorded in barrel cortex of a P1 rat (top) and corresponding MUA after 200 Hz high-pass filtering (below). Color-coded frequency plot shows the wavelet spectrum of the field potential recording at identical timescale. Fast Fourier Transformation (FFT) of the field potential recording illustrating the relative power of the displayed spindle burst with maximal power at 10 Hz frequency (bottom). (b) Gamma oscillation (top) recorded in barrel cortex of a P3 rat and corresponding MUA (below). Wavelet and FFT spectrum reveal prominent gamma activity between 30 and 50 Hz. Reproduced with permission from [17].
Figure 3
Figure 3
Stimulus-evoked (a–c) and spontaneous (d) network activity recorded in barrel cortex of newborn rats in vivo. (a) Schematic illustration of the experimental setup for selective mechanical stimulation of a single whisker (here whisker C2) (left). Black dot indicates bregma position. Schematic illustration of the barrel field with localization of the C2 barrel (red area) as revealed by stimulation of different single whiskers and monitoring the resulting VSDI response (right). (b) Cortical VSDI and simultaneous FP response to single whisker stimulation in a P1 rat. Note presence of early gamma oscillation followed by late spindle burst in the FP response (A) with typical frequency distribution in the corresponding spectrogram plot (B) and autocorrelograms (C). (c) VSDI in the barrel cortex of a P0 rat following C2 whisker stimulation at the time point of 300 ms (red-dotted line). The localization of the C2-whisker representation in the barrel cortex and 5 successive poststimulus VSDI responses are shown in the upper rows. White stars indicate the center of the C2-whisker-evoked response. Lower rows show 2 s long optical recordings in which the time points of the 5 successive frames are marked by red arrow heads. Red horizontal line indicates the half-maximal response amplitude. Note that the evoked activity is restricted to the C2 barrel and does not propagate to neighbouring columns as in slightly older animals (for more information see [18]). (d) Spontaneous gamma-spindle activity synchronizes early cortical columns. Single whisker stimulation-induced VSDI response (here C2 whisker) recorded in the barrel cortex of a P1 rat (A). The barrel field map was generated on the basis of a cytochrome oxidase stained horizontal section and aligned according to the evoked VSDI responses to single whisker stimulation. White star marks the center of the activated barrel-related columns B2, C2, and D2. Three single spontaneous events localized in a single (pre-) barrel-related column (B) and overlay of all spontaneous events ((C), n = 75) recorded in this P1 rat. Note complete coverage of the whole barrel field map by local spontaneous oscillations. Reproduced with permission from [18].
Figure 4
Figure 4
Subcortical origin of spontaneous spindle bursts and gamma oscillations. (a) Schematic illustration of the experimental setup for simultaneous multichannel recordings of sensory evoked and spontaneous activity in both the thalamus and barrel cortex of a newborn rat. A 4-shank 32-channel electrode is located in the ventral posteromedial nucleus (VPM) of the thalamus (blue) and a 4-shank 16-channel electrode in the cortex (black). (b) Simultaneous 40 s recording of spontaneously occurring activity in the barrel cortex and VPM thalamus of a P1 rat. Upper trace represents the cortical FP recording; cortical (black bars) and thalamic MUA (blue bars) are presented below (A). The 3 spontaneous events i–iii marked in (A) are shown at higher resolution with corresponding spectrograms (B). Cross-correlogram of the spontaneous multiunit activity recorded simultaneously in the thalamus and barrel cortex (C). Yellow lines represent results from the shuffled dataset (for details see [18]). (c) Inactivation of the sensory periphery by injection of 2% lidocaine into the whisker pad (left) causes a significant reduction in the relative occurrence of spindle bursts and gamma oscillations recorded in the contralateral barrel cortex of 6 newborn rats (filled bars), whereas both activity patterns in the ipsilateral cortex are not affected (open bars). Data are expressed as box plots, and asterisks mark significant differences P < 0.05 and ∗∗ P < 0.01. Reproduced with permission from [18] (a, b) and from [17] (c).
Figure 5
Figure 5
Movement-correlated synchrony of spontaneous network activity in S1 and primary motor cortex (M1) in newborn rat in vivo. (a) Schematic illustration of the experimental setup with multielectrode arrays in S1 (red) and M1 (blue). Piezo element attached to the contralateral forepaw monitors movements. Blue line indicates the motor pathway and red line the sensory pathway. (b) Relationship between forepaw movements and cortical activity in S1 and M1 in a P4 rat. (A) Spontaneous activity in M1 (black) elicited forepaw movement and preceded spindle burst in S1 (red). Black dashed line indicates time point of forepaw movement. Top black trace shows forepaw movement. (B) Spontaneous forepaw movement preceded activity in M1 (green) and spindle burst in S1 (red). (c) Relationship between spontaneous activity in M1 and S1 and forepaw movements. (A) Bar diagram illustrating the occurrence of FP activity, which preceded forepaw movements (blank box), followed forepaw movements (green), and were unrelated to movement (blue) in 16 P3–P5 rats. Red bars represent results from the shuffled dataset. (B) Pie diagram showing the percentages of the three patterns (1708 events from 16 P3–P5 rats during 10 min unstimulated recordings). (C) Cross-correlation of MUA between S1 and M1. Note that S1 MUA precedes M1 MUA (green arrowhead) and M1 MUA precedes S1 MUA (blank arrowhead). Yellow traces represent results from the shuffled dataset. Reproduced with permission from [19].
Figure 6
Figure 6
Synaptic events underlying a spindle burst recorded in S1 of a P6 rat in vivo. (a) Simultaneous registration of membrane currents (upper trace) and local field potential (lower trace). In this recording the membrane potential was held at −65 mV to isolate glutamatergic postsynaptic currents (PSCs). Note that the glutamatergic PSCs are phase locked to the field potential oscillations. (b) Recording at a holding potential of 0 mV to isolate GABAergic PSCs. Note that GABAergic PSCs are also phase locked to the field potential oscillations. Reproduced with permission from [14].

Similar articles

Cited by

References

    1. Khazipov R., Luhmann H. J. Early patterns of electrical activity in the developing cerebral cortex of humans and rodents. Trends in Neurosciences. 2006;29(7):414–418. doi: 10.1016/j.tins.2006.05.007. - DOI - PubMed
    1. Hanganu-Opatz I. L. Between molecules and experience: role of early patterns of coordinated activity for the development of cortical maps and sensory abilities. Brain Research Reviews. 2010;64(1):160–176. doi: 10.1016/j.brainresrev.2010.03.005. - DOI - PubMed
    1. Kilb W., Kirischuk S., Luhmann H. J. Electrical activity patterns and the functional maturation of the neocortex. European Journal of Neuroscience. 2011;34(10):1677–1686. doi: 10.1111/j.1460-9568.2011.07878.x. - DOI - PubMed
    1. Kirkby L. A., Sack G. S., Firl A., Feller M. B. A role for correlated spontaneous activity in the assembly of neural circuits. Neuron. 2013;80(5):1129–1144. doi: 10.1016/j.neuron.2013.10.030. - DOI - PMC - PubMed
    1. André M., Lamblin M.-D., d'Allest A. M., et al. Electroencephalography in premature and full-term infants. Developmental features and glossary. Neurophysiologie Clinique. 2010;40(2):59–124. doi: 10.1016/j.neucli.2010.02.002. - DOI - PubMed

Publication types

LinkOut - more resources