

Infections on Temporal Networks--A Matrix-Based Approach
- PMID: 27035128
- PMCID: PMC4817993
- DOI: 10.1371/journal.pone.0151209
Infections on Temporal Networks--A Matrix-Based Approach
Abstract
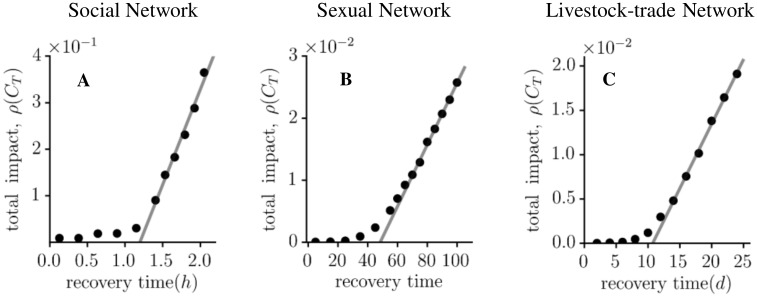
We extend the concept of accessibility in temporal networks to model infections with a finite infectious period such as the susceptible-infected-recovered (SIR) model. This approach is entirely based on elementary matrix operations and unifies the disease and network dynamics within one algebraic framework. We demonstrate the potential of this formalism for three examples of networks with high temporal resolution: networks of social contacts, sexual contacts, and livestock-trade. Our investigations provide a new methodological framework that can be used, for instance, to estimate the epidemic threshold, a quantity that determines disease parameters, for which a large-scale outbreak can be expected.
Conflict of interest statement
Figures
Similar articles
-
Epidemic thresholds in dynamic contact networks.J R Soc Interface. 2009 Mar 6;6(32):233-41. doi: 10.1098/rsif.2008.0218. J R Soc Interface. 2009. PMID: 18664429 Free PMC article.
-
Analysis of a stochastic SIR epidemic on a random network incorporating household structure.Math Biosci. 2010 Apr;224(2):53-73. doi: 10.1016/j.mbs.2009.12.003. Epub 2009 Dec 22. Math Biosci. 2010. PMID: 20005881
-
Epidemic progression on networks based on disease generation time.J Biol Dyn. 2013;7(1):148-60. doi: 10.1080/17513758.2013.819127. J Biol Dyn. 2013. PMID: 23889499 Free PMC article.
-
Finding the probability of infection in an SIR network is NP-Hard.Math Biosci. 2012 Dec;240(2):77-84. doi: 10.1016/j.mbs.2012.07.002. Epub 2012 Jul 20. Math Biosci. 2012. PMID: 22824138 Free PMC article. Review.
-
Epidemionics: from the host-host interactions to the systematic analysis of the emergent macroscopic dynamics of epidemic networks.Virulence. 2010 Jul-Aug;1(4):338-49. doi: 10.4161/viru.1.4.12196. Virulence. 2010. PMID: 21178467 Review.
Cited by
-
When resolution does matter: Modelling indirect contacts in dairy farms at different levels of detail.PLoS One. 2019 Oct 17;14(10):e0223652. doi: 10.1371/journal.pone.0223652. eCollection 2019. PLoS One. 2019. PMID: 31622376 Free PMC article.
-
Effective distances for epidemics spreading on complex networks.Phys Rev E. 2017 Jan;95(1-1):012313. doi: 10.1103/PhysRevE.95.012313. Epub 2017 Jan 17. Phys Rev E. 2017. PMID: 28208446 Free PMC article.
-
From networks to optimal higher-order models of complex systems.Nat Phys. 2019 Apr;15(4):313-320. doi: 10.1038/s41567-019-0459-y. Epub 2019 Mar 25. Nat Phys. 2019. PMID: 30956684 Free PMC article.
-
The reachability of contagion in temporal contact networks: how disease latency can exploit the rhythm of human behavior.BMC Infect Dis. 2018 May 15;18(1):219. doi: 10.1186/s12879-018-3117-6. BMC Infect Dis. 2018. PMID: 29764399 Free PMC article.
References
-
- Broder A, Kumar R, Maghoul F, Raghavan P, Rajagopalan S, Stata R, et al. Graph structure in the web. Computer networks. 2000;33(1):309–320. 10.1016/S1389-1286(00)00083-9 - DOI
-
- Barabasi AL, Jeong H, Néda Z, Ravasz E, Schubert A, Vicsek T. Evolution of the social network of scientific collaborations. Physica A. 2002;311(3–4):590–614. 10.1016/S0378-4371(02)00736-7 - DOI
-
- Colizza V, Pastor-Satorras R, Vespignani A. Reaction-diffusion processes and metapopulation models in heterogeneous networks. Nature Phys. 2007;3:276.
-
- Van den Broeck W, Gioannini C, Goncalves B, Quaggiotto M, Colizza V, Vespignani A. The GLEaMviz computational tool, a publicly available software to explore realistic epidemic spreading scenarios at the global scale. BMC Infectious Diseases. 2011;11(1):37 10.1186/1471-2334-11-37 - DOI - PMC - PubMed
Publication types
MeSH terms
LinkOut - more resources
Full Text Sources
Other Literature Sources
Medical
