. 2016 Jun;35(6):3216-26.
doi: 10.3892/or.2016.4727. Epub 2016 Apr 1.

Suppression of STAT5b in pancreatic cancer cells leads to attenuated gemcitabine chemoresistance, adhesion and invasion

Affiliations

Suppression of STAT5b in pancreatic cancer cells leads to attenuated gemcitabine chemoresistance, adhesion and invasion

Hiroki Sumiyoshi et al. Oncol Rep. 2016 Jun.

Abstract

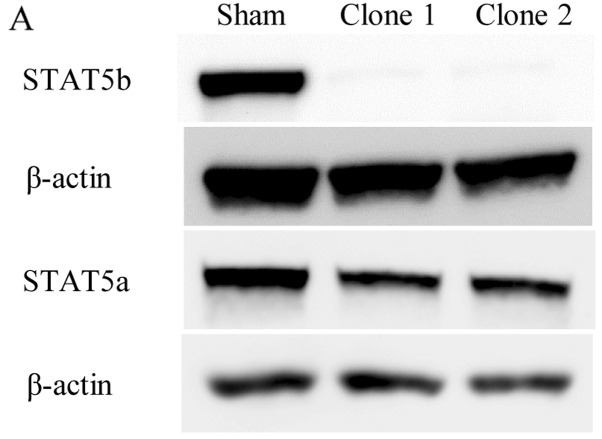
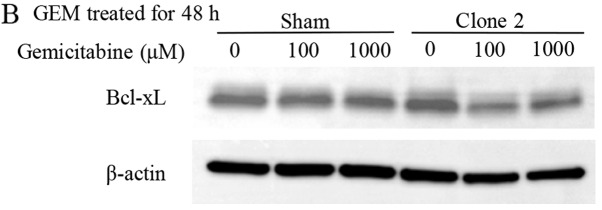
Pancreatic ductal adenocarcinoma (PDAC) is one of the most lethal solid malignancies, and there is an urgent need for new therapeutic strategies based on the molecular biology of PDAC. Signal transducers and activators of transcription 5 (STAT5) are known to be activated in a variety of malignancies and involved in tumor proliferation, apoptosis, and invasion, whereas the expression and biological role of STAT5b in PDAC are less clearly defined. In the present study, we examined the expression and role of STAT5b in human pancreatic cancer cell lines. Expressions of STAT5b mRNA and protein were detected in eight kinds of pancreatic cancer cells. Confocal microscopy and western blot analysis indicated that STAT5b is localized in both cytoplasm and nuclei. Immunoprecipitation analysis revealed tyrosine phosphorylation of STAT5b in pancreatic cancer cells. These results indicate that STAT5b in pancreatic cancer cells is constitutively activated. STAT5b shRNA clones in PANC-1 cells, which express relatively high levels of STAT5b, exhibited reduced chemoresistance against gemcitabine, adhesion and invasion compared to sham. On the other hand, AsPC-1 and BxPC3 cells, which express relatively low levels of STAT5b, exhibited reduced chemoresistance compared to PANC-1 cells. Moreover, STAT5b overexpression clones in AsPC-1 cells exhibited increased chemoresistance compared to sham. STAT5b shRNA clones in PANC-1 cells were more sensitive to the proapoptotic actions of gemcitabine, as evidenced by PARP and cleaved caspase-3 activation. Gemcitabine also significantly reduced Bcl-xL levels in the STAT5b shRNA-expressing cells. We also investigated the clinicopathological characteristics of STAT5b expression of PDAC. Although a significant correlation between STAT5b expression and overall survival rates was not observed, a significant correlation with main pancreatic duct invasion was observed. These findings suggest that STAT5b confers gemcitabine chemoresistance and promotes cell adherence and invasiveness in pancreatic cancer cells. Targeting STAT5b may lead to novel therapeutic strategies for PDAC.


Figures

Figure 1
Figure 1
Expression of STAT5b mRNA and protein in pancreatic cancer cells. (A) Quantitative RT-PCR analysis of STAT5b mRNA levels. STAT5b mRNA expressed in all pancreatic cancer cell lines, and the levels were highest in PANC-1 cells, second highest in Capan-1 cells, and lowest in PK-45H cells. In PANC-1 cells, STAT5b mRNA levels were ~13.5-fold higher than in PK-45H cells. (B) Western blot analysis of STAT5b protein levels. STAT5b protein was detected in all cell lines consistent with the RT-PCR results and the levels were highest in PANC-1 cells and second highest in Capan-1 cells.
Figure 1
Figure 1
Expression of STAT5b mRNA and protein in pancreatic cancer cells. (A) Quantitative RT-PCR analysis of STAT5b mRNA levels. STAT5b mRNA expressed in all pancreatic cancer cell lines, and the levels were highest in PANC-1 cells, second highest in Capan-1 cells, and lowest in PK-45H cells. In PANC-1 cells, STAT5b mRNA levels were ~13.5-fold higher than in PK-45H cells. (B) Western blot analysis of STAT5b protein levels. STAT5b protein was detected in all cell lines consistent with the RT-PCR results and the levels were highest in PANC-1 cells and second highest in Capan-1 cells.
Figure 2
Figure 2
Localization and activation of STAT5b in PANC-1 and MIA PaCa-2 pancreatic cancer cells. (A) Confocal microscopy analysis. Both PANC-1 and MIA PaCa-2 cells were subjected to immunofluorescent staining for STAT5b (green, Alexa Fluor 488). Nuclei were stained with Hoechst 33258 dye (blue). STAT5b was distributed in the nuclei and cytoplasm (representative sections, original magnification, ×100). (B) Western blotting after cell fractionation. PANC-1 and MIA PaCa-2 cells were fractionated into nuclear and cytoplasmic fractions and subjected to western blotting. Antibodies were directed against STAT5b and lamin B1 to validate fraction purity and protein loading. In agreement with the results of confocal microscopy analysis, STAT5b protein was detected in both nuclei and cytoplasm. (C) Immunoprecipitation and western blotting. The cell lysates were immunoprecipitated (IP) with anti-STAT5b antibody followed by western blotting with anti-phosphotyrosine (PY) or anti-STAT5b antibodies. This analysis demonstrated the phosphorylation of STAT5b in the same two pancreatic cancer cell types.
Figure 2
Figure 2
Localization and activation of STAT5b in PANC-1 and MIA PaCa-2 pancreatic cancer cells. (A) Confocal microscopy analysis. Both PANC-1 and MIA PaCa-2 cells were subjected to immunofluorescent staining for STAT5b (green, Alexa Fluor 488). Nuclei were stained with Hoechst 33258 dye (blue). STAT5b was distributed in the nuclei and cytoplasm (representative sections, original magnification, ×100). (B) Western blotting after cell fractionation. PANC-1 and MIA PaCa-2 cells were fractionated into nuclear and cytoplasmic fractions and subjected to western blotting. Antibodies were directed against STAT5b and lamin B1 to validate fraction purity and protein loading. In agreement with the results of confocal microscopy analysis, STAT5b protein was detected in both nuclei and cytoplasm. (C) Immunoprecipitation and western blotting. The cell lysates were immunoprecipitated (IP) with anti-STAT5b antibody followed by western blotting with anti-phosphotyrosine (PY) or anti-STAT5b antibodies. This analysis demonstrated the phosphorylation of STAT5b in the same two pancreatic cancer cell types.
Figure 3
Figure 3
Effects of STAT5b shRNA on STAT5b levels on the growth of PANC-1 cells. (A) Western blot analysis of STAT5b and STAT5a protein levels after stable transfection. PANC-1 cells, which expressed relatively high levels of STAT5b mRNA and protein, were stably transfected with a plasmid vector encoding shRNAs targeting the STAT5b transcripts. Two kinds of clones transfected with the STAT5b shRNAs exhibited the inhibition of STAT5b and uninhibited STAT5a (the isoform of STAT5) expression after transfection. (B) Cell proliferation assay after the stable transfection. Sham and two kinds of STAT5b shRNA expressing clones were seeded in a 96-well plate at a density of 8.0×10³ cells/well and incubated at 37°C for 24, 48 or 72 h. After the indicated time, there was no significant difference at all in cell proliferation capability between sham and both STAT5b shRNA expressing clones.
Figure 3
Figure 3
Effects of STAT5b shRNA on STAT5b levels on the growth of PANC-1 cells. (A) Western blot analysis of STAT5b and STAT5a protein levels after stable transfection. PANC-1 cells, which expressed relatively high levels of STAT5b mRNA and protein, were stably transfected with a plasmid vector encoding shRNAs targeting the STAT5b transcripts. Two kinds of clones transfected with the STAT5b shRNAs exhibited the inhibition of STAT5b and uninhibited STAT5a (the isoform of STAT5) expression after transfection. (B) Cell proliferation assay after the stable transfection. Sham and two kinds of STAT5b shRNA expressing clones were seeded in a 96-well plate at a density of 8.0×10³ cells/well and incubated at 37°C for 24, 48 or 72 h. After the indicated time, there was no significant difference at all in cell proliferation capability between sham and both STAT5b shRNA expressing clones.
Figure 4
Figure 4
Effects of STAT5b suppression on gemcitabine-treated actions. Sham and STAT5b shRNA clones, seeded in the same way as the cell proliferation assay, were treated with absence or presence of 100 or 1,000 µM gemcitabine for 48 or 72 h (A and B). Treatment with gemcitabine resulted in a dose-dependent reduction in cell growth. In the sham-transfected cells, a maximum decrease of 19.4% occurred at a concentration of 1,000 µM gemcitabine and 72-h incubation. By contrast, both STAT5b shRNA clones exhibited a significantly greater growth inhibitory effect of 32.6% (P<0.01) and 52% (P<0.001), respectively with the same concentration of gemcitabine and incubation time. (A) *P<0.05, **P<0.02, P<0.01 and ††P<0.001. (B) *P<0.02, **P<0.01, P<0.01 and ††P<0.001.
Figure 4
Figure 4
Effects of STAT5b suppression on gemcitabine-treated actions. Sham and STAT5b shRNA clones, seeded in the same way as the cell proliferation assay, were treated with absence or presence of 100 or 1,000 µM gemcitabine for 48 or 72 h (A and B). Treatment with gemcitabine resulted in a dose-dependent reduction in cell growth. In the sham-transfected cells, a maximum decrease of 19.4% occurred at a concentration of 1,000 µM gemcitabine and 72-h incubation. By contrast, both STAT5b shRNA clones exhibited a significantly greater growth inhibitory effect of 32.6% (P<0.01) and 52% (P<0.001), respectively with the same concentration of gemcitabine and incubation time. (A) *P<0.05, **P<0.02, P<0.01 and ††P<0.001. (B) *P<0.02, **P<0.01, P<0.01 and ††P<0.001.
Figure 5
Figure 5
Treatment with gemcitabine for 72 h resulted in a dose-dependent decrease in cell growth. In the PANC-1 cells which expressed relatively high levels of STAT5b, a maximum decrease occurred at a concentration of 1,000 µM gemcitabine and 72-h incubation. Compared to PANC-1 cells, both AsPC-1 and BxPC3 cells which express relatively low levels of STAT5b, exhibited significantly decreased growth by treatment with gemcitabine for 72 h. *P<0.01, **P<0.01, ***P<0.01, P<0.002, ††P<0.001 and †††P<0.01.
Figure 6
Figure 6
Effects of overexpressed STAT5b levels on the growth of AsPC-1 cells and on gemcitabine-treated actions. (A) Western blot analysis of STAT5b protein levels after stable transfection. AsPC-1 cells, which express relatively low levels of STAT5b protein, were stably transfected with a plasmid vector encoding STAT5b full-length cDNA. Clones transfected with the STAT5b cDNA exhibited overexpression of STAT5b by western blotting. (B) Cell proliferation assay after the stable transfection. Sham and two kinds of STAT5b overexpressing clones were seeded in a 96-well plate at a density of 8.0×10³ cells/well and incubated at 37°C for 24, 48 and 72 h. After the specified time, no significant difference in cell proliferation capability was observed between sham and the STAT5b overexpressing clones. (C) Cell proliferation assay with gemcitabine treatment after the stable transfection. Treatment with gemcitabine for 72 h resulted in a significant increase in growth of overexpressed clones compared to sham. *P<0.03, **P<0.02 and P<0.03.
Figure 6
Figure 6
Effects of overexpressed STAT5b levels on the growth of AsPC-1 cells and on gemcitabine-treated actions. (A) Western blot analysis of STAT5b protein levels after stable transfection. AsPC-1 cells, which express relatively low levels of STAT5b protein, were stably transfected with a plasmid vector encoding STAT5b full-length cDNA. Clones transfected with the STAT5b cDNA exhibited overexpression of STAT5b by western blotting. (B) Cell proliferation assay after the stable transfection. Sham and two kinds of STAT5b overexpressing clones were seeded in a 96-well plate at a density of 8.0×10³ cells/well and incubated at 37°C for 24, 48 and 72 h. After the specified time, no significant difference in cell proliferation capability was observed between sham and the STAT5b overexpressing clones. (C) Cell proliferation assay with gemcitabine treatment after the stable transfection. Treatment with gemcitabine for 72 h resulted in a significant increase in growth of overexpressed clones compared to sham. *P<0.03, **P<0.02 and P<0.03.
Figure 7
Figure 7
Effects of gemcitabine on pro-apoptotic actions and apoptosis-regulating proteins, Bcl-xL. (A) Western blot analysis of cleaved caspase-3 and PARP (known as apoptosis-related proteins). Both STAT5b shRNA clones exhibited a stronger expression of cleaved caspase-3 and PARP than the sham-transfected cells after treatment with gemcitabine for 72 h. (B) Western blot analysis of Bcl-xL. Gemcitabine markedly reduced Bcl-xL protein levels in STAT5b shRNA cells after treatment with gemcitabine for 48 h, compared to sham-transfected cells. (C and D) Densitometry of PARP and Bcl-xL proteins. The band densities of PARP protein (C) significantly increased in STAT5b shRNA clones compared to sham-transfected cells (*P<0.002 and **P<0.001). The band densities of Bcl-xL protein (D) significantly decreased in STAT5b shRNA clone compared to sham-transfected cells (*P<0.02 and **P<0.04).
Figure 7
Figure 7
Effects of gemcitabine on pro-apoptotic actions and apoptosis-regulating proteins, Bcl-xL. (A) Western blot analysis of cleaved caspase-3 and PARP (known as apoptosis-related proteins). Both STAT5b shRNA clones exhibited a stronger expression of cleaved caspase-3 and PARP than the sham-transfected cells after treatment with gemcitabine for 72 h. (B) Western blot analysis of Bcl-xL. Gemcitabine markedly reduced Bcl-xL protein levels in STAT5b shRNA cells after treatment with gemcitabine for 48 h, compared to sham-transfected cells. (C and D) Densitometry of PARP and Bcl-xL proteins. The band densities of PARP protein (C) significantly increased in STAT5b shRNA clones compared to sham-transfected cells (*P<0.002 and **P<0.001). The band densities of Bcl-xL protein (D) significantly decreased in STAT5b shRNA clone compared to sham-transfected cells (*P<0.02 and **P<0.04).
Figure 8
Figure 8
Effects of reduced STAT5b levels in PANC-1 cells on adhesion and invasion. (A) Adhesion assay with sham-transfected and STAT5b shRNA expressing clones. In comparison with sham-transfected cells, both STAT5b shRNA expressing clones exhibited a significantly reduced adhesion to fibronectin, laminin and collagen IV, which are known as major types of extracellular matrices. *P<0.001, P<0.001, #P<0.02 and ##P<0.01. (B) Invasion assay with sham-transfected and STAT5b shRNA expressing clones. In comparison with sham-transfected cells, both STAT5b shRNA clones exhibited significantly reduced ability to invade across a Matrigel membrane treated with FBS, EGF and PDGF. *P<0.02, **P<0.01, P<0.01, #P<0.02 and ##P<0.01.
Figure 8
Figure 8
Effects of reduced STAT5b levels in PANC-1 cells on adhesion and invasion. (A) Adhesion assay with sham-transfected and STAT5b shRNA expressing clones. In comparison with sham-transfected cells, both STAT5b shRNA expressing clones exhibited a significantly reduced adhesion to fibronectin, laminin and collagen IV, which are known as major types of extracellular matrices. *P<0.001, P<0.001, #P<0.02 and ##P<0.01. (B) Invasion assay with sham-transfected and STAT5b shRNA expressing clones. In comparison with sham-transfected cells, both STAT5b shRNA clones exhibited significantly reduced ability to invade across a Matrigel membrane treated with FBS, EGF and PDGF. *P<0.02, **P<0.01, P<0.01, #P<0.02 and ##P<0.01.
Figure 9
Figure 9
Cumulative Kaplan-Meier survival curve and correlation of clinicopathological characteristics with STAT5b expression. Immunohistochemical results for STAT5b were evaluated as the expression index; 'staining percentage of the tumor cells' multiplied by 'staining intensity (0–2)'. (A) We set 0–20 index as weak (29 cases, original magnification, ×400), and (B) 30–120 index as strong (15 cases, original magnification, ×400). (C) Cumulative Kaplan-Meier survival curve. A significant difference (P=0.35) was not observed in the overall survival rates of the STAT5b-weak group and STAT5b-strong group.
Figure 9
Figure 9
Cumulative Kaplan-Meier survival curve and correlation of clinicopathological characteristics with STAT5b expression. Immunohistochemical results for STAT5b were evaluated as the expression index; 'staining percentage of the tumor cells' multiplied by 'staining intensity (0–2)'. (A) We set 0–20 index as weak (29 cases, original magnification, ×400), and (B) 30–120 index as strong (15 cases, original magnification, ×400). (C) Cumulative Kaplan-Meier survival curve. A significant difference (P=0.35) was not observed in the overall survival rates of the STAT5b-weak group and STAT5b-strong group.

References

    1. Siegel R, Ma J, Zou Z, Jemal A. Cancer statistics, 2014. CA Cancer J Clin. 2014;64:9–29. doi: 10.3322/caac.21208. - DOI - PubMed
    1. Hidalgo M. Pancreatic cancer. N Engl J Med. 2010;362:1605–1617. doi: 10.1056/NEJMra0901557. - DOI - PubMed
    1. Stathis A, Moore MJ. Advanced pancreatic carcinoma: Current treatment and future challenges. Nat Rev Clin Oncol. 2010;7:163–172. doi: 10.1038/nrclinonc.2009.236. - DOI - PubMed
    1. Burris HA, III, Moore MJ, Andersen J, Green MR, Rothenberg ML, Modiano MR, Cripps MC, Portenoy RK, Storniolo AM, Tarassoff P, et al. Improvements in survival and clinical benefit with gemcitabine as first-line therapy for patients with advanced pancreas cancer: A randomized trial. J Clin Oncol. 1997;15:2403–2413. - PubMed
    1. Mini E, Nobili S, Caciagli B, Landini I, Mazzei T. Cellular pharmacology of gemcitabine. Ann Oncol. 2006;17(Suppl 5):v7–v12. doi: 10.1093/annonc/mdj941. - DOI - PubMed

MeSH terms